

Abstract
Background and objectives: Muscle mass is not a major determinant of serum cystatin C levels, and its use to estimate GFR may lead to more congruent estimates of chronic kidney disease (CKD) across gender and racial/ethnic groups.
Design, setting, participants, & measurements: The Multi-Ethnic Study of Atherosclerosis is a population-based study of 6814 men and women who are aged 45 to 85 yr and do not have clinical cardiovascular disease. Estimated CKD prevalence, defined as an estimated GFR <60 ml/min per 1.73 m2 body surface area, was compared using three different GFR prediction equations: The abbreviated Modification of Diet in Renal Disease (MDRD) equation and two equations based on serum cystatin C.
Results: Among women, CKD prevalence estimates across the four racial/ethnic groups using the MDRD- or the cystatin C–based GFR equations, which include gender and race coefficients, varied by approximately two-fold (P < 0.0001) but were more congruent with use of a serum cystatin C–based equation without the use of coefficients (P = 0.3). CKD prevalence estimates did not differ significantly across racial/ethnic groups among men with the MDRD (P = 0.07) or cystatin C formula without coefficients (P = 0.05) but did differ significantly with the cystatin C formula, which incorporates gender and race coefficients (P = 0.006).
Conclusions: CKD prevalence estimates vary across racial/ethnic groups, and the degree of variability depends on the method used to estimate GFR, especially among women. Further research is needed to determine the accuracy and precision of GFR prediction equations in racially diverse populations.
The Modification of Diet and Renal Disease (MDRD) GFR prediction equation (1) is routinely used to estimate GFR (estimated GFR [eGFR]) and diagnose chronic kidney disease (CKD) in both research and clinical practice. This formula estimates GFR using serum creatinine and adjusts for age, black race, and gender; however, no adjustment is made for other nonwhite racial/ethnic groups. In addition, serum creatinine levels are influenced by muscle mass and tubular secretion, and GFR levels may differ between individuals for a given serum creatinine level. Thus, GFR may decrease markedly while serum creatinine remains within the normal range (2).
Serum cystatin C has been proposed as an alternative marker for estimating GFR. Produced by most nucleated cells, this cysteine proteinase inhibitor is freely filtered by the glomerulus (3), and its serum concentration is determined predominantly by GFR. The drawbacks to cystatin C as a marker of GFR include higher concentrations in the setting of hyperthyroidism (4) and steroid use (5,6) and limited data on its extrarenal clearance (7). In a cross-sectional population-based study of the Netherlands, a substantially stronger correlation was noted between cystatin C and C-reactive protein (CRP; r = 0.26; P < 0.001) than with serum creatinine and CRP (r = 0.03; P < 0.001), which suggests that cystatin C may be influenced by inflammation (8); however, muscle mass is not a determinant of cystatin C values (9,10). Thus, estimates of CKD using serum cystatin C may be more congruent across gender and racial/ethnic groups compared with estimates using serum creatinine, because differences in muscle mass will not influence CKD estimates with use of cystatin C.
This study compared prevalence estimates of CKD among gender and racial/ethnic groups using three different GFR prediction equations: One based on creatinine (MDRD) and two equations based on cystatin C. We hypothesized that prevalence estimates of CKD would be more uniform across racial/ethnic and gender subgroups using methods based on serum cystatin C compared with methods using serum creatinine.
Materials and Methods
Study Population
The Multi-Ethnic Study of Atherosclerosis (MESA) is a population-based study of 6814 men and women who are aged 45 to 84 yr, have no clinical cardiovascular disease, and were recruited from six US communities (Baltimore, MD; Chicago, IL; Forsyth County, NC; Los Angeles County, CA; northern Manhattan, NY; and St. Paul, MN). The main objective is to determine the characteristics of subclinical cardiovascular disease and its progression. Sampling and recruitment procedures have been described in detail (11). Individuals with symptoms or history of medical or surgical treatment for cardiovascular disease were excluded. During the recruitment process, potential participants were asked about their race/ethnicity using questions based on the US 2000 census questionnaire. Individuals who self-reported their race/ethnicity group as white or Caucasian, black or African-American, Chinese, or Spanish/Hispanic/Latino were asked to participate. Race/ethnicity was then categorized as white (non-Hispanic), black (non-Hispanic), Chinese, and Hispanic. Individuals were enrolled between August 1, 2000, and July 30, 2002. Institutional review board approval was obtained at all MESA sites. Among all 6814 MESA participants, 64 were excluded because of missing cystatin C (n = 57) or serum creatinine (n = 7) values. Three participants with cystatin C mg/L or creatinine values <0.4 mg/dl were also excluded because of possibility of data error. The total sample for all analyses included 6747 MESA participants.
Estimation of CKD
Cystatin C was measured using a BNII nephelometer (Dade Behring, Deerfield, IL) that uses a particle-enhanced immunonepholometric assay (N Latex Cystatin-C) (12) on fasting plasma specimens stored at −70°C. The assay is stable over five cycles of freeze/thaw. Among 61 healthy individuals with three cystatin C measurements during a 6-mo period, the intraindividual coefficient of variation was 7.7%. Serum creatinine was measured by rate reflectance spectrophotometry using thin film adaptation of the creatine amidinohydrolase method on the Vitros analyzer (Johnson & Johnson Clinical Diagnostics, Rochester, NY). The laboratory analytical coefficient of variation is 2.2%. All creatinine measurements for the MDRD Study were performed at Cleveland Clinic laboratories using a CX3 assay. The Vitros analyzer used here was previously calibrated to a CX3 machine with the Cleveland Clinic laboratory, and the results were found to be nearly identical. On the basis of calibration, all serum creatinine values were adjusted using the following regression formula: Adjusted creatinine = 0.9954 × (serum creatinine) + 0.0208.
Three GFR (ml/min per 1.73 m2 body surface are [BSA]) prediction formulas were used to estimate CKD:
 |
 |
 |
The GFR prediction equations that are based on cystatin C alone were developed in two thirds of the pooled sample of MDRD, African-American Study of Kidney Disease (AASK), and Collaborative Study Group (CSG) participants (n = 1935) and internally validated in the remaining one third (n = 1045). External validation was then performed in a clinical population from Paris, France (n = 438). GFR was directly measured using clearance of 125I-iothalamate in the MDRD, AASK, and CSG participants and 51Cr-EDTA in Paris; mean values of GFR, serum creatinine, and serum cystatin C were 48 ml/min per 1.73 m2, 2.1 mg/dl, and 1.8 mg/L, respectively. CKD was defined as an eGFR <60 ml/min per 1.73 m2 BSA.
Covariates
All MESA participants completed self-administered questionnaires and were interviewed by trained research staff to collect information pertaining to demographic characteristics, medical history, medication, and alcohol and tobacco use (14). Self-administered questionnaires were available in English, Spanish, and Chinese. Trained and certified clinic staff obtained BP and anthropometric measurements on all MESA participants during the baseline visit. After a 5-min rest, BP was measured three times at 1-min intervals using a Dinamap PRO 100 automated oscillometric device (Critikon, Tampa, FL) with the participant in a seated position with the back and arm supported (15). The average of the second and third BP measurements was used for this analysis. Diagnosis of hypertension was defined as self-reported treatment for hypertension or a systolic BP ≥140 mmHg or diastolic BP ≥90 mmHg. Presence of diabetes was based on self-reported physician diagnosis, use of insulin or oral hypoglycemic agent, or fasting glucose value ≥126 mg/dl. Body mass index was calculated as weight in kilograms divided by height in meters squared.
Statistical Analysis
Means and SD were used to summarize the characteristics of the study participants across the four racial/ethnic groups after stratification by gender. Continuous and categorical variables were compared using ANOVA and the χ2 statistic, respectively. When the global ANOVA or χ2 tests were significant, all nonwhite race/ethnicity groups were then compared with white individuals. The level for statistical significance was set at P < 0.008 (0.05/6) to account for multiple comparisons (white men and women versus three nonwhite racial/ethnic groups of men and women).
Spearman correlation coefficients between cystatin C, creatinine, and selected variables including height and weight were calculated after natural log transformation of cystatin C and creatinine values. To determine whether differences in CKD estimates among the nonwhite racial/ethnic groups compared with white individuals could be explained by demographic characteristics and differences in CKD risk factors, we used multivariate logistic regression to determine the odds of CKD in each nonwhite racial/ethnic group compared with white individuals by each of the three formulas. All regression analyses were performed after stratification by gender. The logistic regression model adjusted for age, body mass index, racial/ethnic group, presence of diabetes, hypertension, and current smoking status, factors that may account for differences in GFR and creatinine among the racial/ethnic groups.
Results
The total sample for this study included 6747 men and women (38% white, 28% black, 12% Chinese, and 22% Hispanic) between the ages of 45 and 84 yr. Table 1 shows the demographic characteristics and mean values of serum creatinine and cystatin C by racial/ethnic group and by gender. Mean age across groups was similar, but weight was highest among black men and women and lowest among Chinese men and women. Serum creatinine was significantly higher among black men and lower among Chinese and Hispanic men compared with white men. Similar findings were noted among women. Among both men and women, cystatin C levels did not differ significantly among black and Hispanic compared with white individuals; however, cystatin C levels were significantly lower among Chinese men and women compared with white men and women, respectively. Both cystatin C and creatinine values were consistently higher among men compared with women in all racial/ethnic groups, but these differences were substantially larger for serum creatinine than for cystatin C (Figure 1). Within each racial group, cystatin C levels between men and women differed by 0.04 to 0.05 mg/L, approximately a 5% difference. In contrast, gender differences in creatinine levels varied across racial ethnic groups, ranging from 18% higher among white men compared with white women to 22% higher among black men compared with black women.
Table 1.
Characteristics of the Multi-Ethnic Study of Atherosclerosis Participants by gender and by racial/ethnic groupa
| Characteristic | Men |
Women |
||||||
|---|---|---|---|---|---|---|---|---|
| White(n = 1247) | Chinese(n = 385) | Black(n = 836) | Hispanic(n = 716) | White(n = 1347) | Chinese(n = 413) | Black(n = 1034) | Hispanic(n = 769) | |
| Age | 63.2 (10.2) | 63.1 (10.3) | 62.8 (10.2) | 61.6 (10.3) | 63.0 (10.3) | 62.8 (10.4) | 62.7 (10.0) | 61.9 (10.4) |
| Height (m) | 1.8 (0.07) | 1.7 (0.06)e | 1.8 (0.07) | 1.7 (0.07) | 1.6 (0.07) | 1.6 (0.06) | 1.6 (0.07) | 1.6 (0.06) |
| Weight (kg) | 87.1 (14.4) | 68.2 (10.4)e | 89.5 (16.3)e | 82.3 (14.0) | 72.7 (16.1) | 57.9 (9.3)e | 82.3 (17.6)e | 72.7 (14.7) |
| BMI (kg/m2) | 28.0 (4.1) | 24.1 (3.1)e | 28.8 (4.7)e | 28.8 (4.3) | 27.6 (5.8) | 23.9 (3.4)e | 31.2 (6.4)e | 30.0 (5.6)e |
| % Diabetes | 10.0 | 15.8e | 22.1e | 5.6e | 5.9 | 14.8e | 18.6e | 19.6e |
| % Hypertension | 38.5 | 36.0 | 57.5e | 37.8 | 37.8 | 41.4 | 62.1e | 45.0e |
| % Smokers | 11.1 | 9.6 | 20.0e | 16.6e | 12.0 | 1.7e | 15.9e | 10.8 |
| Creatinine (mg/dl) | 1.08 (0.18) | 1.04 (0.21)e | 1.18 (0.42)e | 1.03 (0.40)e | 0.88 (0.20) | 0.80 (0.15)e | 0.92 (0.19)e | 0.82 (0.26)e |
| Cystatin C (mg/L) | 0.93 (0.20) | 0.88 (0.19)e | 0.91 (0.32) | 0.92 (0.34) | 0.89 (0.20) | 0.83 (0.20)e | 0.87 (0.21) | 0.88 (0.23) |
| eGFRSCrb | 76.3 (13.8) | 79.9 (15.5)e | 86.0 (19.4)e | 83.0 (17.8)e | 71.9 (13.5) | 80.4 (16.2)e | 82.9 (17.7)e | 79.6 (17.4)e |
| eGFRCysCc | 87.2 (18.8) | 93.6 (19.6)e | 91.8 (21.6)e | 90.1 (20.5) | 93.3 (21.9)e | 101.9 (24.5) | 95.7 (23.5) | 94.0 (21.5) |
| eGFRCoCysCd | 84.9 (18.9) | 91.1 (19.8)e | 94.8 (22.8)e | 88.0 (20.5)e | 82.7 (20.1) | 90.3 (22.6)e | 89.9 (22.7)e | 83.5 (19.8) |
Data are mean (SD) or percentages. BMI, body mass index; eGFR, estimated GFR.
eGFRSCr(ml/min per 1.73 m2 body surface area [BSA]) = 186 × (creatinine)−1.154 × (age)−0.203 × 0.742 (if female) × 1.21 (if black).
eGFRCysC (ml/min per 1.73 m2 BSA) = 76.7 × (cystatin C)−1.19.
eGFRCoCysC (ml/min per 1.73 m2 BSA) = 127.7 × (cystatin C)−1.17 × (age)−0.13 × 0.91 (if female) × 1.06 (if black).
P < 0.008 versus white men (if male) or white women (if female).
Figure 1.
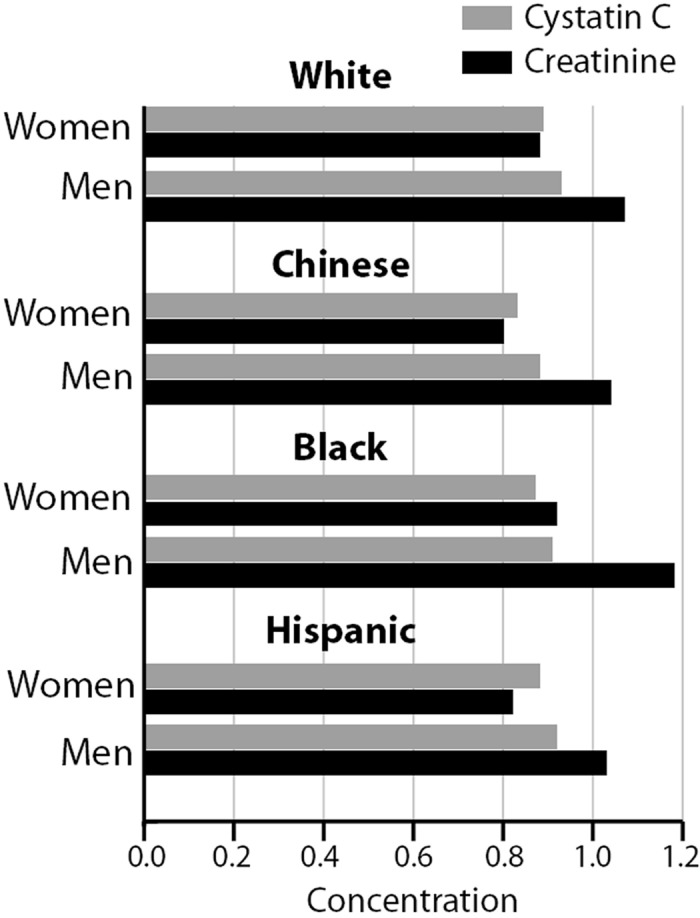
Distribution of serum creatinine (mg/dl) and cystatin C (mg/L) concentrations among men and women and by racial/ethnic group.
The correlations of age, height, weight, and CRP with creatinine, cystatin C, and eGFR are displayed in Table 2. Cystatin C had a higher correlation with age compared with creatinine (r = 0.41 versus r = 0.13), whereas creatinine had higher correlations with height and weight compared with cystatin C. GFR estimated with cystatin C (eGFRCysC and eGFRCoCysC) was significantly (P < 0.0001) correlated with eGFRSCr.
Table 2.
Spearman correlations between selected variables and creatinine and cystatin C among the Multi-Ethnic Study of Atherosclerosis Participants
| Parameter | Age | Height | Weight | CRP | eGFRSCr |
|---|---|---|---|---|---|
| Creatinine | 0.13d | 0.46d | 0.28d | −0.07e | −0.66d |
| Cystatin C | 0.41d | 0.04e | 0.18d | 0.15d | −0.54d |
| eGFRSCra | −0.32d | 0.05d | 0.05e | 0.01 | 1.00 |
| eGFRCysCb | −0.41d | −0.05e | −0.18d | −0.15d | 0.54d |
| eGFRCoCysCc | −0.47d | 0.04f | −0.05d | −0.011d | 0.59d |
eGFRSCr (ml/min per 1.73 m2 body surface area [BSA]) = 186 × (creatinine)−1.154 × (age)−0.203 × 0.742 (if female) × 1.21 (if black).
eGFRCysC (ml/min per 1.73 m2 BSA) = 76.7 × (cystatin C)−1.19.
eGFRCoCysC (ml/min per 1.73 m2 BSA) = 127.7 × (cystatin C)−1.17 × (age)−0.13 × 0.91 (if female) × 1.06 (if black).
P < 0.0001.
P < 0.001.
P < 0.01.
Among the white, black, and Hispanic racial/ethnic groups, CKD prevalence estimates were higher among men compared with women with use of the eGFRCysC prediction equation and lower among men compared with women with use of the eGFRCoCysC prediction equation (Figure 2). In contrast, CKD prevalence estimates were consistently higher among Chinese women compared with Chinese men. CKD prevalence estimates with the three GFR prediction equations varied by approximately three-fold among white women and Chinese men and by two-fold among Chinese and Hispanic women. In the other gender and racial/ethnic subgroups, CKD prevalence estimates with the three GFR prediction equations varied by 22 to 44%. Similar CKD prevalence estimates were noted among women across the four racial/ethnic groups with the eGFRCysC equation, ranging from 3.9% in Hispanic women to 5.4% in white women (P = 0.3), whereas CKD prevalence estimates varied by approximately two-fold with the eGFRSCr equation (P < 0.0001) and the eGFRCoCysC equation (P = 0.006). Among men, the widest range of CKD prevalence estimates was noted with the eGFRCoCysC equation (9.0% in white to 4.4% in Chinese; P = 0.006).
Figure 2.
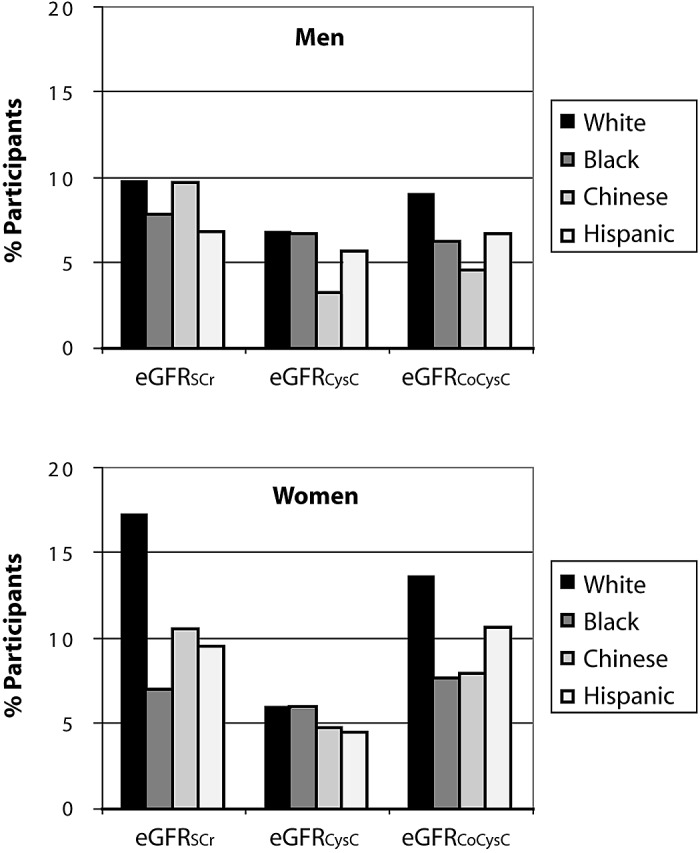
Unadjusted chronic kidney disease (CKD) prevalence estimates by GFR prediction equation and by racial/ethnic group among men (top) and women (bottom). *P < 0.008 versus white men (if male) or white women (if female).
The unadjusted and adjusted odds of CKD by racial/ethnic group compared with white individuals using the three different GFR equations in men and women are shown in Figure 3. Adjusted odds ratios for CKD in the gender and racial/ethnic subgroups compared with white individuals all were <1.00 and fairly similar with each of the three GFR prediction equations except among Chinese participants. Among Chinese men, the multivariate adjusted odds of CKD compared with white individuals ranged from 1.17 (95% confidence interval [CI] 0.77 to 1.78) with the eGFRSCr formula to 0.58 (95% CI 0.31 to 1.11) with the eGFRCysC formula. In contrast, Chinese women had a 48% lower adjusted odds of CKD (95% CI 0.35 to 0.75) with use of the eGFRSCr formula and 13% higher odds of CKD (95% CI 0.68 to 1.90) with the eGFRCysC formula compared with white women.
Figure 3.
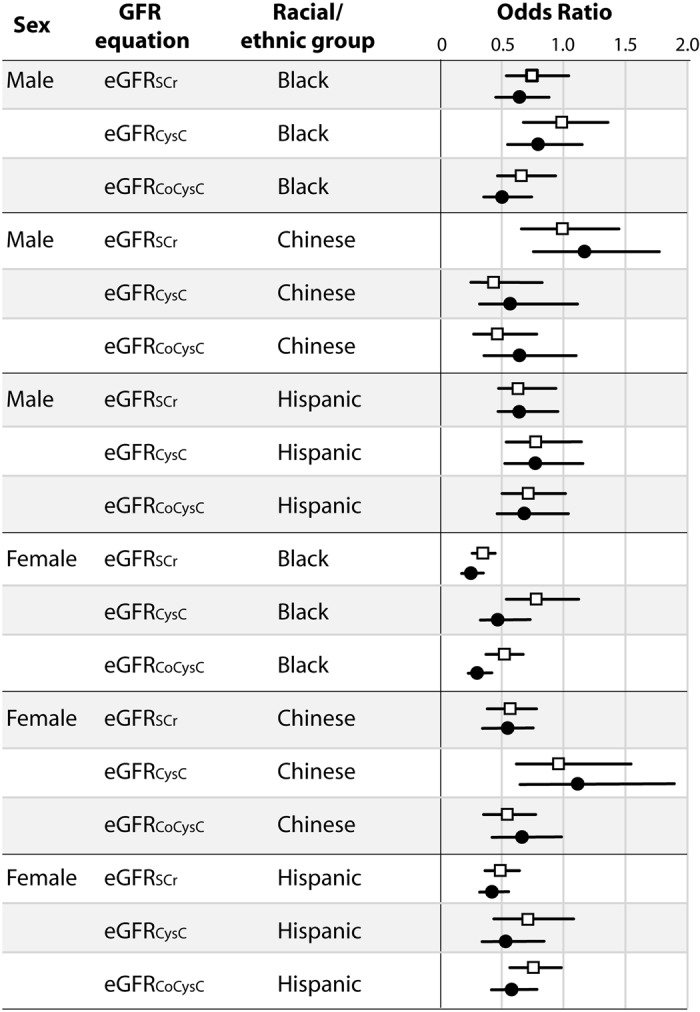
Unadjusted and adjusted odds ratios of CKD by gender, race/ethnicity, and GFR prediction equation compared with white individuals. *Adjusted for age, race/ethnicity, body mass index, presence of diabetes, hypertension, and current smoking.
Discussion
Using baseline measures from a multiethnic cohort of adults without established cardiovascular disease, we noted marked differences in CKD prevalence estimates across racial/ethnic groups with use of the MDRD and cystatin C GFR equations with gender and race coefficients among women. Differences in CKD prevalence estimates among women were substantially attenuated with use of the cystatin C–based GFR prediction equation without gender and race coefficients. Discrepancies in CKD estimates could be attributable to differences in non-GFR determinants of serum creatinine and cystatin C, differential accuracies of the GFR equations across racial/ethnic groups, and use of a race coefficient that accounts only for black and white individuals. The growth of ESRD in nonblack minority groups demonstrates an urgent need for closer attention to CKD and its progression in these populations. Incident ESRD among Asians has increased six-fold in the past two decades, whereas the number of Hispanic incident patients with ESRD has increased by 63% since 1996 (16). Although ESRD incidence is higher among nonwhite racial/ethnic groups compared with white individuals in the United States, CKD prevalence, defined as a GFR <60 ml/min per 1.73 m2 BSA estimated with the modified MDRD formula, is higher among white compared with nonwhite racial/ethnic groups (16). Higher ESRD rates among nonwhite compared with white adults seems not to be a function of increased CKD prevalence but rather a higher rate of progression to CKD to ESRD (17); however, information on CKD prevalence in many nonwhite racial/ethnic groups remains limited.
Current guidelines for detection of CKD recommend the use of equations that are based on serum creatinine, such as the MDRD GFR prediction equation or the Cockroft-Gault formula, which estimates creatinine clearance (18). Among both men and women, serum creatinine levels differed significantly in each nonwhite racial/ethnic group compared with white men and women, respectively. In contrast, cystatin C levels among black and Hispanic men and women did not differ significantly from white men and women, respectively; however, among Chinese participants, cystatin C levels were significantly lower among men and women compared with white men and women, respectively. Currently, there are no GFR prediction equations that account for potential serum creatinine differences between white and other racial/ethnic groups such as Hispanic or Chinese. The abbreviated MDRD GFR prediction equation showed <50% accuracy within ±30% among Chinese adults with direct GFR measurements <60 ml/min per 1.73 m2 (19). Although modifications of the abbreviated MDRD formula have been developed for Chinese (20) and Japanese adults (21), use of one formula for all racial/ethnic groups may simplify the application of GFR prediction equations for clinicians and boost CKD screening.
This study noted marked gender differences in CKD prevalence using creatinine-based GFR equations, especially among white individuals, and these differences were attenuated with use of cystatin C–based equations, especially without the use of gender and race coefficients. The use of gender and race coefficients seems to improve the accuracy (percentage of eGFR within 30% of measured GFR) of cystatin C–based equations in populations enriched with CKD (13), but this may not be true in healthy or older populations or in all racial/ethnic groups. Previous investigators suggested that cystatin C avoids potential bias in GFR estimates as a result of gender. Rule et al. (22) directly measured GFR using iothalamate clearance in 460 patients with a variety of clinical presentations, and creatinine and cystatin C were also measured. In this study, direct GFR measurements were 23% (P < 0.001) lower among women compared with men for a given creatinine level. In contrast, no significant difference in direct GFR measurements between men and women were observed for a given cystatin C level (P = 0.18). The majority of participants in this study were white (97%), and it is possible that these findings may not be true in other racial/ethnic groups.
This study explored differences in estimated CKD prevalence using creatinine- or cystatin C–based GFR prediction equations. Given the lack of a gold standard for determining GFR in MESA, we cannot determine the accuracy of the CKD prevalence estimates; however, the substantial differences in CKD prevalence across racial/ethnic groups, especially among women, using the three GFR prediction formulas demonstrate a need for further research to determine the accuracy and precision of GFR prediction equations in racially diverse populations. The GFR prediction equations based on cystatin C were developed in a pooled sample of adults with CKD and validated in several populations with direct GFR measurements. The accuracy and precision of these equations were very similar to creatinine-based GFR equations (13), but comparisons were performed in populations enriched with CKD and did not include substantial numbers of Asian or Hispanic individuals.
Conclusions
This study demonstrates that CKD prevalence estimates vary across racial/ethnic groups, and the degree of variability depends on the method used to estimate GFR, especially among women. More studies are needed to assess the accuracy of GFR prediction equations in racially diverse populations.
Disclosures
None.
Acknowledgments
This research was supported by contracts N01-HC-95159 through N01-HC-95166 from the National Heart, Lung, and Blood Institute. M.S. is supported by R01 DK066488-01 and the American Heart Association Established Investigator Award.
We thank the other investigators, the staff, and the participants of the MESA for their valuable contributions. A full list of participating MESA investigators and institutions can be found at http://www.mesa-nhlbi.org.
Published online ahead of print. Publication date available at www.cjasn.org.
References
- 1.Levey AS, Bosch JP, Lewis JB, Greene T, Rogers N, Roth D: A more accurate method to estimate glomerular filtration rate from serum creatinine: A new prediction equation. Modification of Diet in Renal Disease Study Group. Ann Intern Med 130 :461 –470,1999 [DOI] [PubMed] [Google Scholar]
- 2.Shemesh O, Golbetz H, Kriss JP, Myers BD: Limitations of creatinine as a filtration marker in glomerulopathic patients. Kidney Int 28 :830 –838,1985 [DOI] [PubMed] [Google Scholar]
- 3.Randers E, Erlandsen EJ: Serum cystatin C as an endogenous marker of the renal function: A review. Clin Chem Lab Med 37 :389 –395,1999 [DOI] [PubMed] [Google Scholar]
- 4.Manetti L, Pardini E, Genovesi M, Campomori A, Grasso L, Morselli LL, Lupi I, Pellegrini G, Bartalena L, Bogazzi F, Martino E: Thyroid function differently affects serum cystatin C and creatinine concentrations. J Endocrinol Invest 28 :346 –349,2005 [DOI] [PubMed] [Google Scholar]
- 5.Bokenkamp A, Domanetzki M, Zinck R, Schumann G, Byrd D, Brodehl J: Cystatin C serum concentrations underestimate glomerular filtration rate in renal transplant recipients. Clin Chem 45 :1866 –1868,1999 [PubMed] [Google Scholar]
- 6.Risch L, Herklotz R, Blumberg A, Huber AR: Effects of glucocorticoid immunosuppression on serum cystatin C concentrations in renal transplant patients. Clin Chem 47 :2055 –2059,2001 [PubMed] [Google Scholar]
- 7.Madero M, Sarnak MJ, Stevens LA: Serum cystatin C as a marker of glomerular filtration rate. Curr Opin Nephrol Hypertens 15 :610 –616,2006 [DOI] [PubMed] [Google Scholar]
- 8.Knight EL, Verhave JC, Spiegelman D, Hillege HL, de Zeeuw D, Curhan GC, de Jong PE: Factors influencing serum cystatin C levels other than renal function and the impact on renal function measurement. Kidney Int 65 :1416 –1421,2004 [DOI] [PubMed] [Google Scholar]
- 9.Kyhse-Andersen J, Schmidt C, Nordin G, Andersson B, Nilsson-Ehle P, Lindstrom V, Grubb A: Serum cystatin C, determined by a rapid, automated particle-enhanced turbidimetric method, is a better marker than serum creatinine for glomerular filtration rate. Clin Chem 40 :1921 –1926,1994 [PubMed] [Google Scholar]
- 10.Vinge E, Lindergard B, Nilsson-Ehle P, Grubb A: Relationships among serum cystatin C, serum creatinine, lean tissue mass and glomerular filtration rate in healthy adults. Scand J Clin Lab Invest 59 :587 –592,1999 [DOI] [PubMed] [Google Scholar]
- 11.Bild DE, Bluemke DA, Burke GL, Detrano R, Diez Roux AV, Folsom AR, Greenland P, Jacob DR, Jr., Kronmal R, Liu K, Nelson JC, O'Leary D, Saad MF, Shea S, Szklo M, Tracy RP: Multi-ethnic study of atherosclerosis: objectives and design. Am J Epidemiol 156 :871 –881,2002 [DOI] [PubMed] [Google Scholar]
- 12.Erlandsen EJ, Randers E, Kristensen JH: Evaluation of the Dade Behring N Latex Cystatin C assay on the Dade Behring Nephelometer II System. Scand J Clin Lab Invest 59 :1 –8,1999 [DOI] [PubMed] [Google Scholar]
- 13.Stevens L, Coresh J, Schmid CH, Feldman HI, Froissart M, Kusek J, Rossert J, Van Lente F, Bruce RD, Zhang Y, Greene T, Levey A: Estimating GFR using serum cystatin C alone and in combination with serum creatinine: A pooled analysis of 3418 individuals with CKD. Am J Kidney Dis 51 :395 –406,2008 [DOI] [PMC free article] [PubMed] [Google Scholar]
- 14.MESA Coordinating Center, University of Washington: Multi-Ethnic Study of Atherosclerosis Field Center Manual of Operations,2001
- 15.Chang JJ, Rabinowitz D, Shea S: Sources of variability in blood pressure measurement using the Dinamap PRO 100 automated oscillometric device. Am J Epidemiol 158 :1218 –1226,2003 [DOI] [PubMed] [Google Scholar]
- 16.US Renal Data System: USRDS 2007 Annual Data Report: Atlas of End-Stage Renal Disease in the United States, Bethesda, National Institutes of Health, National Institute of Diabetes and Digestive Disease and Kidney Diseases,2007
- 17.Hsu CY, Lin F, Vittinghoff E, Shlipak MG: Racial differences in the progression from chronic renal insufficiency to end-stage renal disease in the United States. J Am Soc Nephrol 14 :2902 –2907,2003 [DOI] [PubMed] [Google Scholar]
- 18.National Kidney Foundation: K/DOQI clinical practice guidelines for chronic kidney disease: Evaluation, classification and stratification. Am J Kidney Dis 39 :S215 –S222,2002 [PubMed] [Google Scholar]
- 19.Zuo L, Ma YC, Zhou YH, Wang M, Xu GB, Wang HY: Application of GFR-estimating equations in Chinese patients with chronic kidney disease. Am J Kidney Dis 45 :463 –472,2005 [DOI] [PubMed] [Google Scholar]
- 20.Ma YC, Zuo L, Chen JH, Luo Q, Yu XQ, Li Y, Xu JS, Huang SM, Wang LN, Huang W, Wang M, Xu GB, Wang HY: Modified glomerular filtration rate estimating equation for Chinese patients with chronic kidney disease. J Am Soc Nephrol 17 :2937 –2944,2006 [DOI] [PubMed] [Google Scholar]
- 21.Imai E, Horio M, Iseki K, Yamagata K, Watanabe T, Hara S, Ura N, Kiyohara Y, Hirakata H, Moriyama T, Ando Y, Nitta K, Inaguma D, Narita I, Iso H, Wakai K, Yasuda Y, Tsukamoto Y, Ito S, Makino H, Hishida A, Matsuo S: Prevalence of chronic kidney disease (CKD) in the Japanese general population predicted by the MDRD equation modified by a Japanese coefficient. Clin Exp Nephrol 11 :156 –163,2007 [DOI] [PubMed] [Google Scholar]
- 22.Rule AD, Bergstralh EJ, Slezak JM, Bergert J, Larson TS: Glomerular filtration rate estimated by cystatin C among different clinical presentations. Kidney Int 69 :399 –405,2006 [DOI] [PubMed] [Google Scholar]