Abstract
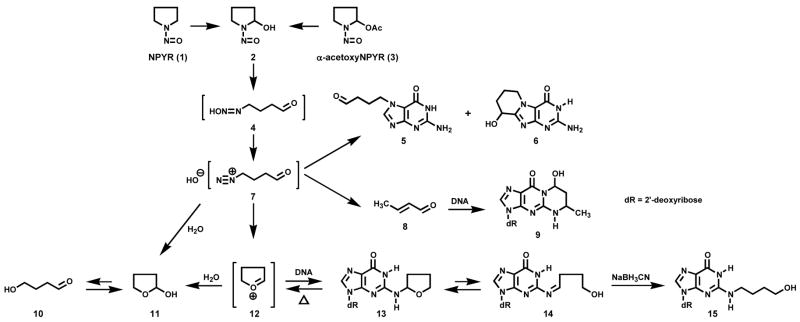
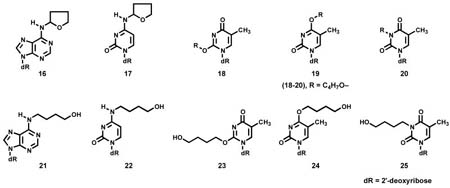
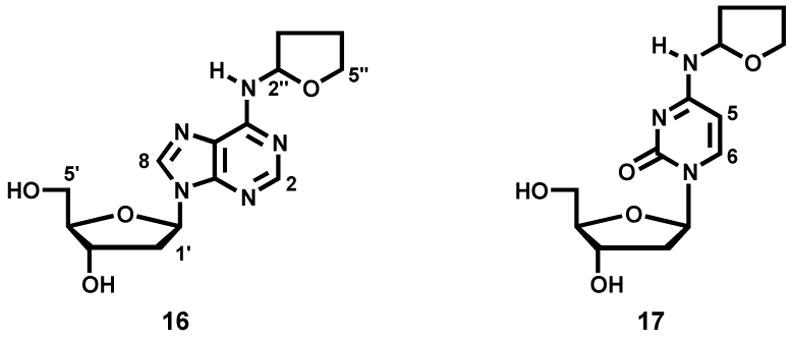
N-Nitrosopyrrolidine (NPYR) is a well-established hepatocarcinogen in the rat. NPYR requires metabolic activation by cytochrome P450-catalyzed α-hydroxylation to express its carcinogenic activity. This produces α-hydroxyNPYR (2) which spontaneously ring opens to 4-oxobutanediazohydroxide (4), a highly reactive intermediate which may itself modify DNA or yield a cascade of electrophiles which react with DNA to produce adducts. Multiple dGuo adducts formed in this reaction have been previously characterized, but there are no examples of adducts formed with other DNA nucleobases. In this study, we used α-acetoxyNPYR (3) as a stable precursor to α-hydroxyNPYR (2) and 4. α-AcetoxyNPYR (3) was allowed to react with DNA. The DNA was enzymatically hydrolyzed to deoxyribonucleosides and the products were analyzed by LC-ESI-MS and LC-ESI-MS/MS. Reactions of α-acetoxyNPYR with individual deoxyribonucleosides were also carried out. The products were identified by their MS, UV, and NMR spectra as N6-(tetrahydrofuran-2-yl)dAdo (16) and N4-(tetrahydrofuran-2-yl)dCyd (17) in addition to the previously characterized N2-(tetrahydrofuran-2-yl)dGuo (13). Unstable dThd adducts were also formed. Further characterization of the adducts was achieved by NaBH3CN reduction of the reaction mixtures of α-acetoxyNPYR with deoxyribonucleosides or DNA. This produced N6-(4-hydroxybut-1-yl)dAdo (21), N4-(4-hydroxybut-1-yl)dCyd (22), O2-(4-hydroxybut-1-yl)dThd (23), O4-(4-hydroxybut-1-yl)dThd (24), and 3-(4-hydroxybut-1-yl)dThd (25). Adducts 21 and 22 were characterized by their spectral properties while the dThd adducts 23–25 were identified by comparison to synthetic standards. The results of this study demonstrate that α-acetoxyNPYR forms adducts with dAdo, dCyd, and dThd in DNA, in addition to the previously characterized dGuo adducts. These newly characterized standards can be used to investigate DNA adduct formation in rats treated with NPYR.
Keywords: α-acetoxy-N-nitrosopyrrolidine, DNA adducts, dAdo adducts, dThd adducts, dCyd adducts
Introduction
N-Nitrosopyrrolidine [(NPYR (1), Scheme 1)] is a well-established carcinogen which induces predominantly liver tumors in rats and respiratory tract tumors in mice and Syrian golden hamsters (1–3). Extensive dose-response studies in rats have clearly demonstrated the robust carcinogenic activity of this nitrosamine (4). While less carcinogenic in the rat than the related open-chain nitrosamines N-nitrosodimethylamine and N-nitrosodiethylamine, NPYR nevertheless has considerable potency, readily inducing tumors in rats with TD50 values lower than those of 2-acetylaminofluorene and vinyl chloride, as examples (5). Furthermore, direct comparison of NPYR and 2-amino-3-methylimidazo[4,5-f]quinoline (IQ) demonstrates that NPYR is considerably more carcinogenic in rats (6–8).
Scheme 1.
Overview of Adduct Formation from NPYR (1) and α-AcetoxyNPYR (3)
NPYR is consistently detected in mainstream and sidestream cigarette smoke, and in fried bacon and other cured meats (9,10). It has also been identified in certain other dietary items and in drinking water (10,11). Exogenous human exposure to NPYR has been estimated as 0.01–0.15 μg per day (12,13). However, far greater exposure could occur by endogenous formation of NPYR. This is reasonable because pyrrolidine is a normal constituent of human blood, gastric juice, saliva, and urine (14). Nitrosation of pyrrolidine could plausibly occur in the stomach and elsewhere in the human body, analogous to the well-established endogenous nitrosation of the structurally related compound proline (15,16). Indeed, NPYR has been detected in human urine in several studies, and the reported amounts, together with data from studies in laboratory animals which indicate that little NPYR is excreted unchanged, indicate that daily human exposure to this carcinogen through endogenous formation may be as high as 10 μg per day (14,17–21).
NPYR requires metabolic activation to express its mutagenic and, presumably, its carcinogenic activity (22). Previous studies have clearly demonstrated that cytochrome P450-catalyzed α-hydroxylation of NPYR, which produces α-hydroxyNPYR (2, Scheme 1) and 4-oxobutanediazohydroxide (4) as key intermediates, is one mechanism by which NPYR is metabolically activated (7,23–30). Using α-acetoxyNPYR (3) as a stable precursor to 2, we have determined the structures of multiple dGuo adducts which are formed by this pathway, in reactions with both dGuo itself and DNA (31). Several DNA adducts resulting from α-hydroxylation, including adducts 5, 6, and 9 have been identified in hepatic DNA of rats treated with NPYR (32–35). Analyses of reactions of α-acetoxyNPYR with DNA demonstrate that N2-(tetrahydrofuran-2-yl)dGuo (N2-THF-dGuo, 13) is one of the predominant adducts which can be produced by α-hydroxylation, but there are no data in the literature regarding the formation of similar adducts with other DNA bases. A recent report indicates that dAdo or dThd adducts may be important in the induction of mutations by NPYR in rat liver (6). Therefore, in this study, we further investigated DNA adduct formation from α-acetoxyNPYR in vitro, with a focus on deoxyribonucleosides other than dGuo. Preliminary accounts of this research have been presented (36,37).
Experimental Procedures
Apparatus and Assay Conditions
HPLC analyses were carried out with Waters Associates (Waters Division, Millipore, Milford, MA) systems equipped with a model 991 or 996 photodiode array detector or with an Agilent 1100 Series autosampler (Agilent Technologies, Palo Alto, CA) coupled to a Waters Millipore automated gradient controller and model 6000 A solvent delivery system and equipped with a Gilson Model 116 UV detector (Gilson Medical Electronics, Middleton, WI). Elution systems were as follows.
System 1 was a 4.6 mm × 25 cm 5μm Supelcosil LC 18-DB column (Supelco, Bellefonte, PA) with isocratic elution by 5% MeOH in 40 mM NH4OAc buffer, pH 6.6, for 10 min, then a gradient from 5 to 35% MeOH in 60 min, then a gradient from 35 to 50 % MeOH over the course of 10 min at a flow rate of 0.5 mL/min with UV detection (254 nm). System 1 was used for analysis of adducts formed in the reaction of α-acetoxyNPYR with deoxyribonucleosides.
System 2 used the same column as System 1, with elution by a gradient from 15 to 35% MeOH in H2O for 20 min, then from 35 to 50% MeOH over the course of 10 min at a flow rate of 0.5 mL/min with UV detection (254 nm). This system was used for collection, desalting, and further purification of adducts.
System 3 was a 10 mm × 25 cm 5 μm Luna C18 column (Phenomenex, Torrance, CA) with isocratic elution by 5% CH3CN in H2O for 10 min, then a gradient from 5 to 35% CH3CN in 40 min, then a gradient from 35 to 50% CH3CN over the course of 10 min at a flow rate of 3 mL/min with UV detection (220 nm). This system was used for purification of synthetic standards of dThd adducts.
System 4 used the same HPLC column as system 3 with isocratic elution by 20% CH3CN in H2O for 10 min, then a gradient from 20 to 35% CH3CN over the course of 20 min, at a flow rate of 3 mL/min with UV detection (254 nm). This system was used to purify the intermediate O4-(4-acetoxybut-1-yl)dThd in the synthesis of 24.
System 5 used the same column as in System 1 with isocratic elution by 5% MeOH in 40 mM ammonium acetate buffer, pH 6.6, for 10 min, then a gradient from 5 to 35% MeOH over the course of 60 min, then from 35 to 65% MeOH in 20 min at a flow rate of 0.3 mL/min, with UV detection (254 nm). This system was used for LC-ESI-MS (LCQ-Deca instrument) analysis of adducts.
LC-ESI-MS analyses for identification of adducts in the reactions of α-acetoxyNPYR with DNA or deoxyribonucleosides was carried out on a Finnigan LCQ Deca instrument (ThermoElectron Division, San Jose, CA) interfaced with a Waters Alliance 2690 HPLC multi-solvent delivery system and equipped with an SPD-10A UV-Vis detector (Shimadzu Scientific Instruments, Columbia, MD). The ESI source was set as follows: voltage 2.0 kV; current 10 μA; and capillary temperature, 275 °C. MS/MS data were acquired with the following parameters: isolation width 1.5 amu; activation amplitude, 25–30%; activation Q, 0.25; and activation time, 30 ms.
Capillary LC-ESI-MS/MS-SIM analysis of adducts (Figure 6) was carried out with a Finnigan Quantum Discovery MAX instrument (Thermo Electron, San Jose, CA) interfaced with an Agilent 1100 capillary flow HPLC (Agilent Technologies, Palo Alto, CA) equipped with a 150 mm × 0.5 mm Zorbax SB C18 column (Agilent). The column was eluted as follows: 0% MeOH in 15 mM NH4OAc buffer, pH 6.6, for 10 min, then a gradient to 25% MeOH in 29 min, then 25 to 75% MeOH in 5 min, then 75% MeOH for 5 min, then returning to 0% MeOH in 6 min, at a flow rate of 15 μL/min. The column was operated at 25 °C. The first 10 min of eluant was directed to waste, and the 10–40 min fractions were diverted to the ESI source. The MS parameters were set as follows: spray voltage, 4kV; sheath gas pressure, 40; capillary temperature, 250 °C; collision energy, 13V; scan width, 0.5 amu; scan time, 0.2 sec; Q1 peak width, 0.7 amu; Q3 peak width, 0.7 amu; Q2 gas pressure, 1.0 mTorr; source CID, 10V; tube lens offset, 85V. MS/MS data were acquired and processed with Xcaliber software version 1.4 (Thermo Electron).
Figure 6.
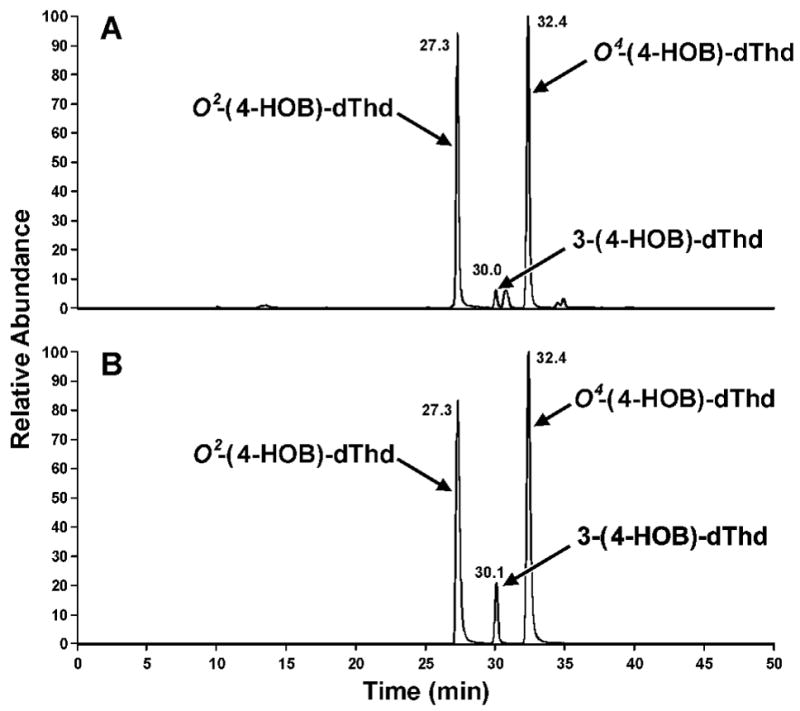
Chromatograms obtained upon analysis by capillary LC-ESI-MS/MS-SRM, m/z 315→ m/z 199, (System 5) of an enzymatic hydrolysate of DNA that had been allowed to react with α-acetoxyNPYR, then treated with NaBH3CN: A, products formed in the reaction with DNA; B, standards.
LC-ESI-MS of synthetic standards was performed on an Agilent 1100 LC/MSD trap instrument (Agilent Technologies, Inc., Wilmington, DE). Acquisition parameters were: skimmer 40.0 V; dry temp, 200 °C; HV capillary, 3500V; nebulizer, 15 psi; drying gas (N2), 5 L/min; scan range, m/z 100 → m/z 700.
1H-NMR spectra were obtained onVarian Inova 500 or 600 MHz instruments (Varian, Inc., Palo Alto, CA). Assignments were confirmed by COSY.
Chemicals and Enzymes
α-AcetoxyNPYR and dThd-5′-toluenesulfonate were prepared as described (38,39). Ethanol was procured from AAPER Alcohol and Chemical Co (Shelbyvill, KY). 2-Propanol was purchased from Acros Organics (Morris Plains, NJ). Puregene DNA purification solutions were obtained from Gentra Systems (Minneapolis, MN). Alkaline phosphatase (from calf intestine) was obtained from Roche Diagnostics Corporation (Indianapolis, IN). Calf thymus DNA, DNase I, phosphodiesterase I, porcine liver esterase, dGuo, dAdo, dCyd and dThd were purchased from Sigma-Aldrich Co. (St. Louis, MO). All other chemicals were obtained from Sigma-Aldrich or Fisher Scientific (Fairlawn, NJ).
Adduct Standards
N2-THF-dGuo (13) and N2-(4-hydroxybut-1-yl)dGuo [N2-(4-HOB)-dGuo, 15] were prepared as described (40). The remaining adducts fall into two groups. The first group comprises those that were characterized directly: N6-(tetrahydrofuran-2-yl)dAdo [N6-THF-dAdo, 16] and N4-(tetrahydrofuran-2-yl)dCyd [N4-THF-dCyd, 17] which were obtained from reactions of α-acetoxyNPYR with dAdo or dCyd, as described under “Reactions” and N6-(4-hydroxybut-1-yl)dAdo [N6-(4-HOB)-dAdo, 21] and N4-(4-(hydroxybut-1-yl)dCyd [N4-(4-HOB)-dCyd, 22] which were similarly obtained from these reactions after treatment with NaBH3CN. They were purified using HPLC system 2. The second group comprises those that were synthesized: O2-(4-hydroxybut-1-yl)dThd [O2-(4-HOB)-dThd, 23], O4-(4-hydroxybut-1-yl)dThd [O4-(4-HOB)dThd, 24], and 3-(4-hydroxybut-1-yl)dThd [3-(4-HOB-dThd, 25]. The syntheses are described below.
O2-(4-Hydroxybut-1-yl)dThd [O2-(4-HOB)-dThd, 23]
The synthesis was based on the method developed for preparation of O2-[4-(3-pyridyl)-4-oxobut-1-yl]dThd (39). dThd-5′-toluenesulfonate (26)(66.4 mg, 0.17 mmol) was allowed to react with 1,4-butanediol (27, 500 mg, 5.56 mmol)in the presence of 1,8-diazobicyclo[5.4.0]undec-7-ene (DBU, 332 mg, 2.18 mmol). The reaction mixture was stirred at room temperature overnight, followed by partial purification on a Sep-Pak® C18 cartridge (5 g, 20 cc, Waters). The cartridge was eluted by H2O (20 mL), 5% MeOH (20 mL), 10% MeOH (20 mL), and 50% MeOH (20 mL) sequentially. HPLC purification (system 3) of the 50% MeOH fraction gave 23 (169 μg, 0.54 μmol, 0.3%). 1H-NMR (DMSO-d6) δ 7.81 (s, 1H, H6), 6.08 (t, J=6.6 Hz, 1H, H1′), 5.28 (d, J=4.2 Hz, 1H, 3′-OH), 5.06 (t, J=4.2 Hz, 1H, 5′-OH), 4.46 (t, J=4.8Hz, 1H, D-OH), 4.29 (t, J=6.6Hz, 2H, CH2O), 4.23 (m, 1H, H3′), 3.79 (m, 1H, H4′), 3.60 (m, 1H, H5′a), 3.56 (m, 1H, H5′b), 3.43 (dd, J=6.6, 12 Hz, 2H, CH2OH), 2.15 (m, 2H, H2′), 1.78 (s, 3H, 5-CH3), 1.72 (m, 2H, CH2CH2O), 1.51 (m, 2H, CH2CH2OH); UV (CH3CN/H2O): λmax (nm) 230, 256; positive ESI-MS m/z 315 [M + H]+, MS/MS of m/z 315: m/z 199 [BH]+, m/z 127 [thymine + H]+.
O4-(4-Hydroxybut-1-yl)dThd [O4-(4-HOB)dThd, 24]
The synthesis was based on the method used for preparation of O4-isopropyl dThd (41). dThd (50 mg, 0.21 mmol) was mixed with Ag2O (95 mg, 0.41 mmol) in 2 mL of 1,4-butanediol (27). 4-Bromobutyl acetate (28) (80 mg, 0.41 mmol) was added and the mixture was stirred at 45 °C overnight, followed by heating at 60 °C for 5 days. The reaction mixture was filtered and loaded onto a Sep-Pak® C18 cartridge (5 g, 20 cc). The cartridge was eluted with H2O (20 mL), 5% MeOH (20 mL), 10% MeOH (20 mL), and 50% MeOH (20mL) sequentially. HPLC purification (system 4) of the 50% fraction gave O4-(4-acetoxybut-1-yl)dThd. UV (acetonitrile/H2O): λmax (nm) 280, 208; positive ESI-MS: m/z 357 [M + H]+, MS/MS of m/z 357: m/z 241 [BH]+. The collected O4-(4-acetoxybut-1-yl)dThd was dissolved in 5 mL of 10 mM phosphate buffer (pH 7.0), and 200 μL of porcine liver esterase was added. The reaction mixture was incubated at 37 °C overnight. HPLC purification (system 3) gave O4-(4-hydroxybut-1-yl)dThd (24) (1.76 mg, 5.62 μmol, 3%). 1H-NMR (DMSO-d6): δ 7.99 (s, 1H, H6), 6.12 (t, J=6.0 Hz, 1H, H1′), 5.25 (br, 1H, 3′-OH), 5.09 (br, 1H, 5′-OH), 4.48 (br, 1H, D-OH), 4.25 (t, J=6.6Hz, 2H, CH2O), 4.21 (m, 1H, H3′), 3.79 (m, 1H, H4′), 3.61 (dd, J=3.6, 12Hz, 1H, H5′a), 3.55 (dd, J=3.6, 12Hz, 1H, H5′b), 3.42 (m, 2H, CH2OH), 2.16 (m, 1H, H2′a), 1.99 (m, 1H, H2′b), 1.87 (s, 3H, 5-CH3), 1.70 (m, 2H, CH2CH2O), 1.50 (m, 2H, CH2CH2OH); UV (CH3CN/H2O): λmax (nm) 208, 282; positive ESI-MS m/z 315 [M + H]+, MS/MS of m/z 315: m/z 199 [BH]+, m/z 127 [thymine + H]+.
3-(4-Hydroxybut-1-yl)dThd [3-(4-HOB-dThd, 25]
The method was based on that used for preparation of 3- hydroxyethyldeoxyuridine (42). dThd (250 mg, 1.03 mmol) was mixed with K2CO3 (285 mg, 2.06 mmol) in a 100 mL round bottom flask containing 4 mL anhydrous DMSO. The mixture was stirred at room temperature for 30 min. 4-Bromobutyl acetate (28, 242 mg, 1.24 mmol) was added, and the mixture was stirred at room temperature for 3 days. Water (20 mL) was added, followed by neutralization with 0.1 M acetic acid, and concentration to dryness. The residue was dissolved in MeOH and purified on a silica gel column. 3-(4-Acetoxybut-1-yl)dThd (267 mg, 0.75 mmol, 72%) was purified by flash chromatography with elution by CHCl3/MeOH (10:1). 1H-NMR (DMSO-d6): δ 7.75 (s, 1H, H6), 6.20 (t, J=6.6 Hz, 1H, H1′), 5.23 (br, 1H, 3′-OH), 5.02 (br, 1H, 5′-OH), 4.23 (br s, 1H, H3′), 3.80 (m, 2H, NCH2), 3.76 (m, 1H, H4′), 3.58 (m, 1H, H5′a), 3.55 (m, 1H, H5′b), 3.98 (m, 2H, CH2O), 2.09 (m, 2H, H2′), 1.98 (s, 3H, Ac-CH3), 1.81 (s, 3H, 5-CH3), 1.54 (m, 4H, CH2CH2); UV (CH3CN/H2O): λmax (nm) 267, 209; positive ESI-MS m/z 357 (M + H)+, MS/MS of m/z 357: m/z 241 (BH)+, m/z 181 (BH-AcOH) +, m/z 127 (Thy + H)+.
3-(4-Acetoxybut-1-yl)dThd (52 mg, 0.146 mmol) was dissolved in concentrated NH4OH (2 mL), heated at 70 °C for 30 min, and the mixture was concentrated under reduced pressure to remove most NH3. The pH was adjusted to 7.0 with 20% acetic acid, and the mixture was evaporated to dryness. The residue was dissolved in MeOH and loaded onto a silica gel column. 3-(4-Hydroxybut-1-yl)dThd (25, 45.7 mg, 0.145 mmol, 99%) was eluted with CHCl3/MeOH (5:1). 1H-NMR (DMSO-d6): δ 7.75 (s, 1H, H6), 6.20 (t, J=6.6 Hz, 1H, H1′), 5.24 (br, 1H, 3′-OH), 5.04 (br, 1H, 5′-OH), 4.37 (br, 1H, D-OH), 4.23 (br s, 1H, H3′), 3.80 (m, 2H, NCH2), 3.77 (m, 1H, H4′), 3.58 (dd, J=4.2, 12Hz, 1H, H5′a), 3.55 (dd, J=4.2, 12Hz, 1H, H5′b), 3.37 (m, 2H, CH2O), 2.10 (m, 2H, H2′), 1.81 (s, 3H, 5-CH3), 1.51 (m, 2H, CH2CH2N), 1.38 (m, 2H, CH2CH2O); UV (CH3CN/H2O): λmax (nm) 267, 209; positive ESI-MS: m/z 315 [M + H]+, MS/MS of m/z 315: m/z 199 [BH]+, m/z 181[BH - H2O] +, m/z 127 [thymine + H]+.
Reactions
α-AcetoxyNPYR (3) (16 mg, 0.1 mmol) was allowed to react with the appropriate deoxyribonucleoside (0.025 mmol) in 2.5 mL of 0.1 M phosphate buffer (pH 7) at 37 °C for 24 h. The reaction mixture was extracted with an equal volume of CHCl3 and the aqueous phase was analyzed for adducts. Some of the above reaction mixtures (2.5 mL) were treated with 40 mg of NaBH3CN at 37 °C for 1 h and washed with an equal volume of CHCl3. The aqueous layer was removed, neutralized and analyzed for adducts.
α-AcetoxyNPYR (6 g, 38 mmol) was allowed to react with calf thymus DNA (5 g) in 300 mL of 0.1 M phosphate buffer (pH 7) at 37 °C for 20 h, as described previously (43). Treatment of the DNA with NaBH3CN, neutral thermal hydrolysis (NTH), and enzymatic hydrolysis were carried out as described (44).
Results
Our strategy for the identification of adducts with dAdo, dThd, and dCyd was based on our knowledge of the chemistry of N2-THF-dGuo (13, Scheme 1). This adduct, which has been characterized previously (40), can be detected by LC-ESI-MS-SIM at m/z 338 (M + H)+ and decomposes upon neutral thermal hydrolysis (NTH, 100 °C, 1 h, pH 7.0). Since N2-THF-dGuo (13) is in equilibrium with Schiff base 14, it is readily reduced by NaBH3CN to N2-(4-HOB)-dGuo (15) (Scheme 1). If similar adducts were formed with dAdo, dThd, and dCyd, they should be detectable by LC-ESI-MS-SIM at m/z 322, m/z 313, and m/z 298, respectively, after enzymatic hydrolysis, and they should be unstable to NTH. Furthermore, they should be reduced by NaBH3CN treatment.
As shown in Figure 1A, B, and D, peaks corresponding to N2-THF-dGuo (13), N6-THF-dAdo (16), and N4-THF-dCyd (17) were observed in LC-ESI-MS-SIM analyses of enzymatic hydrolysates of DNA that had been reacted with α-acetoxyNPYR. Figure 1E, F, and H demonstrate that these peaks disappeared upon NTH. Adducts 13, 16 and 17 were directly identified by the spectral data described below. Similarly, Figure 1C shows a peak corresponding to (M + H)+ of dThd adduct(s) (18, 19, and/or 20), which also disappeared upon NTH (Figure 1G). We could not obtain NMR data on this dThd adduct(s). Further structural information on all adducts was obtained by treating the DNA with NaBH3CN, followed by enzymatic hydrolysis. This produced the reduced adducts N6-(4-HOB)-dAdo (21), N4-(4-HOB)-dCyd (22), O2-(4-HOB)-dThd (23), O4-(4-HOB)-dThd (24), and 3-(4-HOB)-dThd (25), which were identified by their spectral properties and by comparison to synthetic standards. The details of each structural characterization and synthesis are presented below.
Figure 1.
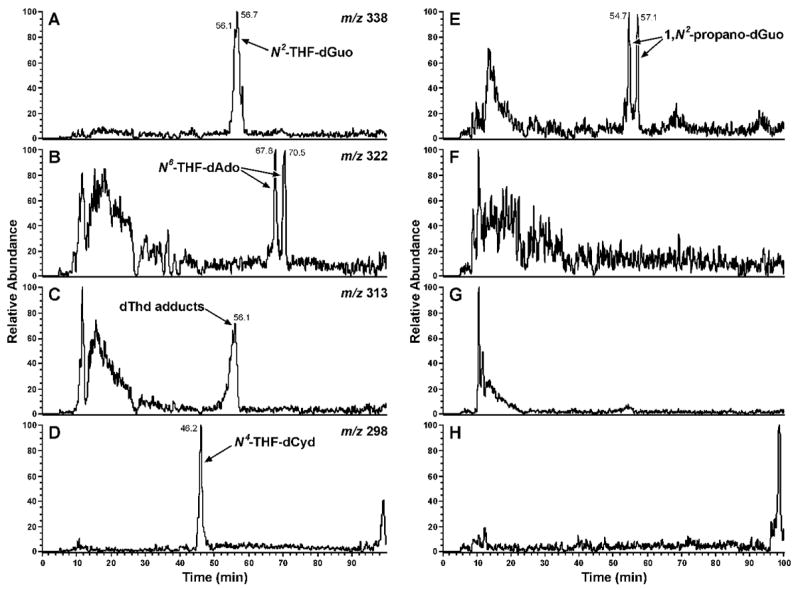
Chromatograms obtained upon LC-ESI-MS-SIM (System 5) analysis of enzymatic hydrolysates of DNA that had been allowed to react with α-acetoxyNPYR: Panels A-D, SIM at m/z 338 (N2-THF-dGuo), m/z 322 (N6-THF-dAdo), m/z 313 (THF-dThd adducts), and m/z 298 (N4-THF-dCyd); Panels E-H, the same analysis after the hydrolysates had been heated at 100 °C, pH 7.0, for 1h
N2-THF-dGuo (13) (Figure 1A) was identified by comparison of its LC-ESI-MS retention time, MS, MS/MS, and UV spectra to those of a standard. NTH of this DNA produced the chromatogram illustrated in Figure 1E. The two peaks at 54.7 and 57.1 min, which can also be seen eluting just before and just after adduct 13 in Figure 1A, are (6S-CH3,8S-OH)-9 and (6R-CH3,8R-OH)-9, respectively, (Scheme 1), which are the major products formed from the reaction with DNA of crotonaldehyde (8), a solvolysis product of α-acetoxyNPYR (27).
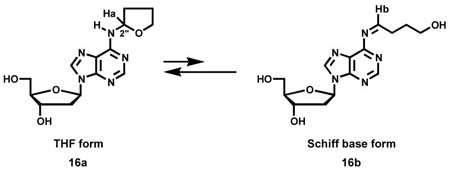
The two peaks eluting near 68 min in Figure 1B each had a base peak of m/z 322 (M + H)+ in their ESI-MS, and m/z 206 (BH)+ and m/z 136 (Ade + H)+ in their MS/MS. The same results were obtained when α-acetoxyNPYR was allowed to react with dAdo. These peaks disappeared upon NTH (Figure 1F). A chromatogram obtained upon HPLC-UV analysis of the α-acetoxyNPYR-dAdo reaction mixture is shown in Figure 2 and the UV spectra of peaks 1 and 2, which were shown to be identical to the LC-ESI-MS peaks, are presented in Figure 3A,B. The UV spectra are similar to that of N6-ethyladenosine (45). Peak 3 in Figure 2, which is also a dAdo adduct [(M + H)+ m/z 322, λmax 260], was not further characterized. Peaks 1 and 2 were interconvertible. When Peak 1 was collected, and re-injected on HPLC, a mixture of Peaks 1 and 2 was observed. The same results were obtained when Peak 2 was collected and reinjected. The 1H-NMR spectra of peaks 1 and 2 are summarized in Table 1, and are consistent with the assigned structures as diastereomers of N6-THF-dAdo (16). The 2″ proton of the tetrahydrofuryl ring appeared at 6.14 ppm as a broadened peak, due to averaging of the resonances of Ha and Hb in 16a and 16b at 25 °C during acquisition of the spectrum. When the 1H-NMR was acquired at 15 °C, sharper peaks appeared at 6.12 ppm and 6.68 ppm, assigned to Ha and Hb, respectively. At 60 °C, a single sharper peak was observed at 6.25 ppm, attributed to faster exchange between 16a and 16b.
Figure 2.
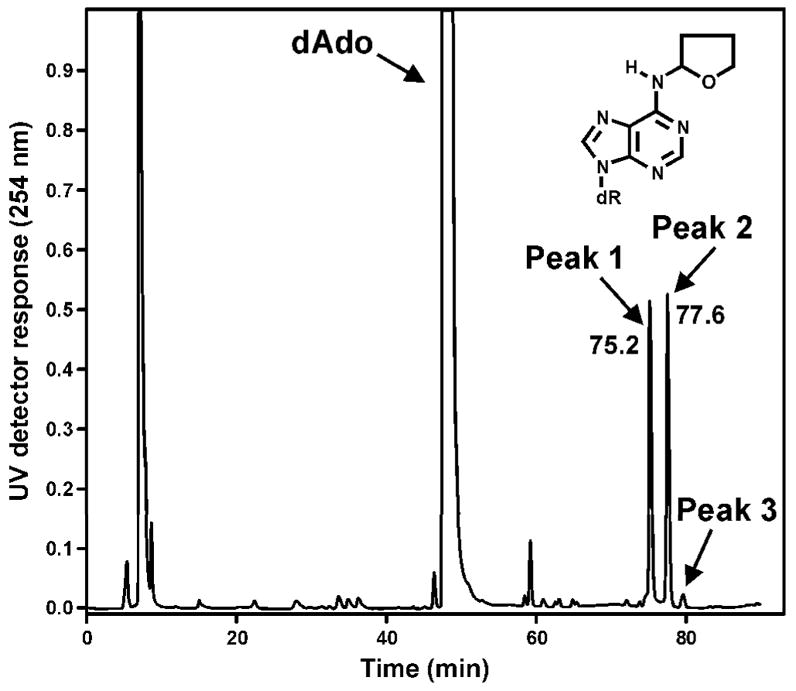
Chromatogram obtained upon HPLC analysis (System 1) of the reaction of α-acetoxyNPYR with dAdo.
Figure 3.
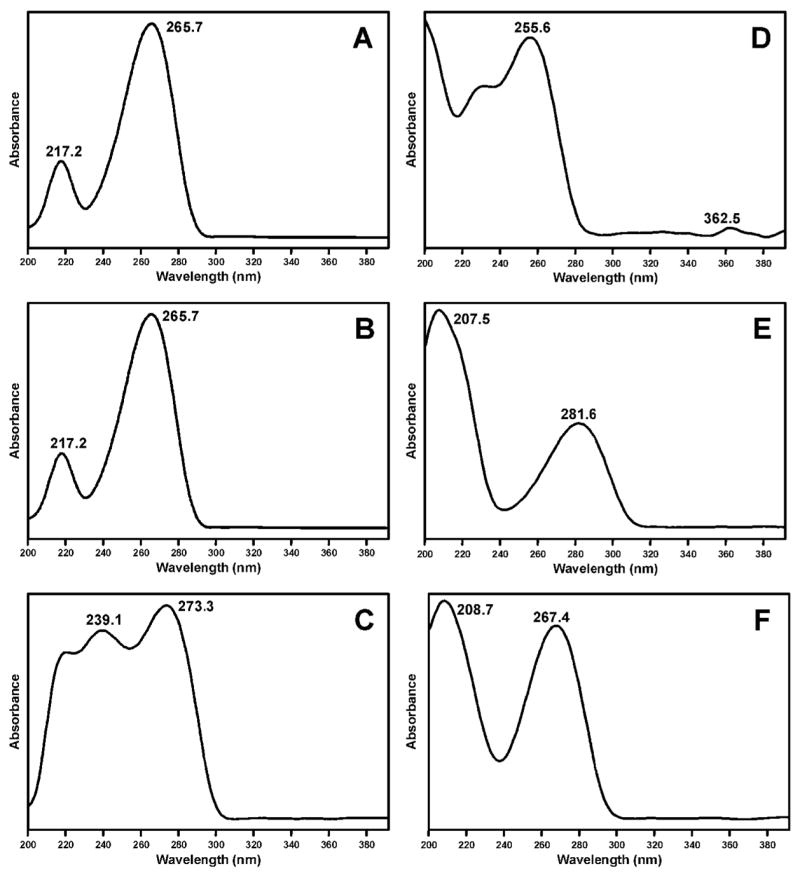
UV spectra of: A and B, diastereomers of N6-THF-dAdo (16); C, N4-THF-dCyd (17); D, O2-(4-HOB)-dThd (23); E, O4-(4-HOB)-dThd (24); F, 3-(4-HOB)-dThd (25).
Table 1.
1H-NMR spectra of adducts 16 and 17
 | ||||||||||||||
|---|---|---|---|---|---|---|---|---|---|---|---|---|---|---|
| Adduct | Base | 2′-Deoxyribose | THF | |||||||||||
| N6-H | H2 | H8 | H1′ | H2′ | H3′ | H4′ | H5′ | 3′-OH | 5′-OH | H2″ | H3″ | H4″ | H5″ | |
| 16, isomer 1 | 7.30 | 8.24 | 8.39 | 6.36 | 2.71
2.26 |
4.40 | 3.87 | 3.61
3.51 |
5.29 | 5.15 | 6.14 (br) | 2.04 | 2.10
1.80 |
3.78
3.80 |
| 16, isomer 2 | 7.28 | 8.24 | 8.39 | 6.36 | 2.71
2.26 |
4.40 | 3.87 | 3.61
3.51 |
5.29 | 5.15 | 6.14 (br) | 2.04 | 2.10
1.80 |
3.78
3.80 |
| N4-H | H5 | H6 | ||||||||||||
| 17 | 8.05 | 5.71 | 7.82 | 6.13 | 2.12
1.93 |
4.18 | 3.76 | 3.53 | 5.18 | 4.96 | 5.77 | 2.05
1.70 |
1.93
1.83 |
3.76
3.68 |
Further evidence for the structures of the dAdo adducts was obtained by treatment with NaBH3CN of the DNA or dAdo that had been reacted with α-acetoxyNPYR. This caused disappearance of the peaks shown in Figure 1B with appearance of a new peak with a base peak at m/z 324, (M + H)+ of N6-(4-HOB)-dAdo (21), and an MS/MS daughter ion of m/z 208 (BH)+. The UV spectrum was similar to that of N6-THF-dAdo (16). The 1H-NMR data summarized in Table 2 confirm the structural assignment as N6-(4-HOB)-dAdo (21).
Table 2.
1H-NMR spectra of adducts 21–25a
 | |||||||||||||||
|---|---|---|---|---|---|---|---|---|---|---|---|---|---|---|---|
| Adduct | Base | 2′-Deoxyribose | 4-Hydroxybutyl | ||||||||||||
| N6-H | H2 | H8 | H1′ | H2′ | H3′ | H4′ | H5′ | 3′-OH | 5′-OH | H1″ | H2″ | H3″ | H4″ | OH | |
| 21 | 7.83 | 8.18 | 8.31 | 6.33 | 2.71
2.24 |
4.39 | 3.87 | 3.60
3.51 |
5.29 | 5.23 | 3.45 | 1.60 | 1.45 | 3.39 | 4.37 |
| N4-H | H5 | H6 | |||||||||||||
| 22 | 7.63 | 5.70 | 7.69 | 6.14 | 2.06
1.91 |
4.17 | 3.74 | 3.52 | 5.15 | 4.92 | 3.22 | 1.49 | 1.43 | 3.38 | 4.40 |
| CH3 | H6 | ||||||||||||||
| 23 | 1.78 | 7.81 | 6.08 | 2.15 | 4.23 | 3.79 | 3.60
3.56 |
5.28 | 5.06 | 4.29 | 1.72 | 1.51 | 3.43 | 4.46 | |
| 24 | 1.87 | 7.99 | 6.12 | 2.16
1.99 |
4.21 | 3.79 | 3.61
3.55 |
5.25 | 5.09 | 4.25 | 1.70 | 1.50 | 3.42 | 4.48 | |
| 25 | 1.81 | 7.75 | 6.20 | 2.10 | 4.23 | 3.77 | 3.58
3.55 |
5.24 | 5.04 | 3.80 | 1.51 | 1.38 | 3.37 | 4.37 | |
in DMSO-d6
The peak eluting near 46 min in Figure 1D had a base peak of m/z 298 (M + H)+ in its ESI-MS, and m/z 182 (BH)+ and m/z 112 (Cyt + H)+ in its MS/MS. The same results were obtained when α-acetoxyNPYR was allowed to react with dCyd, and the peak disappeared upon NTH (Figure 1H). A chromatogram obtained upon HPLC-UV analysis of the α-acetoxyNPYR-dCyd reaction mixture is shown in Figure 4 and the UV spectrum of the main adduct peak is presented in Figure 3C. The UV spectrum has a maximum at 273.3 nm which matches that of N4-ethylcytidine (45). The 1H-NMR spectrum of the adduct is summarized in Table 1, and supports the structural assignment as N4-THF-dCyd (17).
Figure 4.
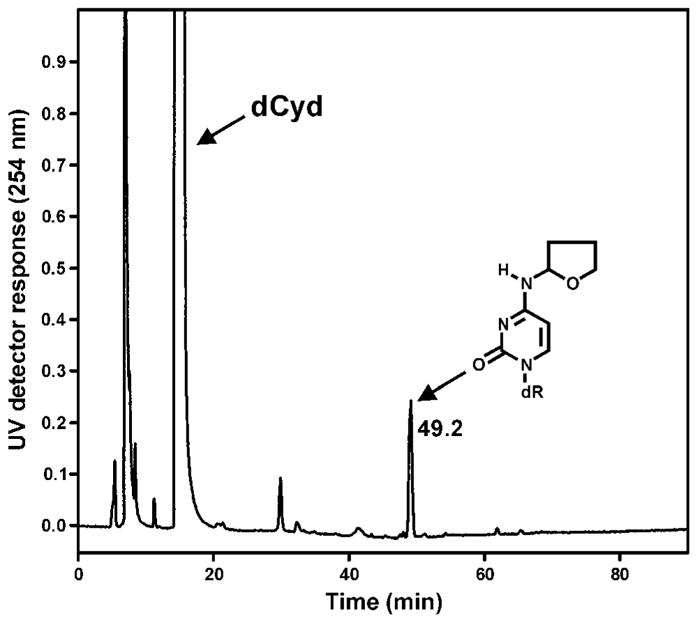
Chromatogram obtained upon HPLC analysis (System 1) of the reaction of α-acetoxyNPYR with dCyd.
NaBH3CN reduction of adduct 17, in DNA or from dCyd reacted with α-acetoxyNPYR, cleanly converted it to a new product with an MS base peak at m/z 300 (M + H)+. MS/MS of m/z 300 gave a base peak of m/z 184 (BH)+ and a peak at m/z 112 (Cyt + H)+. The UV spectrum, similar to that shown in Figure 3C, and 1H-NMR spectrum (Table 2) of the product established its structure as N4-(4-HOB)-dCyd (22).
As shown in Figure 1C, LC-ESI-MS-SIM analysis at m/z 313 produced a peak corresponding to a dThd adduct(s). As this material was unstable, co-eluted with N2-THF-dGuo and was produced in relatively low quantities, it was difficult to obtain spectral data. Larger amounts of this adduct(s) were obtained by HPLC collections from reactions of α-acetoxyNPYR with dThd. LC-ESI-MS of this material, which had the same retention time as that produced in the DNA reaction, gave peaks at m/z 313 (M + H)+, m/z 197 (BH)+, and m/z 127 (Thy + H)+, demonstrating the presence of a dThd adduct(s).
Further structural information was obtained from reactions in which NaBH3CN reduction was used. To facilitate this, O2-(4-HOB)-dThd (23), O4-(4-HOB)-dThd (24), and 3-(4-HOB)-dThd (25) were synthesized as summarized in Scheme 2. Adduct 23 was prepared by reaction of 1,4-butanediol (27) with tosylate 26, using known methodology for preparation of O2-substituted dThd derivatives (39). Adduct 24 was synthesized by reaction of dThd with 4-bromobutyl acetate (28), followed by esterase hydrolysis. Adduct 25 was obtained by reaction of dThd and 28 in the presence of K2CO3, followed by base hydrolysis. These reactions also follow literature precedent (41,42). The UV spectra of 23–25 are shown in Figure 3D-F; they are similar to those of O2-, O4-, and 3-ethylthymidine, respectively (45). Then, dThd was allowed to react with α-acetoxyNPYR, followed by NaBH3CN reduction, and the products were compared to 23–25. The resulting mixture was analyzed by LC-ESI-MS-SIM at m/z 315, (M + H)+ of adducts 23–25, and LC-ESI-MS/MS-SRM at m/z 315 → 199, producing the chromatograms illustrated in Figure 5. The indicated peaks had the same retention times as standard adducts 23–25, and each displayed peaks at m/z 315 in their MS, and m/z 199 (BH)+ and m/z 127 (Thy + H)+ in their MS/MS, as seen in standards. In addition, the MS/MS of isolated and standard adduct 25 had a peak at m/z 181, which was not observed in the oxygen substituted adducts 23 and 24. UV spectra matched those of the standards. DNA was allowed to react with α-acetoxyNPYR, and then treated with NaBH3CN. Analysis by LC-ESI-MS/MS-SRM (m/z 315 → m/z 199) of an enzyme hydrolysate of this DNA produced the chromatogram illustrated in Figure 6, demonstrating that adducts 23–25 were present in this DNA and that their retention times matched those of the standards.
Scheme 2.
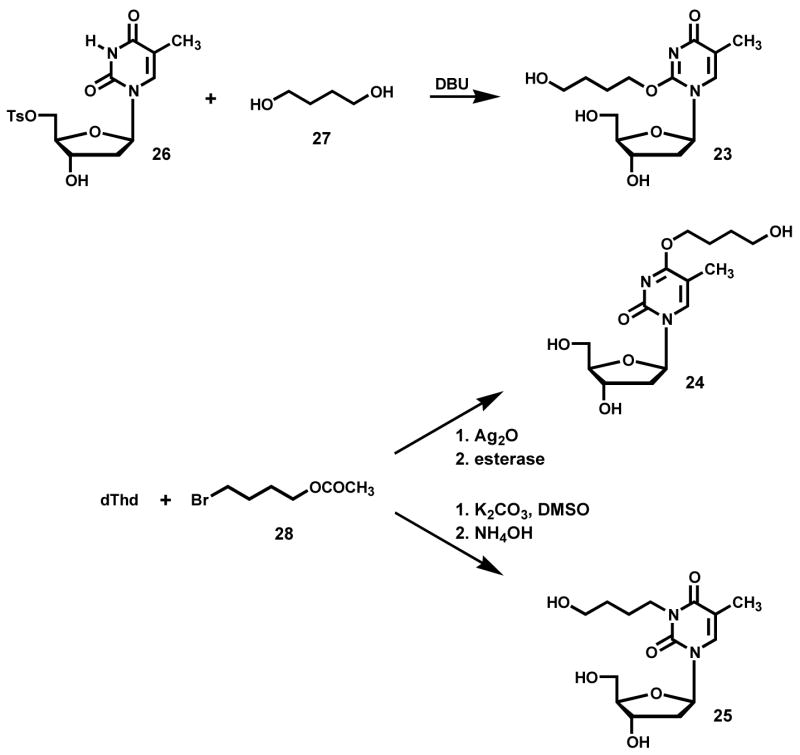
Synthesis of dThd Adducts 23–25
Figure 5.
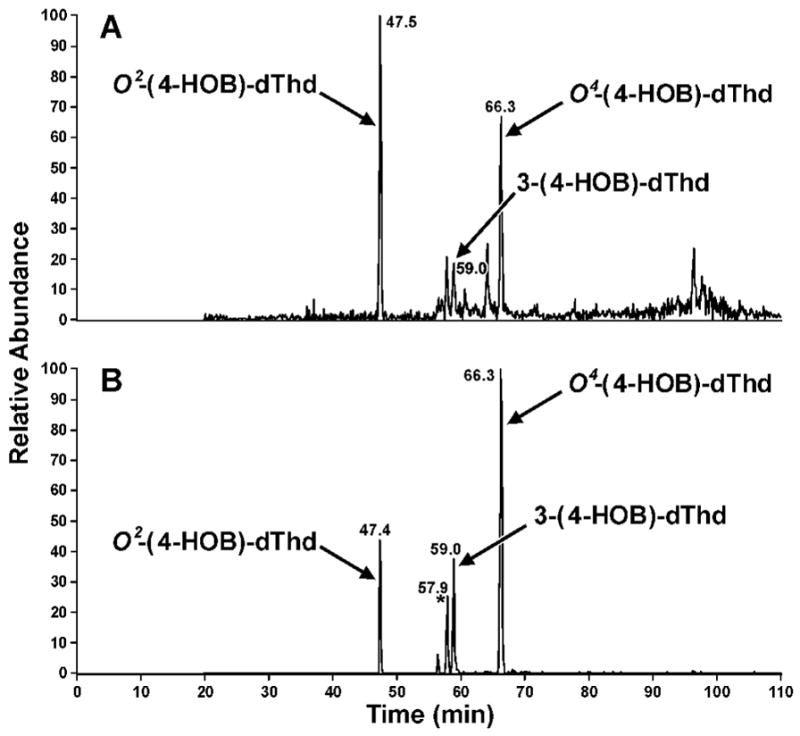
Chromatograms obtained upon analysis (System 5) of the reaction of α-acetoxyNPYR with dThd, after treatment with NaBH3CN: A, LC-ESI-MS-SIM, m/z 315; B, LC-ESI-MS/MS-SRM, m/z 315→ m/z 199.
Further analysis of the dThd adducts indicated that there were 2 isomers of adduct 25, with the same MS characteristics, including the m/z 181 peak in the MS/MS, and identical UV spectra. Only one isomer matched the retention time of synthetic 25. The second isomer eluted slightly earlier than 25, indicated by the asterisk in Figure 5. While the structure of the second isomer was not pursued, since the amount of the 3-substituted dThd adducts was far less than those of the O2- and O4-substituted adducts, the data suggest that the second isomer may be branched, e.g. 30, which could result from NaBH3CN reduction of 29, a possible product of the reaction of dThd with crotonaldehyde (8).
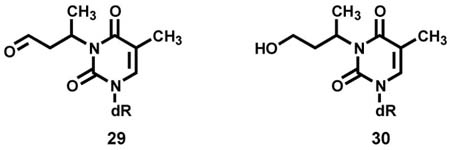
While these data definitively demonstrated the presence of dThd adducts 23–25 in hydrolysates of α-acetoxyNPYR-treated DNA that had been reduced by NaBH3CN, they did not establish conclusively the structures of their unreduced precursors 18–20, in which R could be either THF-2-yl or 4-oxobutyl-, both of which could be reduced to 23–25.
Discussion
The results of this study provide the first evidence for DNA adducts of the cyclic nitrosamine NPYR with nucleobases other than dGuo. The dAdo and dCyd adducts 16 and 17 were fully characterized based on their spectral properties and by conversion to their reduced analogues 21 and 22. The dThd adducts 18–20 were unstable in our hands but their stable reduced forms 23–25 were definitively identified by comparison to synthetic standards. These results are potentially important for understanding mechanisms of NPYR carcinogenesis, particularly in view of the study by Kanki et al which indicates that NPYR causes mutations at A:T base pairs in DNA of rat liver, its target tissue (6). In the accompanying paper, we demonstrate the presence of the dThd and dAdo adducts, as well as dGuo adduct 13, in the liver DNA of NPYR-treated rats (46).
The metabolic activation of NPYR, a representative cyclic nitrosamine, leads to intermediate 4, which has two electrophilic centers – an aldehyde and a diazohydroxide - in the same molecule. This is in contrast to acyclic nitrosamines such as N-nitrosodiethylamine which produce separate aldehyde and diazohydroxide products upon α-hydroxylation. The presence of two electrophilic centers in a molecule such as 4 results in a more complex pattern of DNA adduct formation than observed with acyclic nitrosamines, and is reminiscent of the bident carcinogens described by Loeppky, although in that case adduct formation results from two separate electrophiles generated from the same molecule (47). Thirteen dGuo adducts of α-acetoxyNPYR have been previously identified, and some of these result, directly or indirectly, from reactions at both electrophilic centers (31). The cyclic oxonium ion 12, or its derivatives, play a significant role in adduct formation from α-hydroxyNPYR, leading to tetrahydrofuranyl adducts of dGuo, dAdo and dCyd. Tetrahydrofuranyl adducts are likely also formed in the dThd reactions, but we could not confirm this due to the instability of the products at the deoxyribonucleoside level. Some of the adducts of NPYR previously reported result from reactions with dGuo of crotonaldehyde and related aldehydes generated from α-hydroxyNPYR (31,48).
THF-dGuo adduct 13, THF-dAdo adduct 16, and THF dCyd adduct 17 have recently been identified by Hermida et al in reactions of “oxidized THF” with deoxyribonucleosides (49). Oxidized THF contains hydroperoxides and 2-hydroxyTHF (11). They observed, as we have, that these adducts are somewhat unstable and characterized them after reduction with NaBH4, yielding adducts 15, 21, and 22. The spectral properties of these adducts reported by Hermida et al were identical to those reported here for 21 and 22, and reported previously by us for 15 (50). Evidence for the formation of these adducts in DNA reacted with oxidized THF was also presented. These results are consistent with ours. We previously showed that 2-hydroxyTHF (11) reacts with dGuo to produce THF-dGuo adduct 13, although we did not observe this in the reaction of 11 with DNA (50,51). Their data indicate that, in addition to the reaction of oxonium ion 12 with DNA, as indicated in Scheme 1, 2-hydroxyTHF (11) can also react with DNA producing adducts 13, 16, and 17. THF produces liver tumors in female mice upon exposure by inhalation (1800 ppm/6h per day/5 days per week for 2 years) (52). Although NPYR has not been tested by inhalation, it is most likely a far stronger carcinogen than THF. Nevertheless, these two compounds may have common carcinogenic pathways through formation of the DNA adducts discussed here.
In summary, we have identified new DNA adducts formed in the α-hydroxylation of the hepatocarcinogen NPYR. These are the first examples of NPYR adducts produced with nucleobases other than dGuo, and provide new leads for a better understanding of mechanisms of carcinogenesis by this prototypic cyclic nitrosamine.
Acknowledgments
This study was supported by grant CA-85702 from the National Cancer Institute. S.S.H. is an American Cancer Society Research Professor, supported by grant RP-00-138. Mass spectrometry was carried out in the Analytical Biochemistry core facility of The Cancer Center, supported in part by Cancer Center Support Grant CA-77598. We thank Professor Kylie Walters for advice on the NMR spectrum of 16.
Abbreviations
- NPYR
N-nitrosopyrrolidine
- N6-(4-HOB)-dAdo
N6-(4-hydroxybut-1-yl)dAdo
- N4-(4-HOB)-dCyd
N4-(4-(hydroxybut-1-yl)dCyd
- N2-(4-HOB)-dGuo
N2-(4-hydroxybut-1-yl)dGuo
- O2-(4-HOB)-dThd
O2-(4-hydroxybut-1-yl)dThd
- 3-(4-HOB)-dThd
3-(4-hydroxybut-1-yl)dThd
- O4-(4-HOB)-dThd
O4-(4-hydroxybut-1-yl)dThd
- N6-THF-dAdo
N6-(tetrahydrofuran-2-yl)dAdo
- N4-THF-dCyd
N4-(tetrahydrofuran-2-yl)dCyd
- N2-THF-dGuo
N2-(tetrahydrofuran-2-yl)dGuo
- NTH
neutral thermal hydrolysis
References
- 1.Preussmann R, Stewart BW. N-Nitroso Carcinogens. In: Searle CE, editor. Chemical Carcinogens, Second Edition, ACS Monograph 182. Vol. 2. American Chemical Society; Washington, DC: 1984. pp. 643–828. [Google Scholar]
- 2.Druckrey H, Preussmann R, Ivankovic S, Schmähl D. Organotrope Carcinogen Wirkungen bei 65 verschiedenen N-Nitrosoverbindungen an BD-ratten. Z Krebsforschung und Klin Onkol. 1967;69:103–201. [PubMed] [Google Scholar]
- 3.Lijinsky W. Chemistry and Biology of N-Nitroso Compounds. Cambridge University Press; Cambridge, England: 1992. [Google Scholar]
- 4.Gray R, Peto R, Branton P, Grasso P. Chronic nitrosamine ingestion in 1040 rodents: the effect of the choice of nitrosamine, the species studied, and the age of starting exposure. Cancer Res. 1991;51:6470–6491. [PubMed] [Google Scholar]
- 5.Gold LS, Slone TH, Ames BN. Summary of the carcinogenic potency database by chemical. In: Gold LS, Zeiger E, editors. Handbook of Carcinogenic Potency and Genotoxicity Databases. CRC Press; Boca Raton, FL: 1997. pp. 621–660. [Google Scholar]
- 6.Kanki K, Nishikawa A, Masumura K, Umemura T, Imazawa T, Kitamura Y, Nohmi T, Hirose M. In vivo mutational analysis of liver DNA in gpt delta transgenic rats treated with the hepatocarcinogens N-nitrosopyrrolidine, 2-amino-3-methylimidazo[4,5-f]quinoline, and di(2-ethylhexyl)phthalate. Mol Carcinog. 2005;42:9–17. doi: 10.1002/mc.20061. [DOI] [PubMed] [Google Scholar]
- 7.Lijinsky W, Taylor HW. The effect of substituents on the carcinogenicity of N-nitrosopyrrolidine in Sprague-Dawley rats. Cancer Res. 1976;36:1988–1990. [PubMed] [Google Scholar]
- 8.Ohgaki H, Hasegawa H, Kato T, Suenaga M, Ubukata M, Sato S, Takayama S, Sugimura T. Carcinogenicity in mice and rats of heterocyclic amines in cooked foods. Environ Health Perspect. 1986;67:129–134. doi: 10.1289/ehp.8667129. [DOI] [PMC free article] [PubMed] [Google Scholar]
- 9.International Agency for Research on Cancer. IARC Monographs on the Evaluation of Carcinogenic Risks to Humans. Vol. 83. IARC; Lyon, FR: 2004. Tobacco Smoke and Involuntary Smoking; pp. 53–119. [PMC free article] [PubMed] [Google Scholar]
- 10.Hotchkiss JH. Preformed N-nitroso compounds in foods and beverages. Cancer Surv. 1989;8:295–321. [PubMed] [Google Scholar]
- 11.Charrois JW, Arend MW, Froese KL, Hrudey SE. Detecting N-nitrosamines in drinking water at nanogram per liter levels using ammonia positive chemical ionization. Environ Sci Technol. 2004;38:4835–4841. doi: 10.1021/es049846j. [DOI] [PubMed] [Google Scholar]
- 12.Spiegelhalder B, Eisenbrand G, Preussmann Volatile nitrosamines in food. Oncology. 1980;37:211–216. doi: 10.1159/000225438. [DOI] [PubMed] [Google Scholar]
- 13.Tricker AR, Pfundstein B, Theobald E, Preussmann R, Spiegelhalder B. Mean daily intake of volatile N-nitrosamines from foods and beverages in West Germany in 1989–1990. Food Chem Toxicol. 1991;29:729–732. doi: 10.1016/0278-6915(91)90180-f. [DOI] [PubMed] [Google Scholar]
- 14.Tricker AR, Pfundstein B, Kalble T, Preussmann R. Secondary amine precursors to nitrosamines in human saliva, gastric juice, blood, urine, and faeces. Carcinogenesis. 1992;13:563–568. doi: 10.1093/carcin/13.4.563. [DOI] [PubMed] [Google Scholar]
- 15.Mirvish SS. Role of N-nitroso compounds (NOC) and N-nitrosation in etiology of gastric, esophageal, nasopharyngeal and bladder cancer and contribution to cancer of known exposures to NOC. Cancer Lett. 1995;93:17–48. doi: 10.1016/0304-3835(95)03786-V. [DOI] [PubMed] [Google Scholar]
- 16.Bartsch H, Ohshima H, Pignatelli B, Calmels S. Human exposure to endogenous N-nitroso compounds: quantitative estimates in subjects at high risk for cancer of the oral cavity, oesophagus, stomach and urinary bladder. Cancer Surv. 1989;8:335–362. [PubMed] [Google Scholar]
- 17.van Maanen JMS, Welle IJ, Hageman G, Dallinga JW, Mertens PLJM, Kleinjans JCS. Nitrate contamination of drinking water: relationship with HPRT variant frequency in lymphocyte DNA and urinary excretion of N-nitrosamines. Environ Health Perspect. 1998;104:522–528. doi: 10.1289/ehp.96104522. [DOI] [PMC free article] [PubMed] [Google Scholar]
- 18.Vermeer ITM, Pachen DMFA, Dallinga JW, Kleinjans JCS, van Maanen JMS. Volatile N-nitrosamine formation after intake of nitrate at the ADI level in combination with an amine-rich diet. Environ Health Perspect. 1998;106:459–463. doi: 10.1289/ehp.106-1533225. [DOI] [PMC free article] [PubMed] [Google Scholar]
- 19.Tricker AR, Mostafa MH, Spiegelhalder B, Preussmann R. Urinary excretion of nitrate, nitrite and N-nitroso compounds in Schistosomiasis and bilharzia bladder cancer patients. Carcinogenesis. 1989;10:547–552. doi: 10.1093/carcin/10.3.547. [DOI] [PubMed] [Google Scholar]
- 20.Mostafa MH, Helmi S, Badawi AF, Tricker AR, Spiegelhalder B, Preussmann R. Nitrate, nitrite and volatile N-nitroso compounds in the urine of Schistosoma haematobium and Schistosoma mansoni infected patients. Carcinogenesis. 1994;15:619–625. doi: 10.1093/carcin/15.4.619. [DOI] [PubMed] [Google Scholar]
- 21.Tricker AR, Stickler DJ, Chawla JC, Preussmann R. Increased urinary nitrosamine excretion in paraplegic patients. Carcinogenesis. 1991;12:943–946. doi: 10.1093/carcin/12.5.943. [DOI] [PubMed] [Google Scholar]
- 22.Gomez RF, Johnston M, Sinskey AJ. Activation of nitrosomorpholine and nitrosopyrrolidine to bacterial mutagens. Mutation Res. 1974;24:5–7. doi: 10.1016/0027-5107(74)90040-2. [DOI] [PubMed] [Google Scholar]
- 23.Baldwin JE, Branz SE. Chemical activation of nitrosamines into mutagenic agents. Tetrahedron Lett. 1976;5:333–336. [Google Scholar]
- 24.Hecht SS, Chen CB, Hoffmann D. Evidence for metabolic α-hydroxylation of N-nitrosopyrrolidine. Cancer Res. 1978;38:215–218. [PubMed] [Google Scholar]
- 25.Chung FL, Hecht SS. Formation of cyclic 1, N2-adducts by reaction of deoxyguanosine with α-acetoxy-N-nitrosopyrrolidine, 4-(carbethoxynitrosamino)butanal, or crotonaldehyde. Cancer Res. 1983;43:1230–1235. [PubMed] [Google Scholar]
- 26.Hecht SS, McCoy GD, Chen CB, Hoffmann D. The metabolism of cyclic nitrosamines. In: Scanlan RA, Tannenbaum SR, editors. N-Nitroso Compounds. American Chemical Society; Washington, DC: 1981. pp. 49–75. [Google Scholar]
- 27.Wang M, Chung FL, Hecht SS. Identification of crotonaldehyde as a hepatic microsomal metabolite formed by α-hydroxylation of the carcinogen N-nitrosopyrrolidine. Chem Res Toxicol. 1988;1:28–31. doi: 10.1021/tx00001a005. [DOI] [PubMed] [Google Scholar]
- 28.Flammang AM, Gelboin HV, Aoyama T, Gonzalez FJ, McCoy GD. N-Nitrosopyrrolidine metabolism by cDNA-expressed human cytochrome P-450s. Biochem Arch. 1993;9:197–204. [Google Scholar]
- 29.Wong HL, Murphy SE, Hecht SS. Cytochrome P450 2A-catalyzed metabolic activation of structurally similar carcinogenic nitrosamines: N′-nitrosonornicotine enantiomers, N-nitrosopiperidine, and N-nitrosopyrrolidine. Chem Res Toxicol. 2004;18:61–69. doi: 10.1021/tx0497696. [DOI] [PubMed] [Google Scholar]
- 30.Hecker LI, Farrelly JG, Smith JH, Saavedra JE, Lyon PA. Metabolism of the liver carcinogen N-nitrosopyrrolidine by rat liver microsomes. Cancer Res. 1979;39:2679–2686. [PubMed] [Google Scholar]
- 31.Wang M, McIntee EJ, Shi Y, Cheng G, Upadhyaya P, Villalta PW, Hecht SS. Reactions of α-acetoxy-N-nitrosopyrrolidine with deoxyguanosine and DNA. Chem Res Toxicol. 2001;14:1435–1445. doi: 10.1021/tx010097i. [DOI] [PubMed] [Google Scholar]
- 32.Chung FL, Wang M, Hecht SS. Detection of exocyclic guanine adducts in hydrolysates of hepatic DNA of rats treated with N-nitrosopyrrolidine and in calf thymus DNA reacted with α-acetoxy-N-nitrosopyrrolidine. Cancer Res. 1989;49:2034–2041. [PubMed] [Google Scholar]
- 33.Chung FL, Young R, Hecht SS. Detection of cyclic 1, N2-propanodeoxyguanosine adducts in DNA of rats treated with N-nitrosopyrrolidine and mice treated with crotonaldehyde. Carcinogenesis. 1989;10:1291–1297. doi: 10.1093/carcin/10.7.1291. [DOI] [PubMed] [Google Scholar]
- 34.Wang M, Chung FL, Hecht SS. Formation of 7-(4-oxobutyl)guanine in hepatic DNA of rats treated with N-nitrosopyrrolidine. Carcinogenesis. 1992;13:1909–1911. doi: 10.1093/carcin/13.10.1909. [DOI] [PubMed] [Google Scholar]
- 35.Wang M, Hecht SS. A cyclic N7, C-8 guanine adduct of N-nitrosopyrrolidine (NPYR): formation in nucleic acids and excretion in the urine of NPYR-treated rats. Chem Res Toxicol. 1997;10:772–778. doi: 10.1021/tx960193x. [DOI] [PubMed] [Google Scholar]
- 36.Wang M, Shi Y, Cheng G, Lao Y, Villalta PW, Hecht SS. Deoxyadenosine and deoxycytidine adducts of α-acetoxy-N-nitrosopyrrolidine (α-acetoxyNPYR) Proc Amer Assoc Cancer Res. 2005;46:494. [Google Scholar]
- 37.Wang M, Lao Y, Shi Y, Cheng G, Nishikawa A, Villalta PW, Hecht SS. Identification of O-(tetrahydrofuran-2-yl)thymidine adducts in hepatic DNA of rats treated with N-Nitrosopyrrolidine (NPYR) Proc Amer Assoc Cancer Res. 2006;47:1228. [Google Scholar]
- 38.Wang M, Chung FL, Hecht SS. Formation of acyclic and cyclic guanine adducts in DNA reacted with α-acetoxy-N-nitrosopyrrolidine. Chem Res Toxicol. 1989;2:423–428. doi: 10.1021/tx00012a011. [DOI] [PubMed] [Google Scholar]
- 39.Sturla SJ, Scott J, Lao Y, Hecht SS, Villalta PW. Mass spectrometric analysis of relative levels of pyridyloxobutylation adducts formed in the reaction of DNA with a chemically activated form of the tobacco-specific carcinogen 4-(methylnitrosamino)-1-(3-pyridyl)-1-butanone. Chem Res Toxicol. 2005;18:1048–1055. doi: 10.1021/tx050028u. [DOI] [PubMed] [Google Scholar]
- 40.Young-Sciame R, Wang M, Chung FL, Hecht SS. Reactions of α-acetoxy-N-nitrosopyrrolidine and α-acetoxy-N-nitrosopiperidine with deoxyguanosine: formation of N2-tetrahydrofuranyl or N2-tetrahydropyranyl adducts. Chem Res Toxicol. 1995;8:607–616. doi: 10.1021/tx00046a016. [DOI] [PubMed] [Google Scholar]
- 41.Borowy-Borowski H, Chambers RW. Solid-phase synthesis and side reactions of oligonucleotides containing O-alkylthymine residues. Biochemistry. 1989;28:1471–1477. doi: 10.1021/bi00430a007. [DOI] [PubMed] [Google Scholar]
- 42.Bhanot OS, Singh US, Solomon JJ. The role of 3-hydroxyethyldeoxyuridine in mutagenesis by ethylene oxide. J Biol Chem. 1994;269:30056–30064. [PubMed] [Google Scholar]
- 43.Wang M, Upadhyaya P, Dinh TT, Bonilla LE, Hecht SS. Lactols in hydrolysates of DNA reacted with α-acetoxy-N-nitrosopyrrolidine and crotonaldehyde. Chem Res Toxicol. 1998;11:1567–1573. doi: 10.1021/tx980165+. [DOI] [PubMed] [Google Scholar]
- 44.Wang M, McIntee EJ, Cheng G, Shi Y, Villalta PW, Hecht SS. Identification of DNA adducts of acetaldehyde. Chem Res Toxicol. 2000;13:1149–1157. doi: 10.1021/tx000118t. [DOI] [PubMed] [Google Scholar]
- 45.Singer B, Grunberger D. Molecular biology of mutagens and carcinogens. Plenum Press; New York: 1983. [Google Scholar]
- 46.Wang M, Lao Y, Cheng G, Shi Y, Villalta PW, Nishikawa A, Hecht SS. Analysis of adducts in hepatic DNA of rats treated with N-nitrosopyrrolidine. Chem Res Toxicol. 2006 doi: 10.1021/tx600333e. submitted. [DOI] [PMC free article] [PubMed] [Google Scholar]
- 47.Loeppky RN, Goelzer P. Microsome-mediated oxidation of N-nitrosodiethanolamine (NDELA), a bident carcinogen. Chem Res Toxicol. 2002;15:457–469. doi: 10.1021/tx000267b. [DOI] [PubMed] [Google Scholar]
- 48.Wang M, McIntee EJ, Cheng G, Shi Y, Villalta PW, Hecht SS. Reactions of 2,6-dimethyl-1,3-dioxane-4-ol (aldoxane) with deoxyguanosine and DNA. Chem Res Toxicol. 2001;14:1025–1032. doi: 10.1021/tx0100385. [DOI] [PubMed] [Google Scholar]
- 49.Hermida SA, Possari EP, Souza DB, de ACI, Gomes OF, Di Mascio P, Medeiros MH, Loureiro AP. 2′-deoxyguanosine, 2′-deoxycytidine, and 2′-deoxyadenosine adducts resulting from the reaction of tetrahydrofuran with DNA bases. Chem Res Toxicol. 2006;19:927–936. doi: 10.1021/tx060033d. [DOI] [PubMed] [Google Scholar]
- 50.Wang M, Young-Sciame R, Chung FL, Hecht SS. Formation of N2-tetrahydrofuranyl and N2-tetrahydropyranyl adducts in the reactions of α-acetoxy-N-nitrosopyrrolidine and α-acetoxy-N-nitrosopiperidine with DNA. Chem Res Toxicol. 1995;8:617–624. doi: 10.1021/tx00046a017. [DOI] [PubMed] [Google Scholar]
- 51.Young-Sciame R, Wang M, Chung FL, Hecht SS. Reactions of α-acetoxy-N-nitrosopyrrolidine and α-acetoxy-N-nitrosopiperidine with deoxyguanosine: formation of N2-tetrahydrofuranyl or N2-tetrahydropyranyl adducts. Chem Res Toxicol. 1995;8:607–616. doi: 10.1021/tx00046a016. [DOI] [PubMed] [Google Scholar]
- 52.Chhabra RS, Herbert RA, Roycroft JH, Chou B, Miller RA, Renne RA. Carcinogenesis studies of tetrahydrofuran vapors in rats and mice. Toxicol Sci. 1998;41:183–188. doi: 10.1006/toxs.1997.2399. [DOI] [PubMed] [Google Scholar]


