Abstract
Non-covalent duplex DNA/drug complexes formed between one of three 14-base pair non-self complementary duplexes with variable GC content and one of eight different DNA-interactive drugs are characterized by infrared multiphoton dissociation (IRMPD), and the resulting spectra are compared to conventional collisional activated dissociation (CAD) mass spectra in a quadrupole ion trap mass spectrometer. IRMPD yielded comparable information to previously reported CAD results in which strand separation pathways dominate for complexes containing the more AT-rich sequences and/or minor groove binding drugs, whereas drug ejection pathways are prominent for complexes containing intercalating drugs and/or duplexes with higher GC base content. The large photoabsorptive cross-section of the phosphate backbone at 10.6 μm promotes highly efficient dissociation within short irradiation times (< 2 ms at 50 W) or using lower laser powers and longer irradiation times (< 15 W at 15 ms), activation times on par with or shorter than standard CAD experiments. This large photoabsorptivity leads to a controllable ion activation method which can be used to produce qualitatively similar spectra to CAD while minimizing uninformative base loss dissociation pathways or instead be tuned to yield a high degree of secondary fragmentation. Additionally, the low mass cut-off associated with conventional CAD plays no role in IRMPD, resulting in richer MS/MS information in the low m/z region. IRMPD is also used for multi-adduct dissociation in order to increase MS/MS sensitivity, and a two stage IRMPD/IRMPD method is demonstrated as a means to give specific DNA sequence information that would be useful when screening drug binding by mixtures of duplexes.
Introduction
Electrospray ionization mass spectrometry (ESI-MS) has proven to be an exceptionally powerful tool for the analysis of biomolecules.1 Moreover, it is well suited for preserving non-covalent interactions that are important in the formation of biological macromolecules in solution, thus allowing their analysis in the gas phase.2–4 The ability of ESI-MS to probe DNA and RNA non-covalent interactions believed to be functionally important has encouraged the study of DNA duplexes,5–10 triplexes,11 and quadruplexes.11, 12 In addition, ESI-MS has been used to investigate binding stoichiometry, metal mediated binding, and relative binding affinities representative of solution phase properties for various DNA/drug13–25 and RNA/drug complexes.26–29
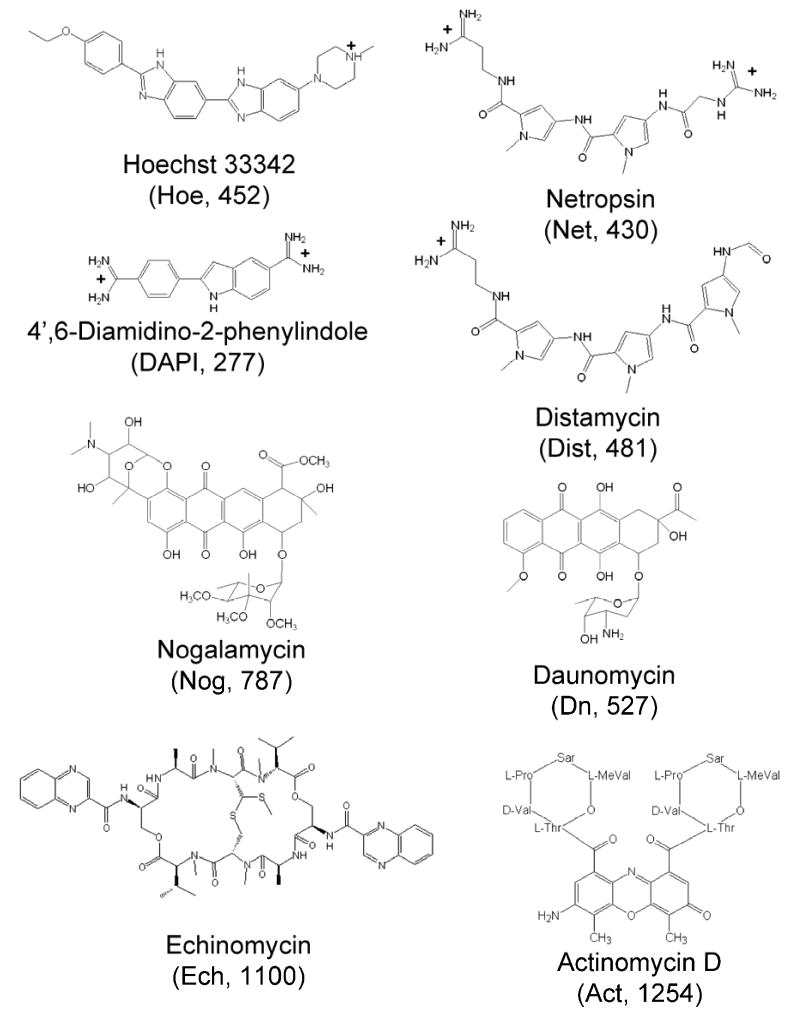
Dissociation patterns for many biomolecules, such as proteins30–32 and oligonucleotides,33, 34 have shown large variations dependent upon their charge states. This concept was recently explored in more detail for duplex DNA and drug/DNA complexes by collisionally activated dissociation (CAD) in an ion trap mass analyzer by our group.10 Upon collisional activation, the DNA duplex/drug complexes undergo several informative dissociation trends based upon the initial charge state, the duplex sequence, and the number of drugs bound. The drug binding modes (minor groove binding versus intercalation) also seemed to affect the characteristic dissociation pathways, although in a more recent study reported by Rosu et al., a systematic evaluation of both high energy CAD patterns and breakdown curves of DNA-drug complexes revealed that the gas-phase basicity of the drug (and consequently its charge) had a more significant impact on the observed dissociation channels than did the actual drug binding mode.16 In the current study, the dissociation patterns of the same types of duplex/drug complexes, containing non-self complementary oligonucleotides and one of eight drugs, were explored by infrared multiphoton dissociation (IRMPD). The series of drugs including their structures and molecular weights used in this study are shown in Figure 1. The commercially available drugs included four categorized as minor groove binders: netropsin, Hoechst 33342, 4′,6-diamidino-2-phenylinodole, and distamycin, three known primarily as mono-intercalators: daunomycin, actinomcyin and nogalamycin, and finally echinomycin as a mixed mode bis-intercalator containing two chromophores connected by a cyclic peptide.
Figure 1.
DNA active drug structures used for this study. Compound abbreviations and molecular weights (Da) are given in parenthesis. Minor groove binders Hoe, Net, DAPI, and Dist are represented in their neutral solution phase charge states.
IRMPD has shown considerable promise as an alternative approach to traditional CAD in QIT instruments.33, 35–47 In short, IRMPD offers uninhibited collection of the full MS/MS spectrum due to alleviation of the low mass cut-off (LMCO) associated with conventional CAD in ion traps which stems from a fundamental dependence of the energy deposition of collisional activation on the rf trapping voltage. The rf voltage also defines the m/z range of ions that can be trapped during CAD experiments, and thus there is an inherent compromise between efficient energy deposition and the sacrifice of the lower m/z range during CAD. The mechanism of IR activation is independent of the trapping voltage, thus the trapping voltage can be set at a low value to retain the lower m/z range during IRMPD. IR activation is also a non-resonant process, meaning that both the selected precursor ions and primary fragment ions may be activated, leading to secondary dissociation and a richer, albeit more complex, array of fragment ions. Furthermore, since IR activation is not a collision-based excitation method, there are minimal ion losses due to scattering in comparison to conventional CAD techniques. A potential drawback of IR activation is the relatively low photoabsorption cross-section at 10.6 μm for many analytes, resulting in limited energy deposition in the face of ongoing collisional cooling from the 1 mTorr of helium buffer gas. McLafferty et al. first noted the relatively large photoabsorption cross-section of the phosphate moiety at 10.6 μm based on the vastly different irradiation times necessary to induce dissociation of oligonucleotides versus proteins in an FTICR instrument.48 The large IR absorption efficiency of phosphorylated peptides was exploited by Flora et al.49 in an FTICR mass spectrometer and Crowe et al.37 in a QIT instrument. The phosphate backbone of DNA confers high IR absorptivity, making IRMPD an excellent choice for characterization of DNA/drug complexes, as described in this report. The large IR absorptivity also leads to a controllable degree of ion activation which can be used to mimic traditional CAD MS/MS spectra while minimizing uninformative base losses, or instead be used to promote a high degree of secondary fragmentation to allow more effective sequencing of the DNA incorporated in non-covalent complexes. We also explore the use of IRMPD for multi-adduct dissociation of the sodium adducts associated with DNA/drug complexes to achieve better sensitivity in MS/MS experiments.
Experimental Section
Reagents
Oligodeoxynucleotides (ODNs) were obtained from TriLink Biotechnologies (San Diego, CA) in HPLC-purified ammonium salt form. The following non-self-complementary ODN sequences were used for this study: 5′-GCGGGGATGGGGCG-3′, 5′-CGCCCCATCCCCGC-3′, 5′-GCGGGAATTGGGCG-3′, 5′-CGCCCAATTCCCGC-3′, 5′-GCGGAAATTTGGCG-3′, and 5′-CGCCAAATTTCCGC-3′. All other chemicals including drugs were purchased from Sigma Aldrich (St. Louis, MO) and used without further purification.
DNA Duplex Formation in Solution
A complementary set of ODNs were mixed together in equal volumes of 2 mM each in 250 mM NH4OAc at a nominal pH of 6.5 which resulted in a final duplex concentration of 1 mM after annealing. This ODN solution was annealed for duplex formation at 90° C for 10 minutes then cooled slowly to room temperature over a six hour period. This solution was then diluted for ESI-MS analysis.
Mass Spectrometry
A previously described ThermoFinnigan LCQ Deca XP (San Jose, Ca) modified for IRMPD was used for all of the mass spectrometry experiments.46 All samples were directly infused into the instrument at 3 μl/min with a Harvard Apparatus PHD 2000 syringe pump (Holliston, MA). Duplex DNA sample solutions were prepared at a concentration of 10 μM with equimolar drug in a 25 mM NH4OAc within 75/25 H2O/MeOH (v/v) solvent mixture for ESI-MS analysis. A heated capillary temperature of 90° C was used to minimize in-source dissociation of the duplex while maintaining efficient desolvation of the analyte.
Infrared Multiphoton Dissociation
IRMPD was carried out on an LCQ Deca XP instrument with a model 48–5 Synrad 50 W CO2 continuous wave laser (Mukilteo, WA) previously described in detail.46 Briefly, the laser was triggered during the activation portion of the scan function for photodissociation using a qz value of 0.10 for IRMPD experiments to provide a significant reduction in the low mass cut-off (LMCO) compared to conventional collisionally activated dissociation (CAD), qz = 0.25 at 30 ms. The instrument was also modified with a Porter flow control device, VCD-1000 with a 5 cc/min max flow element (Hatfield, PA), which was installed in-line with the helium gas flow to the ion trap for pressure control. The ion trap helium pressure, as monitored external to the ion trap, was measured as 2.8*10−5 Torr, nominally corresponding to approximately 1 mTorr of helium in the trapping region. Helium was maintained at the same pressure for all experiments in this study (i.e. both CAD and IRMPD modes). The typical irradiation times for IRMPD were < 2 ms at 50 W for duplex DNA/drug complexes or 15 ms at < 15 W unless otherwise stated.
Results and Discussion
A previous study from our group has shown IRMPD to be a successful alternative dissociation method for single strand oligonucleotides in a quadrupole ion trap.33 In comparison to traditional collisionally activated dissociation (CAD), IRMPD provided two major benefits: minimization of uninformative base loss pathways due to the non-resonant nature of photodissociation and direct detection of single nucleobase ions in the low m/z range, facilitating the analysis of modified bases. In this study we extend the application of IRMPD in a quadrupole ion trap to the analysis of duplex DNA/drug complexes in the 5- and 6- charge states transferred to the gas phase by ESI. The types of fragmentation patterns obtained by IRMPD versus CAD are compared, along with an assessment of the diagnostic merit of the spectra in terms of the portion of dead-end (uninformative) pathways.
IRMPD of Duplexes
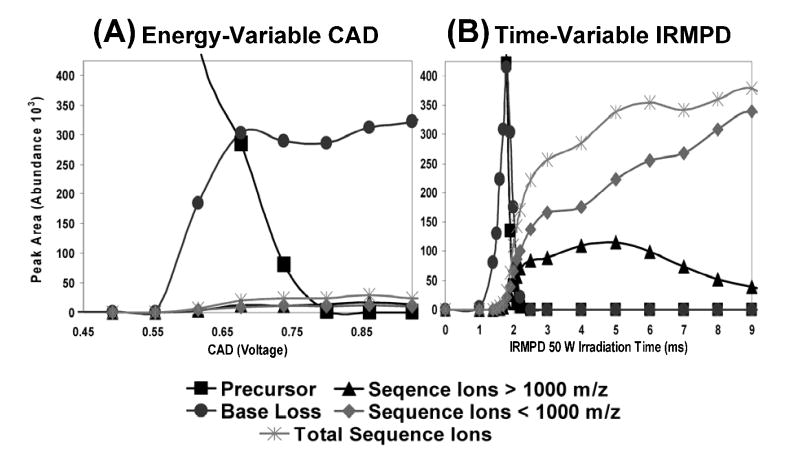
An example of a direct comparison of fragmentation trends for variable energy deposition from CAD and IRMPD for duplex d(GCGGGAATTGGGCG)/(CGCCCAATTCCCGGC) (5- charge state) is shown in Figure 2. Peak area abundances were summed for the precursor ions, the base loss ions, the sequence ions above m/z 1000, the sequence ions below m/z 1000, and finally the total contribution from all sequence ions, as illustrated for energy-variable CAD (Figure 2A) and time-resolved IRMPD (Figure 2B) distributions. For the energy-variable CAD data on the left, the portion of sequence ions increases slightly and the portion of base loss ions increases dramatically until the precursor ion population is exhausted at ~0.8 V CAD voltage, after which no significant change in ion distribution is observed upon application of larger CAD voltages. In contrast, IRMPD results in a large population of base loss ions between 1.0 – 1.5 ms irradiation, but these ions undergo secondary dissociation upon further irradiation (beyond ~2.0 ms), creating a large population of meaningful sequence ions. Interestingly, the total sequence ion abundance shows little change beyond 5 ms of irradiation time, but during this time-frame sequence ions greater than m/z 1000 dissociate into smaller fragment ions below m/z 1000. The striking contrast in sequence ion abundance between the CAD and IRMPD methods can be exploited for interpretation of the DNA sequences constituting each duplex.
Figure 2.
Variable energy dissociation comparison for the [M - 5H]5− ion of duplex d(GCGGGAATTGGGCG)/(CGCCCAATTCCCGC) obtained by (A) CAD (30 ms activation period and qz = 0.25) and (B) IRMPD (50 W laser power and qz = 0.1). Fragment ion types are grouped by ion type including: base loss, sequence ions with m/z > 1000, sequence ions with m/z < 1000, and total sequence ions as summarized in the legend.
IRMPD of Duplex DNA/Drug Complexes
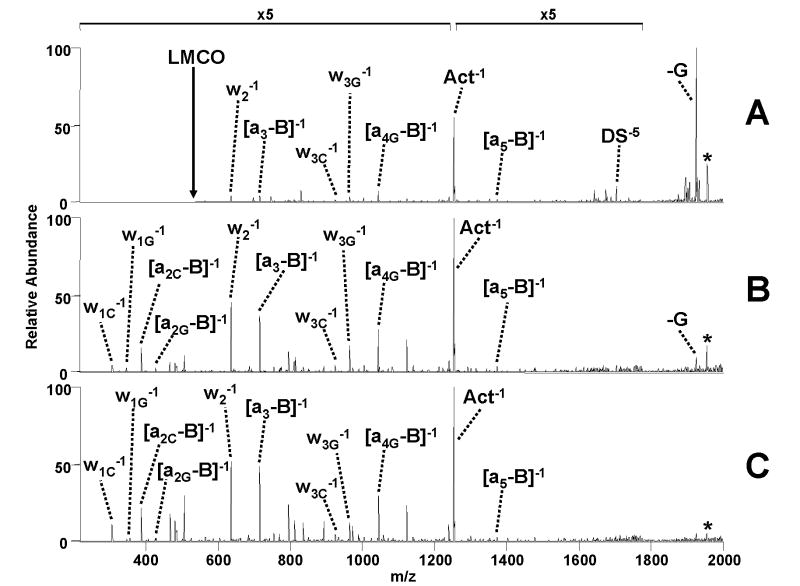
The series of 14-mer duplex/drug complexes used in the current study has been previously shown to yield different CAD patterns based upon the initial charge state of the precursor and the type of drug.10 The typical pathways for the duplex/drug complexes in the 5- charge state include base loss, backbone fragmentation, and neutral drug loss, whereas the 6- charge state complexes undergo sequence dependent drug loss and strand separation with or without drug retention. A MS/MS comparison of CAD to IRMPD for the 5- ion of the complex containing duplex d(GCGGGGATGGGGCG)/(CGCCCCATCCCCGC) and actinomycin is shown in Figure 3. Base loss (-G) and ejection of the drug (as deprotonated actinomycin) dominate the CAD mass spectrum, in addition to minor ions due to covalent cleavage of the single strands (w, a – B ions) (Figure 3A). IRMPD of this same complex results in the same types of fragment ions; however, the base loss products that dominate the CAD spectrum are converted to sequence ions upon IRMPD. Moreover, there is a greater array of lower m/z sequence ions in Figure 3B. These fragment ions are observed in the IRMPD spectrum because of the alleviation of the low mass cut-off problem associated with traditional CAD. The IRMPD efficiency of these complexes is very large due to the phosphate backbone, allowing for the use of very short activation times (1.5 ms at 50 W laser power). This fact also allows MS/MS spectra to be obtained using lower laser powers (12.3 W) while retaining relatively short activation times (15 ms) compared to the 30 msec typically used for CAD experiments (Figure 3C). The efficient dissociation at short irradiation times with these low laser powers suggest that even more modest CO2 lasers could be used for the analysis of duplex/drug complexes with ion trap instruments.
Figure 3.
ESI-MS/MS spectra of the [M - 5H]5− complex containing duplex d(GCGGGGATGGGGCG)/(CGCCCCATCCCCGC) and actinomycin by (A) CAD (0.86 V, 30 ms) (73%); (B) IRMPD (50 W, 1.5 ms) (6%); and (C) IRMPD (12.3 W, 15 ms) (4%) with the portion of uninformative base loss ions given in parenthesis.. Fragment labels include a subscript G or C if they pertain specifically to the G-rich or C-rich strand of the duplex, respectively. The magnification scale applies to all spectra within this figure. Precursor ion is denoted with a * symbol.
As noted above, the base losses that dominate the CAD spectra are minimized due to the non-resonant nature of IRMPD. In the CAD spectrum, as in Figure 3A, uninformative base loss ions constitute 73% of the total fragment ion current. In contrast, the base loss ions represent 6% of the fragment ions in Figure 3B and only 4% in Figure 3C. In these IRMPD spectra the diagnostic sequence ions obtained are correspondingly more abundant. The significant reduction in uninformative base losses and retention of the lower m/z range showcases the impressive advantages of IRMPD over traditional CAD for analysis of DNA/drug complexes and especially for characterization of the oligonucleotide sequences in the complexes. The reduction in the portion of non-informative base loss ions and concomitant conversion to diagnostic sequence ions is consistently observed for the other DNA/drug complexes during IRMPD analysis.
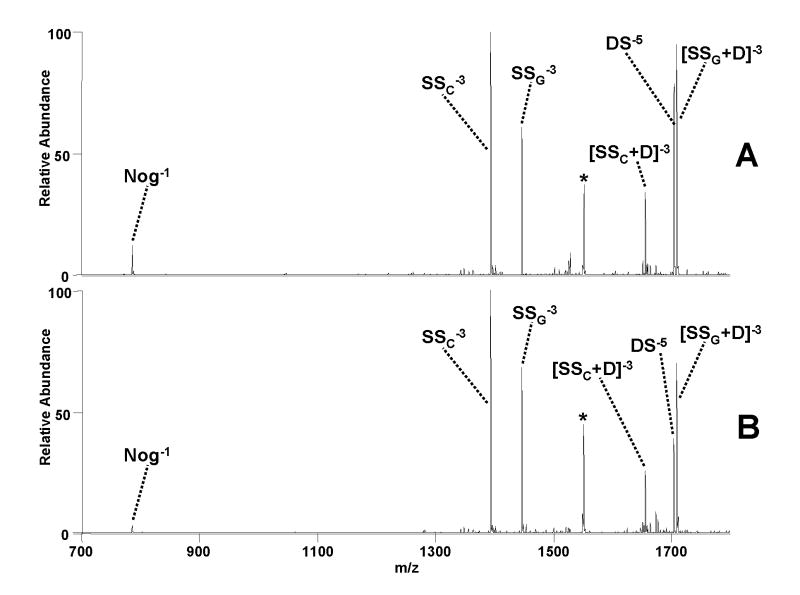
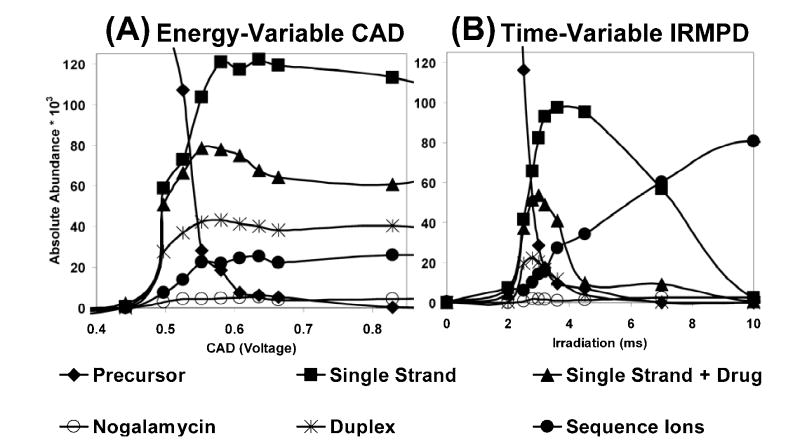
As mentioned earlier, 1:1 DNA duplex/drug complexes in the 6- charge state typically undergo sequence dependent drug loss and strand separation instead of backbone cleavage and base loss dissociation pathways, and this is illustrated in Figure 4 for complexes containing nogalamycin (Nog) bound to duplex d(GCGGAAATTTGGCG)/(CGCCAAATTTCCGC). Figure 4A shows the CAD mass spectrum, and Figure 4B shows the corresponding IRMPD mass spectrum. One dominant dissociation pathway is ejection of deprotonated nogalamycin, yielding the duplex in the 5- charge state (DS5−). The other major pathway is strand separation to yield (SS + Nog)3− ions along with the complementary drug-free single strand ions (SS3−). Energy-variable CAD and time-resolved IRMPD experiments were undertaken to analyze these pathways and product ions in more detail (Figure 5).
Figure 4.
ESI-MS/MS spectra of the [M - 6H]6− complex containing duplex d(GCGGAAATTTGGCG)/(CGCCAAATTTCCGC) and nogalamycin by (A) CAD (0.58 V, 30 ms) and (B) IRMPD (50 W, 3 ms). Fragment ion labels are subscripted with either C or G for the C-rich and G-rich strands, respectively. Precursor ion is denoted with a * symbol.
Figure 5.
Variable energy dissociation comparison for the [M - 6H]6− complex containing duplex d(GCGGGAATTGGGCG)/(CGCCCAATTCCCGC) and nogalamycin (A) CAD (30 ms activation period and qz = 0.25) (B) IRMPD (25 W laser power and qz = 0.1). Fragment ion types were grouped by ion type including: single strand, single strand with drug bound, deprotonated drug, drug-free duplex, and sequence ions as shown in the legend.
The peak area abundances of the precursor ions, summed single strand ions (SSC3− and SSG3− where the subscript C or G designates the C-rich or G-rich oligonucleotide), summed single strand/drug ions ([SSC+Nog]3− and [SSG+Nog]3−), drug-free duplex ions (DS5−), and sequence ions are plotted in Figure 5 for the 6- charge state of the d(GCGGAAATTTGGCG)/(CGCCAAATTTCCGC)/nogalamycin complex. For the energy-variable CAD data, beyond ~0.6V the fragment abundances plateau with no significant change in the ion distributions at greater CAD voltages. Thus the abundant single strand species become dead-end pathways that do not reveal any specific sequence information unless one employs more elaborate MSn strategies. In contrast, the non-resonant nature of IRMPD allows further dissociation of the duplex and single strand ions by using extended irradiation times (Figure 5B). The time-resolved IRMPD data changes significantly as a function of irradiation time with eventual dissociation of all single strand species and duplex ions into sequence relevant fragment ions, all within a span of four to ten milliseconds. This tunability is also observed upon IRMPD analysis of the other DNA/drug complexes and proves advantageous in that IRMPD can be used to mimic CAD or be selectively controlled to enhance sequence ion information at longer irradiation times.
Sequence dependent drug/DNA duplex dissociation by IRMPD
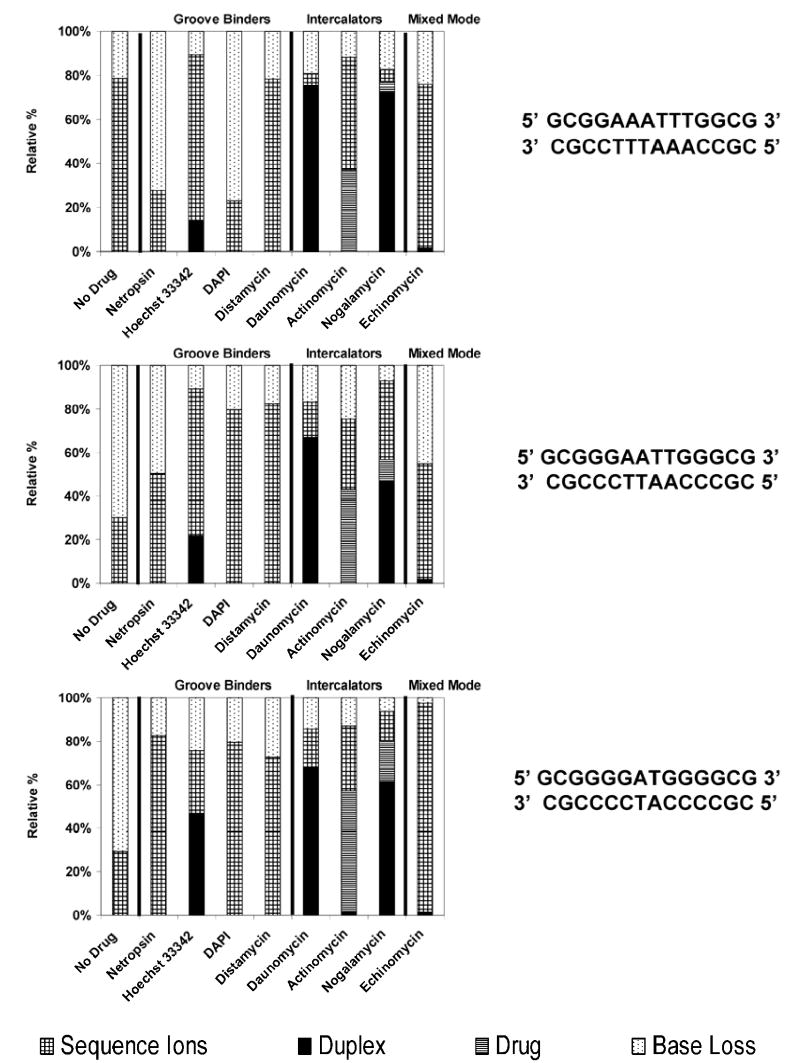
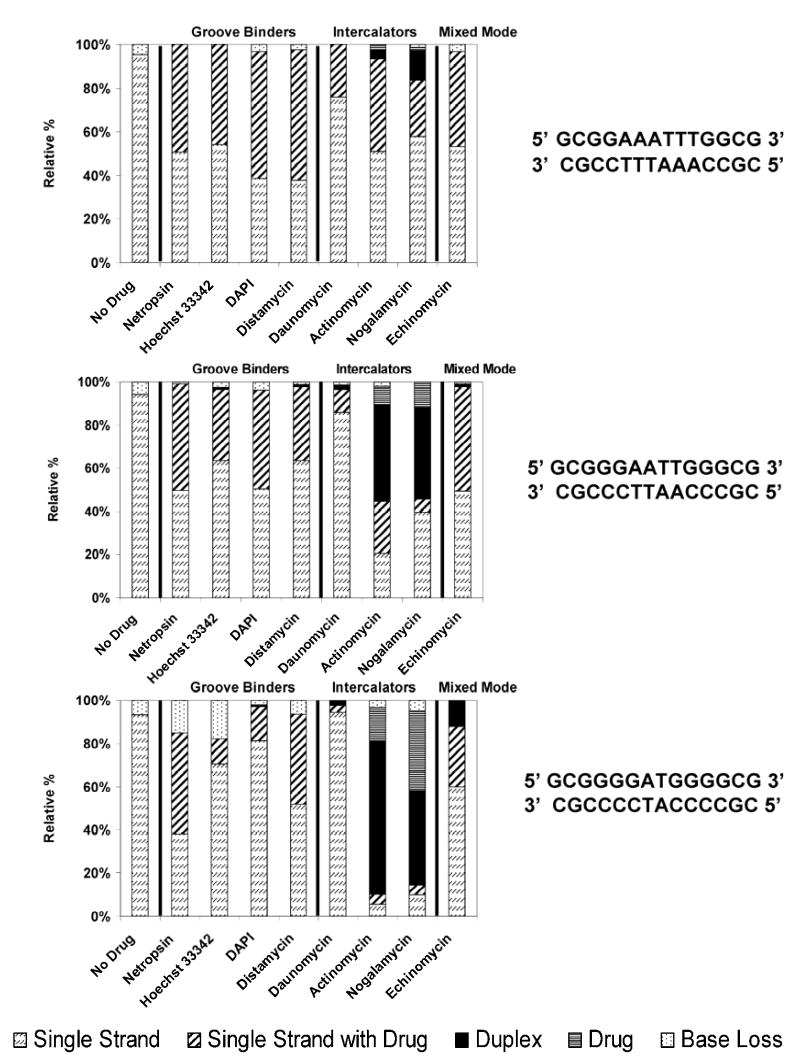
Previous studies have reported a correlation between increasing covalent cleavage (i.e. cleavage of the DNA backbone and base loss) during tandem MS experiments for longer duplexes and those with more GC base character, attributed to greater interstrand hydrogen bonding.5–8, 10 Additionally, low-energy CAD, such as in a QIT, is more likely to facilitate covalent cleavage than non-covalent (strand separation, drug loss) dissociation pathways which seem to be favored at higher collision energies.8 Similar to low energy collisional activation, IR photoactivation also excites the ion population by a slow accumulation of energy. For more detailed comparisons of the general dissociation characteristics of low energy CAD and IRMPD, three duplexes and various complexes containing one of eight different drugs and three different duplexes with increasing GC base character were analyzed by IRMPD and compiled into the segmented bar graphs shown in Figure 6 (5- charge state) and Figure 7 (6- charge state). For each 1:1 duplex/drug complex in the bar graph, the specific drug incorporated in the complex is shown along the x-axis, and the relative abundances of intact single strand ions, single strand ions with bound drug, drug-free duplex ions, deprotonated drug, single strand sequence ions, and base loss ions normalized to 100% are shown along the y-axis. The IRMPD spectra of the drug-free duplexes in the 5- charge state are dominated by base loss ion and sequence ions from backbone cleavage, and the portion of base loss ions increases with the GC content of the duplex, as has been noted in past CAD studies and attributed to the greater interstrand hydrogen bonding in GC rich duplexes and/or the higher basicity of guanine that facilitates proton transfer necessary for base loss. Predominantly single strand ions due to strand separation of the duplexes are observed in the IRMPD spectra of the drug-free duplexes in the 6- charge state. There is very little change in this pattern as a function of the duplex.
Figure 6.
IRMPD MS/MS (50 W, 1.0 ms - 1.5 ms) comparison for the [M - 5H]5− complexes containing one of three duplexes with varying GC character (sequences shown to the right of the bar graph) and one drug, grouped by their different modes of binding. Fragment ions were grouped by type including sequence ions, duplexes due to drug loss, free drug ions, and base loss ions. The bar graphs show the percentage for each of these fragment types with the total fragment ion current normalized to 100%.
Figure 7.
IRMPD MS/MS (50 W, 0.8 ms – 1.6 ms) comparison for the [M - 6H]6− complexes containing one of three duplexes with varying GC character (sequences shown to the right of the bar graph) and one drug, grouped by their different modes of binding. Fragment ions were grouped by type including drug-free single strand ions, single strand ions with drug bound, drug-free duplex ions, free drug ions, and base loss ions. The bar graphs show the percentage for each of these fragment types with the total fragment ion current normalized to 100%.
For all of the duplex/drug complexes in the 5- charge state, simple strand separation with or without retention of the drug is not observed (Figure 6), and instead sequence ions (a – B, w) of the individual DNA strands are dominant for the complexes containing netropsin, Hoechst 33342, DAPI, distamycin, or echinomycin. The drug loss pathway is predominant for complexes containing the intercalators, daunomycin, actinomycin, and nogalamycin. The complexes containing Hoechst 33342 are the only ones containing a minor groove binding drug in which the loss of the drug is a substantial process. Unlike the other minor groove binders, Hoechst 33342 does not contain a highly basic guanidinium group and this may explain its notable tendency to be ejected from the complexes during IRMPD, unlike the other three (netropsin, DAPI, and distamycin) which may engage in stronger attractive hydrogen-bonding with the negatively charged duplexes in the gas phase. Both Hoechst 33342 and distamycin are known to have a net 1+ charge in solution (see Figure 1), so the notable difference in the tendencies of their complexes to dissociate by ejection of the drug suggests that the presence of the highly basic guanidinium group plays a special role. Drug ejection was also commonly observed upon CAD of these analogous complexes, so this fragmentation process is related to the nature of the drug, not the activation mode. For all the 5- complexes evaluated in Figure 6, the relative portion of diagnostic sequence ions increases and the extent of base loss decreases with the increasing GC content of the duplex.
For the analogous 6- complexes, ions due to strand separation of the DNA/drug complexes and drug-free duplex ions are the major fragment ions upon IRMPD. Several trends are apparent from the bar graph data in Figure 7. First, the portion of base loss ions generally increases as the sequence becomes more GC-rich, in agreement with previous CAD studies.8,10 This preference is also in accord with the equivalent CAD data acquired for these complexes in the present study (data not shown). Second, strand separation pathways dominate for the complexes containing the groove binding drugs; these fragmentation routes compete with base loss pathways that increase for more GC-rich sequences. For the complexes containing minor groove binders, typically no drug-free duplex ions are observed in the IRMPD spectra. In contrast, the complexes containing most of the intercalators exhibit significant drug loss to form drug-free duplex ions, suggesting that the intercalating drugs are less strongly bound in the gas phase. Complexes containing actinomycin, nogalamycin, and to a lesser extent daunomycin all produce some portion of deprotonated drug upon IRMPD, presumably due to the relative high acidities of these drugs. Interestingly, the complexes containing echinomycin undergo an intermediate degree of drug ejection, and deprotonated echinomycin is not observed in the resulting IRMPD spectra. Echinomycin might be expected to mimic the behavior of the other intercalating drugs, but it is known to be a bis-intercalator and would therefore be predicted to engage in stronger interactions with the duplex. Moreover, echinomycin does not have any obviously acidic sites and thus would not be expected to be readily lost in a deprotonated form.
MS3 experiments by IRMPD
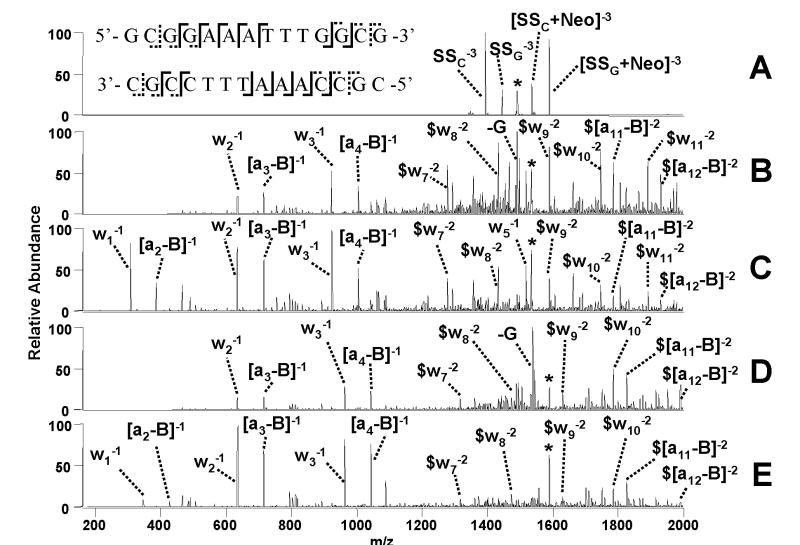
Drug binding affinity and selectivity are often screened via high throughput approaches in which mixtures containing multiple drugs or multiple duplexes are analyzed in an effort to rapidly pinpoint promising high affinity drugs or to evaluate sequence selectivity. Implementation of mass spectrometric-based screening methods requires that the high affinity DNA sequences can be accurately identified. In some cases, such as for the 6- charge state complexes in the present study, tandem mass spectrometry does not lead directly to informative sequence ions, and thus efficient MSn methods are needed to assist in structural characterization of the DNA sequences. In fact, IRMPD can be employed for two sequential stages of dissociation in MS3 experiments to provide excellent sequencing of the DNA while minimizing the uninformative base losses that make conventional multi-stage CAD methods less effective. Figure 8A shows a representative IRMPD mass spectrum of the [M – 6H]6− complex containing netropsin and duplex d(GCGGAAATTTGGCG/CGCCAAATTTCCGC). The IRMPD process exclusively promotes strand separation. These fragment ions can be individually isolated and subjected to a second stage of IRMPD to produce sequence ions, as shown for the single strand ions with netropsin bound in Figures 8C and 8E. A direct comparison to using a CAD/CAD approach for dissociation of these drug bound single strand species is included in Figure 8B and 8D. As expected the PD/PD technique minimizes base loss and allows retention of low m/z fragment ions, offering a more successful MS/MS approach for compilation of sequence information. The an - B and wm ions in Figure 8 that retain the drug can be easily pinpointed by their mass shifts relative to the expected an - B and wm ions that don’t contain the drug, thus providing some basic information about the localization of the drug along the oligonucleotide. Based on the sequence coverage map created from the IRMPD spectra in Figures 8C and 8E, as summarized in the sequence map located in Figure 8A, netropsin appears to be localized at the central A/T rich regions of the duplex in agreement with netropsin’s specificity observed from solution data.50 Unfortunately, the low propensity for cleavage at thymine nucleobases and the potential for multiple binding sites of the drug prevent assignment of one specific binding site. The analogous complexes containing DAPI or distamycin underwent similar fragmentation processes, allowing observation of single strand fragments containing the drug (data not shown). Retention of the drug by the separated single strands was not observed for complexes containing the intercalating agents nor Hoechst 33342.
Figure 8.
ESI-MS3 experiments for the [M - 6H]6− complex containing duplex d(GCGGAAATTTGGCG)/(CGCCAAATTTCCGC) and netropsin. (A) MS/MS of the initial [M-6H]6− complex (IRMPD, 50 W, 1.2 ms) to generate the strand separation product ions, (B) CAD/CAD of [SSC+Neo]3− (0.55 V, 30 ms); (C) PD/PD of [SSC+Neo]3− (50 W, 1.6 ms); (D) CAD/CAD of [SSG+Neo]3− (0.55 V, 30 ms) and (E) PD/PD of [SSG+Neo]3− (50 W, 1.6 ms) species. Fragment labels include a subscript G or C if they specifically pertain to the G-rich or C-rich strand, respectively. An asterisk (*) symbol denotes the precursor ion selected and a ($) symbol denotes fragment ions with netropsin bound. The sequence coverage obtained by combining the information from the IRMPD spectra is shown on spectrum A where dotted tags indicate no drug attached and solid lines represent fragments with drug bound.
Multi-adduct Dissociation of Drug/DNA Duplexes by IRMPD
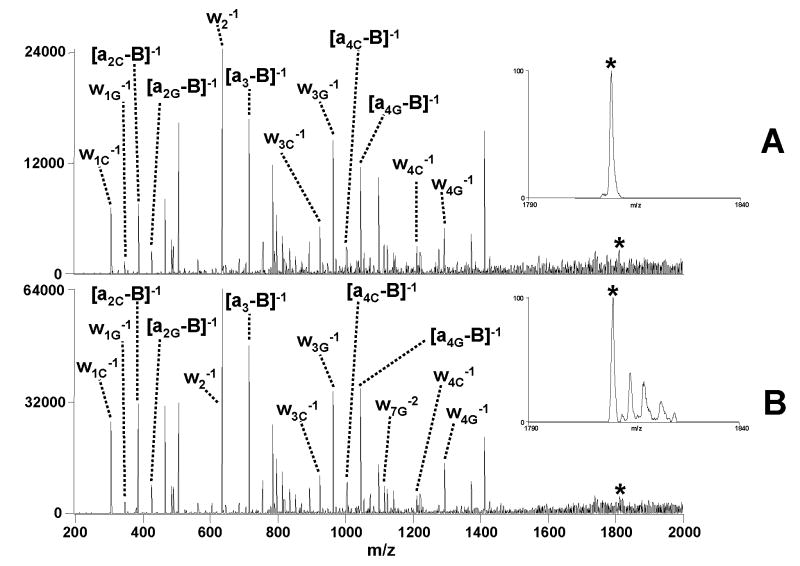
For tandem mass spectrometry experiments, methods that improve sensitivity will generally minimize sample consumption and analysis time. Sensitivity issues are a particular concern for DNA analysis because DNA is prone to salt contamination, and the phosphate backbone readily forms adducts with sodium, leading to reduced abundances of non-adducted deprotonated species of interest and division of the total ion current over numerous DNA/sodium adducts. Solution additives and careful choice of annealing buffer, such as ammonium acetate, can help suppress the formation of these adducts to some extent, but the adduction problem can re-surface in DNA/drug binding studies in which the drug may be an inadvertent source of salt contamination and also the targeted DNA-drug complexes may have inherently low abundances, thus exacerbating their detection and tandem mass spectrometric analysis. The sodium and other adducts are rarely exploited because of the inability to effectively isolate and activate the variety of adducts and their potential for complicating the resulting MS/MS spectra. However, due to the non-resonant nature of IRMPD, a range of adducted DNA/drug complexes can be activated simultaneously and efficiently, thus converting the adducts to useful fragment ions while also typically dislodging the attached sodium. The resulting IRMPD mass spectra have improved signal-to-noise ratios, and the fragment ions themselves are free of the adduction problem. An example of the broadband isolation/IRMPD method is shown in Figure 9. The IRMPD mass spectrum obtained for a complex containing duplex d(GCGGGAATTGGGCG)/(CGCCCAATTCCCGC) and daunomycin in the 5- charge state which was isolated by normal unit m/z precursor selection followed by IRMPD is shown in Figure 9A in which the major dissociation pathways include loss of the charged drug and backbone cleavage of the DNA. The average S/N is estimated to be approximately 29, based on the abundance of the [a4G - B]−1 ion at m/z 1044 and the noise surrounding this ion in a region ±30 m/z units around it. The isolation spectrum of the 5- precursor ion prior to IR activation is shown in the inset of Figure 9A. When a broader isolation window including the adducted species with up to three sodium atoms is applied for the same complex, as shown in the spectrum inset of Figure 9B, a significant increase in the fragment ion current is obtained in the resulting IRMPD mass spectrum, along with an increase in the overall S/N by a factor of ~1.7. In fact when comparing peak area abundances, the wider isolation window provides a 2.6 fold amplification in precursor ion abundance which is directly converted into a 2.6 fold increase in fragment ion peak area upon IRMPD in Figure 9B. Moreover, sodium adducted fragments are not observed, thus making the resulting IRMPD mass spectrum uncluttered and allowing straightforward interpretation. Equivalent multi-adduct IRMPD of a complex containing the same duplex bound to netropsin, a minor groove binding ligand, in the 5- charge state showed similar performance enhancement, suggesting that the drug binding mode does not dramatically impact this process. Multiple m/z isolation windows and subsequent activation is also possible using broad-band CAD waveforms, but the resulting spectra showed non-uniform activation of the adducts, unlike IRMPD. This is perhaps in part due to activation waveform inconsistencies over the selected parent region or to differences in critical energies for these various adducted species which are negligible by IRMPD due to the large photon absorption of the complexes. In the broad range isolation mode, IRMPD promotes the conversion of uninformative base loss fragments to meaningful sequence fragments, along with retention of the low mass-to-charge portion of the spectrum.
Figure 9.
Comparison of IRMPD mass spectra of (A) normal precursor isolation (50 W, 1.5ms) and (B) multi-adduct isolation (50 W, 1.5ms) for the [M - 5H]5− complex containing duplex d(GCGGGAATTGGGCG)/(CGCCCAATTCCCGC) and daunomycin. Isolation of the precursor [M - 5H]5− through the [M + 3Na - 8H]5− species are included in the multi-adduct spectrum as shown by the inset in B compared to isolation of only the deprotonated precursor for the normal isolation mode spectrum in the inset in A. Fragment labels include a subscript G or C if they specifically pertain to the G-rich or C-rich strand, respectively. An asterisk (*) symbol denotes the precursor ion selected.
For the 6- charge state of the complex containing the same DNA duplex but with actinomycin instead of daunomycin, the broadband isolation and IR activation procedure results in an increase in total ion abundance of about a factor of two relative to isolation and IRMPD of a single DNA duplex/drug complex. Because the non-covalent dissociation pathways (i.e. strand separation, not backbone cleavage) dominate for the 6- charge states, sodium-adducted fragment ions are observed in the IRMPD mass spectra (data not shown), and thus the gain in signal is more modest since the sodiums are not all dislodged. This broadband isolation and IRMPD method is easily implemented for the other DNA/drug complexes and gives comparable enhancements in sensitivity as described for the representative daunomycin and actinomycin complexes.
Conclusions
IRMPD mass spectra of an array of non-covalent duplex/drug complexes containing duplexes of variable GC content and one of eight drugs were compared to conventional CAD mass spectra obtained in a quadrupole ion trap mass spectrometer. IRMPD at lower laser powers and short irradiation times provided similar spectra to CAD but could also be tuned to yield a significantly higher degree of secondary fragmentation at higher laser powers and somewhat longer irradiation times (4 to 10 ms), thus allowing more effective sequencing of the DNA. Because the IRMPD process is independent of the rf trapping voltage and associated low mass cutoff normally encountered in conventional CAD, richer MS/MS spectra are obtained with highly diagnostic sequence ions in the low m/z range. As an alternative to single stage IRMPD, IRMPD/IRMPD strategies allowed selective sequencing of the individual DNA strands incorporated in the duplex/drug complexes. Isolation and IR excitation of multiple DNA/drug adduct species were easily implemented in the IRMPD mode, resulting in better sensitivity for tandem mass spectrometry experiments because the normally unexploited sodium adducts can be converted to useful fragment ions.
Acknowledgments
Funding from the Robert A. Welch Foundation (F1155), the National Science Foundation (CHE-0315337), and the National Institutes of Health (RO1 GM65956) is gratefully acknowledged.
References
- 1.Fenn J, Mann M, Meng C, Wong S, Whitehouse C. Science. 1989;246:64–71. doi: 10.1126/science.2675315. [DOI] [PubMed] [Google Scholar]
- 2.Heck A, van den Heuvel R. Mass Spectrom Rev. 2004;23:368–389. doi: 10.1002/mas.10081. [DOI] [PubMed] [Google Scholar]
- 3.Hofstadler S, Griffey R. Chem Rev. 2001;101:377–390. doi: 10.1021/cr990105o. [DOI] [PubMed] [Google Scholar]
- 4.Loo J. Int J Mass Spectrom. 2000;200:175–186. [Google Scholar]
- 5.Schnier P, Klassen J, Strittmatter E, Williams E. J Am Chem Soc. 1998;120:9605–9613. doi: 10.1021/ja973534h. [DOI] [PMC free article] [PubMed] [Google Scholar]
- 6.Wan K, Gross M, Shibue T. J Am Soc Mass Spectr. 2000;11:450–457. doi: 10.1016/S1044-0305(00)00095-7. [DOI] [PubMed] [Google Scholar]
- 7.Gabelica V, De Pauw E. J Mass Spectrom. 2001;36:397–402. doi: 10.1002/jms.141. [DOI] [PubMed] [Google Scholar]
- 8.Gabelica V, De Pauw E. J Am Soc Mass Spectr. 2002;13:91–98. doi: 10.1016/s1044-0305(01)00335-x. [DOI] [PubMed] [Google Scholar]
- 9.Danell A, Parks J. J Am Soc Mass Spectr. 2003;14:1330–1339. doi: 10.1016/S1044-0305(03)00578-6. [DOI] [PubMed] [Google Scholar]
- 10.Keller K, Zhang J, Oehlers L, Brodbelt J. J Mass Spectrom. 2005;40:1362–1371. doi: 10.1002/jms.927. [DOI] [PubMed] [Google Scholar]
- 11.Rosu F, Gabelica V, Houssier C, Colson P, De Pauw E. Rapid Commun Mass Sp. 2002;16:1729–1736. doi: 10.1002/rcm.778. [DOI] [PubMed] [Google Scholar]
- 12.Goodlett D, Camp D, Hardin C, Corregan M, Smith R. Biol Mass Spectrom. 1993;22:181–183. doi: 10.1002/bms.1200220307. [DOI] [PubMed] [Google Scholar]
- 13.Gabelica V, De Pauw E, Rosu F. J Mass Spectrom. 1999;34:1328–1337. doi: 10.1002/(SICI)1096-9888(199912)34:12<1328::AID-JMS889>3.0.CO;2-F. [DOI] [PubMed] [Google Scholar]
- 14.Kapur A, Beck J, Sheil M. Rapid Commun Mass Sp. 1999;13:2489–2497. doi: 10.1002/(SICI)1097-0231(19991230)13:24<2489::AID-RCM816>3.0.CO;2-F. [DOI] [PubMed] [Google Scholar]
- 15.Rosu F, Gabelica V, Houssier C, De Pauw E. Nucleic Acids Res. 2002;30 doi: 10.1093/nar/gnf081. [DOI] [PMC free article] [PubMed] [Google Scholar]
- 16.Rosu F, Pirotte S, De Pauw E, Gabelica V. Int J Mass Spectrom. 2006;253:156–171. [Google Scholar]
- 17.David W, Brodbelt J, Kerwin S, Thomas P. Anal Chem. 2002;74:2029–2033. doi: 10.1021/ac011283w. [DOI] [PubMed] [Google Scholar]
- 18.Mazzitelli C, Brodbelt J, Kern J, Rodriguez M, Kerwin S. J Am Soc Mass Spectr. 2006;17:593–604. doi: 10.1016/j.jasms.2005.12.011. [DOI] [PubMed] [Google Scholar]
- 19.Oehlers L, Mazzitelli C, Brodbelt J, Rodriguez M, Kerwin S. J Am Soc Mass Spectr. 2004;15:1593–1603. doi: 10.1016/j.jasms.2004.07.015. [DOI] [PubMed] [Google Scholar]
- 20.Reyzer M, Brodbelt J, Kerwin S, Kumar D. Nucleic Acids Res. 2001;29:art. no.-e103. doi: 10.1093/nar/29.21.e103. [DOI] [PMC free article] [PubMed] [Google Scholar]
- 21.Beck J, Gupta R, Urathamakul T, Williamson N, Sheil M, Aldrich-Wright J, Ralph S. Chem Commun. 2003:1106–1106. doi: 10.1039/b212132h. [DOI] [PubMed] [Google Scholar]
- 22.Colgrave M, Beck J, Sheil M, Searle M. Chem Commun. 2002:556–557. doi: 10.1039/b200235n. [DOI] [PubMed] [Google Scholar]
- 23.Rosu F, De Pauw E, Guittat L, Alberti P, Lacroix L, Mailliet P, Riou J, Mergny J. Biochemistry. 2003;42:10361–10371. doi: 10.1021/bi034531m. [DOI] [PubMed] [Google Scholar]
- 24.Carrasco C, Rosu F, Gabelica V, Houssier C, De Pauw E, Garbay-Jaureguiberry C, Roques B, Wilson W, Chaires J, Waring M, Bailly C. ChemBioChem. 2002;3:1235–1241. doi: 10.1002/1439-7633(20021202)3:12<1235::AID-CBIC1235>3.0.CO;2-I. [DOI] [PubMed] [Google Scholar]
- 25.Gupta R, Kapur A, Beck J, Sheil M. Rapid Commun Mass Sp. 2001;15:2472–2480. doi: 10.1002/rcm.524. [DOI] [PubMed] [Google Scholar]
- 26.Griffey R, Sannes-Lowery K, Drader J, Mohan V, Swayze E, Hofstadler S. J Am Chem Soc. 2000;122:9933–9938. [Google Scholar]
- 27.Hofstadler S, Drader J, Sannes-Lowery K, Swayze E, Griffey R. Abstr Pap Am Chem S. 2001;221:U100–U100. [Google Scholar]
- 28.Sannes-Lowery K, Griffey R, Hofstadler S. Anal Biochem. 2000;280:264–271. doi: 10.1006/abio.2000.4550. [DOI] [PubMed] [Google Scholar]
- 29.Sannes-Lowery K, Mei H, Loo J. Int J Mass Spectrom. 1999;193:115–122. [Google Scholar]
- 30.Hogan J, McLuckey S. J Mass Spectrom. 2003;38:245–256. doi: 10.1002/jms.458. [DOI] [PubMed] [Google Scholar]
- 31.Reid G, Wu J, Chrisman P, Wells J, McLuckey S. Anal Chem. 2001;73:3274–3281. doi: 10.1021/ac0101095. [DOI] [PubMed] [Google Scholar]
- 32.Newton K, Chrisman P, Reid G, Wells J, McLuckey S. Int J Mass Spectrom. 2001;212:359–376. doi: 10.1002/rcm.512. [DOI] [PubMed] [Google Scholar]
- 33.Keller K, Brodbelt J. Anal Biochem. 2004;326:200–210. doi: 10.1016/j.ab.2003.12.010. [DOI] [PubMed] [Google Scholar]
- 34.McLuckey S, Vaidyanathan G. Int J Mass Spectrom Ion Processes. 1997;162:1–16. [Google Scholar]
- 35.Boue S, Stephenson J, Yost R. Rapid Commun Mass Sp. 2000;14:1391–1397. doi: 10.1002/1097-0231(20000815)14:15<1391::AID-RCM36>3.0.CO;2-O. [DOI] [PubMed] [Google Scholar]
- 36.Colorado A, Shen J, Vartanian V, Brodbelt J. Anal Chem. 1996;68:4033–4043. doi: 10.1021/ac9600565. [DOI] [PubMed] [Google Scholar]
- 37.Crowe M, Brodbelt J. J Am Soc Mass Spectr. 2004;15:1581–1592. doi: 10.1016/j.jasms.2004.07.016. [DOI] [PubMed] [Google Scholar]
- 38.Crowe M, Brodbelt J. Anal Chem. 2005;77:5726–5734. doi: 10.1021/ac0509410. [DOI] [PubMed] [Google Scholar]
- 39.Crowe M, Brodbelt J, Goolsby B, Hergenrother P. J Am Soc Mass Spectr. 2002;13:630–649. doi: 10.1016/S1044-0305(02)00366-5. [DOI] [PubMed] [Google Scholar]
- 40.Drader J, Hannis J, Hofstadler S. Anal Chem. 2003;75:3669–3674. doi: 10.1021/ac030157k. [DOI] [PubMed] [Google Scholar]
- 41.Goolsby B, Brodbelt J. J Mass Spectrom. 1998;33:705–712. doi: 10.1002/1096-9888(200008)35:8<1011::AID-JMS29>3.0.CO;2-R. [DOI] [PubMed] [Google Scholar]
- 42.Hashimoto Y, Hasegawa H, Yoshinari K, Waki I. Anal Chem. 2003;75:420–425. doi: 10.1021/ac025866x. [DOI] [PubMed] [Google Scholar]
- 43.Payne A, Glish G. Anal Chem. 2001;73:3542–3548. doi: 10.1021/ac010245+. [DOI] [PubMed] [Google Scholar]
- 44.Shen J, Brodbelt J. Analyst. 2000;125:641–650. [Google Scholar]
- 45.Stephenson J, Booth M, Shalosky J, Eyler J, Yost R. J Am Soc Mass Spectr. 1994;5:886–893. doi: 10.1016/1044-0305(94)87013-6. [DOI] [PubMed] [Google Scholar]
- 46.Wilson JJ, Brodbelt JS. Anal Chem. 2006;78:6855–6862. doi: 10.1021/ac060760d. [DOI] [PubMed] [Google Scholar]
- 47.Pikulski M, Wilson JJ, Brodbelt JS. Anal Chem. 2006 doi: 10.1021/ac061472k. In Press. [DOI] [PubMed] [Google Scholar]
- 48.Little D, Speir J, Senko M, O’Connor P, McLafferty F. Anal Chem. 1994;66:2809–2815. doi: 10.1021/ac00090a004. [DOI] [PubMed] [Google Scholar]
- 49.Flora J, Muddiman D. J Am Chem Soc. 2002;124:6546–6547. doi: 10.1021/ja0261170. [DOI] [PubMed] [Google Scholar]
- 50.Zimmer C, Puschendorf B, Grunicke H, Chandra P, Venner H. Eur J Biochem. 1971;21:269–278. doi: 10.1111/j.1432-1033.1971.tb01466.x. [DOI] [PubMed] [Google Scholar]


