Abstract
RT29 is a dicationic diamidine derivative that does not obey the classical “rules” for shape and functional group placement that are expected to result in strong binding and specific recognition of the DNA minor groove. The compound contains a benzimidazole-diphenyl ether core that is flanked by the amidine cations. The diphenyl ether is highly twisted and gives the entire compound too much curvature to fit well to the shape of the minor groove. DNaseI footprinting, fluorescence intercalator displacement studies and circular dichroism spectra, however, indicate that the compound is an AT specific minor groove binding agent. Even more surprisingly, quantitative biosensor-surface plasmon resonance and isothermal titration calorimetric results indicate that the compound binds with exceptional strength to certain AT sequences in DNA with a large negative enthalpy of binding. Crystallographic results for the DNA complex of RT29 compared to calculated results for the free compound show that the compound undergoes significant conformational changes to enhance its minor groove interactions. In addition, a water molecule is incorporated directly into the complex to complete the compound-DNA interface and it forms an essential link between the compound and base pair edges at the floor of the minor groove. The calculated ΔCp value for complex formation is substantially less than the experimentally observed value in support of water being an intrinsic part of the complex with a major contribution to the ΔCp value. Both the induced fit conformational changes of the compound and the bound water are essential for strong binding to DNA by RT29.
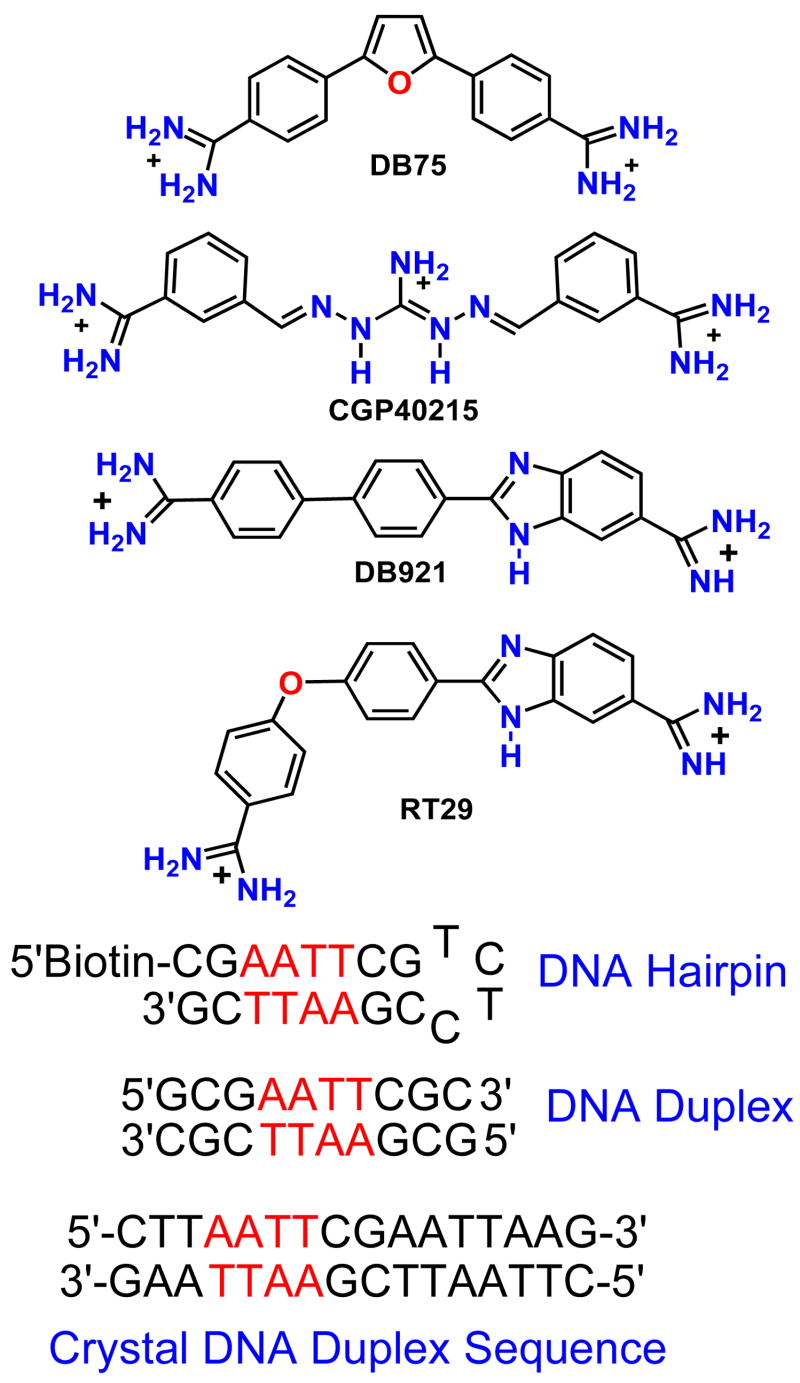
Heterocyclic cations that bind strongly and specifically to the DNA minor groove are of interest for the fundamental information that they provide about DNA recognition mechanisms as well as for their therapeutic and biotechnology uses (1–14). Heterocyclic diamidines, for example, have shown excellent activity against several eukaryotic parasitic diseases and a prodrug of DB75 (Figure 1) is in Phase III clinical trials against sleeping sickness (1–3). Parasitic diseases, such as sleeping sickness, are caused by vector transmitted kinetoplastid parasites and there is currently an alarming world-wide spread of these diseases (1–3). The seriousness of the problem is emphasized by the fact that, in the absence of treatment, the outcome of sleeping sickness is death of the patient. Fluorescence microscopy of kinetoplastid parasites after treatment with fluorescent diamidines clearly shows that the compounds selectively target the mitochondrial kinetoplast, with subsequent destruction of the kinetoplast and cell death (2, 3). The extensive AT sequences of the kinetoplast minicircle DNA are a favorable target for the diamidines and the interaction appears to interfere with replication of the catenated kinetoplast DNA (kDNA) network (2, 3, 15). The minor groove in AT sequences can more easily assume the narrow width that is required for tight binding of the heterocyclic-amidine system of the dications than the groove in G·C or mixed base pair sequences (3, 4, 8–10). The extra H-bond of the G·C base pairs typically leads to a wider minor groove and presents a steric block to deep penetration of compounds into the groove (4, 11).
Figure 1.
Structures for RT29 with other diamidines and DNA hairpin and self-complementary duplex sequences.
Structural studies of the DNA interactions of minor groove binding agents over many years have led to derivation of a set of rules concerning shape and properties of the compounds that are required for effective minor groove complex formation in AT sequences (3–5, 10, 12–14). In particular, fairly rigid criteria for compound curvature, and functional group positioning in the compound have been defined for optimum DNA fit and interactions (9, 16, 17). Important molecular features of minor groove binders include a crescent shape that complements the helical minor groove, positive charges to enhance electrostatic interactions, appropriately placed inward facing H-bonding groups for sequence recognition, and an extended unfused heterocyclic structure to allow optimization of the compound for DNA minor groove interactions (4, 11, 17). These rules have been used successfully to design many minor-groove-binding heterocycles, such as DB75, with strong minor groove interactions, significant biological activity, and lo w general toxicity (1–3, 17).
Proteins that recognize DNA, however, use a broad array of different structural units, shapes, and frequently involve water molecules in their DNA complexes (18, 19). These results suggest that a much broader array of minor groove interactions by small molecules might be possible than has previously been observed or envisioned. Discovery and design of new modes for minor groove recognition could lead to new classes of antiparasitic and anticancer drugs with improved and broader activity as well as different structures for bypassing possible resistance mechanisms if they should develop with classically shaped minor groove compounds. Such nonclassical, but relatively simple compounds with well-defined complexes, could also expand our fundamental understanding of the recognition of DNA and the role of solvent in DNA molecular recognition (17).
In our search for variations on minor groove binding motifs, several criteria have been used to focus the design and search. Diamidine derivatives of different structure have been investigated since such compounds have demonstrated a variety of excellent DNA interaction, cell uptake and therapeutic properties (1–3, 20, 21). Recently, for example, two relatively linear diamidines, CGP40215 and DB921 (Figure 1), that bind strongly to the minor groove, even though they do not follow the classical rules described above, have been discovered and characterized (3, 22–25). Crystallographic analysis of the compounds bound to an -AATT- minor groove site has shown that a water molecule forms a critical part of the complex in both cases. This finding supports the concept that diamidines with varied structure and functional groups may be able to escape the classical constraints on minor groove complexes and yield a wide variety of structures not predicted by the rules described above.
Benzimidazole heterocycles have shown excellent DNA interactions in a number of systems (3, 4, 14, 25–29), and we included benzimidazole derivatives in our design and search exploration for new types of minor groove binding agents. RT29 (Figure 1) is a benzimidazole-diamidine with a diphenyl ether group and, because of this linkage, the compound is too highly curved and twisted to bind to the minor groove by the classical mode. In fact, the predicted shape of the compound in solution suggests, based on comparison to standard minor groove binding agents (17), that it should bind only weakly to DNA by nonspecific electrostatic interactions. Surprisingly, biological testing results revealed that the compound has excellent antitrypanosomal activity. In a search for the biological target and mechanism of therapeutic action for RT29, the quite unexpected observation was made that it displays very strong and selective binding to AT sequences in DNA (30). The binding is significantly stronger than that of DB75 or related compounds that actually fit the classical rules for formation of minor groove complexes. RT29 presents a striking new motif for DNA recognition and provides new ideas for design of nonclassical heterocyclic cations to recognize the DNA minor groove. In order to fully understand the DNA interactions of unusual minor groove binding compounds, such as RT29, it is essential to characterize the energetics of complex formation in detail. To accomplish this goal we have used DNaseI footprinting and fluorescence intercalator displacement methods to characterize the sequence selectivity of RT29 binding in more detail. Detailed thermodynamic studies have been used to better understand the energetic basis for the strong binding of RT29. All of the results are correlated with the observed x-ray structure of RT29 bound into the minor groove (2) and they provide an essential energetic understanding to complement the structural details of the DNA complex.
MATERIALS AND METHODS
Compounds, DNAs, and Buffers
RT29 was synthesized as previous described (3). Oligomers and 5′-Biotin labeled hairpin DNA oligomers were from Midland Certified Reagent Co. with reverse phased HPLC purification and mass spectrometry characterization (Figure 1). PolydA.polydT was from Pharmacia. Tris buffers contained 0.01M Tris HCl and 0.001M EDTA adjusted to pH 7.4. Tris10, Tris20, Tris50 and Tris100 buffers contained the above components plus 0.10, 0.20, 0.50, and 1.0 M NaCl, respectively. Cacodylic buffer was used for Tm and ITC experiments and it contained 10mM cacodylic acid, 1mM EDTA, and 200mM NaCl and the pH adjusted to 6.25.
DNaseI Footprinting: Purification of DNA Restriction Fragments and Radiolabeling
The different plasmids were isolated from E. coli by a standard sodium dodecyl sulphate-sodium hydroxide lysis procedure and purified by banding in CsCl-ethidium bromide gradients. The 117-bp DNA fragments was prepared by 3′-[32P]-end labeling of the EcoRI-PvuII double digest of the pBS plasmid (Stratagene) using α-[32P]-dATP (Amersham, 3000 Ci/mmol) and AMV reverse transcriptase (Roche). The same thing was done with 176-bp fragment (pTUC plasmid). In each case, the labeled digestion products were separated on a 6% polyacrylamide gel under non-denaturing conditions in TBE buffer (89 mM Tris-borate pH 8.3, 1 mM EDTA). After autoradiography, the requisite band of DNA was excised, crushed and soaked in water overnight at 37 °C. This suspension was filtered through a Millipore 0.22 μm filter and the DNA was precipitated with ethanol. Following washing with 70% ethanol and vacuum drying of the precipitate, the labeled DNA was resuspended in 10 mM Tris adjusted to pH 7.0 containing 10 mM NaCl.
DNase I Footprinting: Electrophoresis and Quantitation by Storage Phosphor Imaging
Bovine pancreatic deoxyribonuclease I (DNase I, Sigma Chemical Co.) was stored as a 7200 units/mL solution in 20 mM NaCl, 2 mM MgCL2, 2 mM MnCl2, pH 8.0. The stock solutions of DNase I was kept at −20°C and freshly diluted to the desired concentration immediately prior to use. Footprinting experiments were performed essentially as previously described (11, 32). Briefly, reactions were conducted in a total volume of 10 μl. Samples (3 μl) of the labeled DNA fragments were incubated with 5 μl of the buffered solution containing the ligand at appropriate concentration. After 30 min incubation at 37 °C to ensure equilibration of the binding reaction, the digestion was initiated by the addition of 2 μl of a DNase I solution whose concentration was adjusted to yield a final enzyme concentration of about 0.01 unit/ml in the reaction mixture. After 3 min, the reaction was stopped by freeze drying. Samples were lyophilized and resuspended in 5 μl of an 80% formamide solution containing tracking dyes. The DNA samples were then heated at 90 °C for 4 min and chilled in ice for 4 min prior to electrophoresis. DNA cleavage products were resolved by polyacrylamide gel electrophoresis under denaturting conditions (0.3 mm thick, 8% acrylamide containing 8 M urea). After electrophoresis (about 2.5 hours at 60 Watts, 1600 V in Tris-Borate-EDTA buffered solution, BRL sequencer model S2), gels were soaked in 10% acetic acid for 10 min, transferred to Whatman 3MM paper, and dried under vacuum at 80 °C. A Molecular Dynamics 425E PhosphorImager was used to collect data from the storage screens exposed to dried gels overnight at room temperature. Baseline-corrected scans were analyzed by integrating all the densities between two selected boundaries using ImageQuant version 3.3 software. Each resolved band was assigned to a particular bond within the DNA fragments by comparison of its position relative to sequencing standards generated by treatment of the DNA with dimethylsulphate followed by piperidine-induced cleavage at the modified guanine bases in DNA (G-track).
Fluorescence Intercalator Displacement Analyses
A DNA library of 136 different oligonucleotide hairpins was purchased from Trilink Biotechnologies, Inc. as individual lyophilized solids. Concentrations of the hairpin deoxyoligonucleotides were determined by the method described by Boger (33, 34) using UV at 90 °C and single-strand extinction coefficients to ensure accurate concentration determination. To carry out the assay, each well of a Costar black 96-well plate was loaded with Tris buffer containing ethidium bromide and one hairpin deoxyoligonucleotide of the library. Typical final concentrations in each well were 1.5 μM DNA-hairpin, 4.5 μM EtBr, and 0.75–3 μM of DNA binding agent. The final buffer consisted of 10 mM Tris, pH 8.0, 100 mM NaCl. After incubation at 25 °C for 30 min fluorescence measurements were made (average of three measurements) on each well with a Varian Cary Eclipse fluorescence plate reader (λEx 545 nm, λEm 595 nm). Compound assessments were conducted in triplicate (or more) with each well acting as its own control well (no agent, 100% fluorescence, and no DNA, 0% fluorescence). Fluorescence readings are reported as a percent fluorescence decrease relative to the control wells.
Circular Dichroism (CD)
CD spectra were collected with a Jasco J-810 spectrometer at different ratios of compound to DNA at 25 ºC in MES 10 buffer. A DNA solution in a 1-cm quartz cuvette was first scanned over a desired wavelength range. The compounds at increasing ratios were then titrated into the same cuvette and the complexes rescanned under same conditions.
Thermal Melting (Tm)
Tm experiments were conducted with a Cary 300 UV-Visible spectrophotometer in 1-cm quartz cuvettes. The absorbance of the DNA-compound complex was monitored at 260 nm as a function of temperature and DNA without compound was used as a control. Cuvettes were mounted in a thermal block and the solution temperatures were monitored by a thermistor in a reference cuvette with a heating rate of 0.5 °C/min. The concentration of DNA was determined by measuring the absorbance at 260nm. A ratio of 1:1 compound to DNA oligomer duplex was used for the complex or a ratio of 0.6 compound/DNA base pairs with the polymer. Higher ratios did not result in any significant Tm increase.
Calculated Equilibrium Geometry
The equilibrium geometry of RT29 when not bound to DNA was obtained by full geometry optimization at both the Hartree-Foch (HF) and density functional (B3LYP) levels with a series of basis sets (6–31G(d,p) and higher). All quantum chemical calculations were carried out with the Spartan04 software package.
Calculated Solvent Accessible Surface Areas
Solvent accessible surface areas (SASA) of the RT29-DNA complex (2FJV.pdb) were calculated using NACCESS V2.1.1. This program outlines the accessible surface of a molecule using a path generated by the center of a 1.4 Å radius-probe rolled around the Van der Waal’s surface of the molecule based on the Lee & Richards method (35, 36). The surface area is calculated by slicing the three-dimensional molecular volume to determine the accessible surface of individual atoms. SASAs for unbound DNA and RT29 were calculated using only the coordinates for DNA or RT29, respectively. ΔSASAtotal = SASAcomplex – (SASAfree DNA + SASAfree RT29).
Biosensor - Surface Plasmon Resonance (SPR)
Biosensor-SPR experiments were conducted with BIAcore 2000 or 3000 (Biacore, Uppsala, Sweden) instruments. 5′-Biotin labeled DNA hairpins were immobilized on streptavidin-linked sensor chips via non-covalent capture. For kinetics experiments a Biacore CM4 chip, which has lower degree of carboxymethylation (relative to the standard CM5 chips), was used. Streptavidin was linked to this chip by standard amine coupling chemistry (1800 RU) and biotinylated DNA was captured on the chip surface. The tight affinity between biotin and streptavidin yields a highly stable surface over time, allowing for regeneration with relatively harsh conditions. After washing the chip with 1M NaCl/50mMNaOH and buffer to remove unlinked streptavidin, a 25 nM DNA of selected sequence was manually injected over each streptavidin derivatized flow cell at a flow rate of 2 μl/min until the desired amount of each DNA sequence (RU) was immobilized. Three flow cells contained DNA and one flow cell was left blank as a reference.
The compounds at different diluted concentrations in degassed and filtered Tris buffer with 0.005% surfactant P-20 were injected over the DNA surface for a selected time. A 10 mM glycine solution at pH 2.0 was used for regeneration. Steady-state binding studies were carried out by averaging the resonance unit values (RU) over a selected time region at different compound concentrations and converting them to r (moles of bound compound per mole of DNA hairpin), r = RU eq/RUmax, where RUeq is the averaged RU at steady state for each concentration and RUmax is the maximum RU value for binding one compound per binding site. The binding constant, Ka, was obtained from the best fit of r versus free compound concentration (Cfree) with a one site binding model:
| (1) |
Fits with more than one site did not improve the correlation coefficient or residuals significantly for RT29. Analysis of kinetics results was performed by global fitting of the binding data with mass transport limited binding models (37, 38). Equations (2) and (3) are standard 1:1 kinetics models, while in a mass transport limitation model, equations (2), (3), (4) and (5) are used:
| (2) |
| (3a) |
| (3b) |
| (4) |
| (5) |
where [A] and [Abulk] are the concentrations of the compound at the sensor surface and in the bulk solution, respectively, [B] or c[RUmax-RU] is the concentration of the DNA, and [AB] or cRU is the concentration of the complex, cRUmax is the response at saturation of binding sites, ka is the association rate constant, kd is the dissociation rate constant and c is a proportionality constant that relates RU to concentration. The c constant allows conversion of eq. 3a to 3b and direct use of the response to determine kinetics constants. Global fitting of entire sensorgrams at all concentrations was used to determine the kinetics constants.
Isothermal Titration Calorimetry (ITC)
ITC experiments were performed with a MicroCal VP-ITC (MicroCal Inc., Northampton, MA, USA) interfaced with a computer equipped with VP-2000 viewer instrument control software and Origin software for data analysis. In ITC experiments 10μl of compound in cacodylic buffer was injected into the sample cell containing DNA duplexes in the same buffer. The observed heat for each injection was measured by integration of the peak areas with respect to time. Blank titrations with no DNA were conducted by injecting the compound into the sample cell containing only buffer under the same conditions. The corrected interaction heat was determined by subtracting the blank heats from those in the compound/DNA titrations.
RESULTS
DNaseI Footprinting Studies: Establish the Binding Sites in Natural DNA
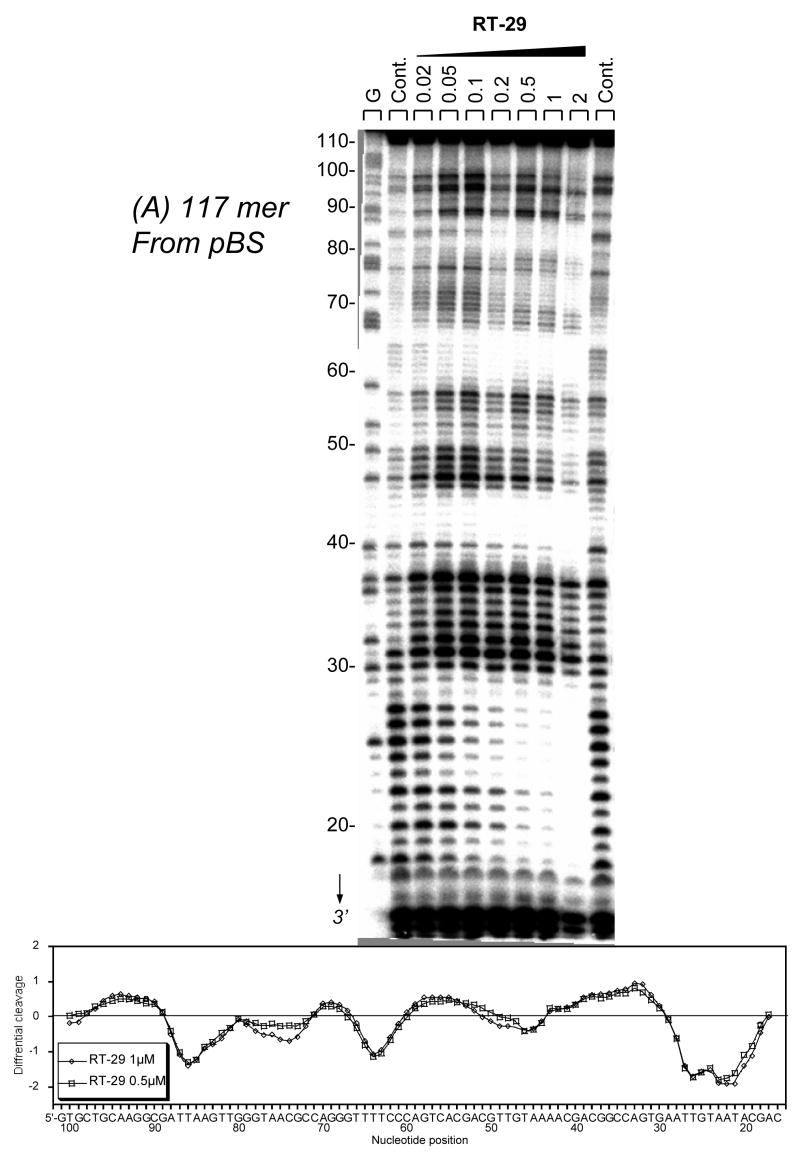
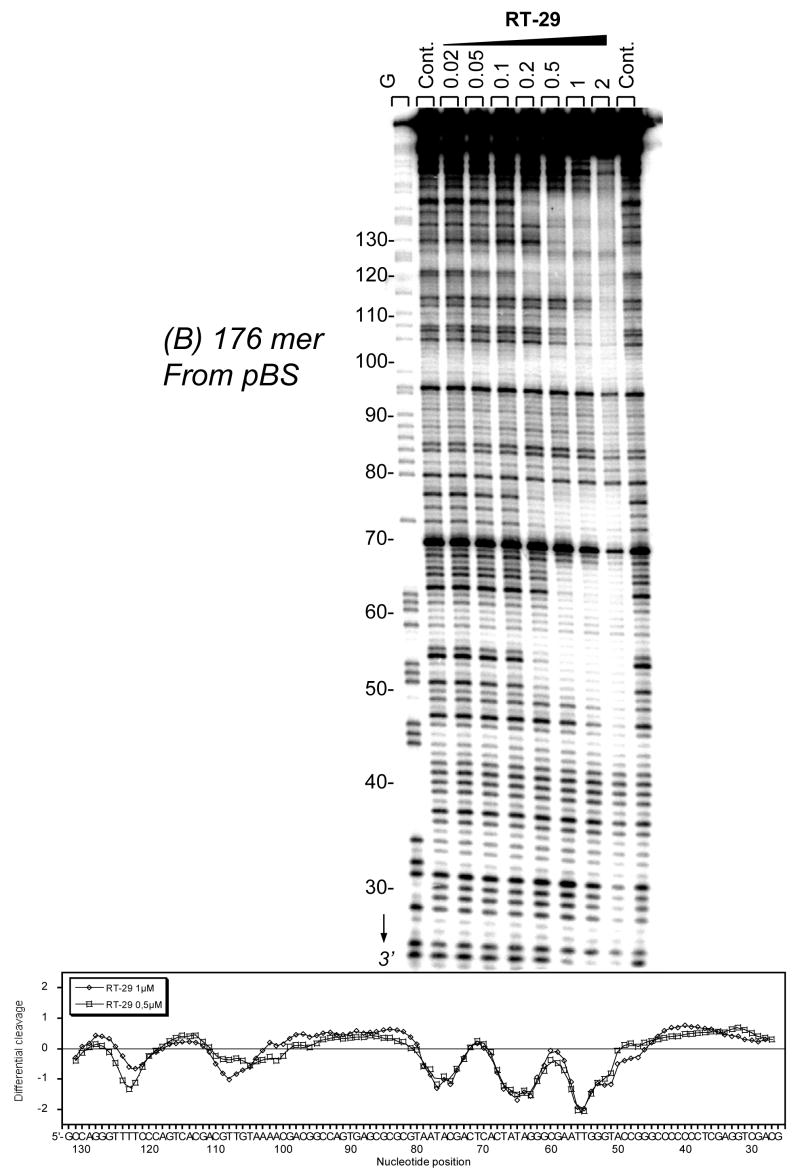
DNase I footprinting results for RT29 (Figure 2a,b) indicate that the diamidine binds extremely tightly to specific AT rich sequences of DNA to produce pronounced footprints within the 117-bp and the 176-bp restriction fragments used for these experiments. For the 117-bp fragment, footprints centered on nucleotide positions 20–30 correspond to compound binding to juxtaposed AT sequences with a single separating GC base pair: 5′-AATTGTAATA. Sites around position 42, 5′-TAAAA, 63, 5′-TTTT, and 85, 5′-ATTAA, have similar, strong footprints. Interestingly, a protected site around position 74 contains only three consecutive A•T bp, 5′-TAAC. This finding agrees with ethidium displacement results (below) that indicate significant binding by RT29 to some sites with three consecutive AT base pairs and a 5′ or 3′ GC base pair. Footprinting results for the DNA fragment of 176-bp (Figure 2b) confirm that RT29 binds very strongly to AT DNA sequences and particularly strong to AATT. All of the footprinting results show that RT29 has a strong binding preference for sites with four or more AT base pairs but with some tolerance for specific sites with three AT and a terminal GC base pair.
Figure 2.
(A). DNase I footprinting for RT29 bound to the 3′-end radiolabeled 117-bp restriction fragment from pBS and (B) 176-bp restriction fragment from pTUC. The cleavage products from the DNase I digestion were resolved on an 8% polyacrylamide gel containing 8M urea. The concentration (μM) of the drug is shown at the top of the appropriate gel lanes. Control tracks labeled “Ct” contained no drug. The track labeled G represents dimethylsulphate-piperidine markers specific for guanine. Numbering of the sequence is shown at the left side of the gels. Densitometer traces with sequence numbering are shown below the gel results.
Fluorescence Intercalator Displacement (FID): Analysis of RT-29 Site-Selectivity
Although DNase I footprinting can scan long DNA sequences, it does not have nucleotide resolving power and we have thus turned to the FID method to investigate specific sequences in greater detail. Previous analyses of the sequence selectivity of RT29 via ethidium displacement (using an oligonucleotide library containing all possible four base pair sequences) indicated that RT29 interacted preferentially with DNA sites containing four contiguous A/T base pairs (such as AATT and ATTA) and also with sites that have three AT base pairs followed by a C or G base pair (30) (Figure 3a); the site of this latter type preferred by RT-29 was determined to be ATTC. Interestingly, distinct from the behavior of netropsin in this assay (33, 34, 39), which clearly revealed a preference for four A/T base pair sites only, RT-29 revealed that four A/T-base pair sites where interspersed among the similarly preferred three A/T base pair sites in the rank order (Figure 3). While the footprinting results for RT-29 described earlier provide support for this finding, through the footprint observed at the TAAC site in the 117 base pair fragment, an ATTC site was absent in the sequences used in the footprinting experiments and those sequences contain few (A/T)3-G/C sites. A histogram of the FID results for analysis of all possible four base pair (A/T)3-G/C sites is shown in Figure 3 including the four A/T base pair sites for comparison. As noted previously, the strongest (A/T)3-G/C site contained the sequence ATTC and, like the behavior of other A/T-rich DNA targeted molecules, none of the highest-ranked sequences with three AT base pairs preferred by RT-29 have a 5′-TA-3′ step; sites containing TpA steps appear only within the lower half of the rank ordered sites among this group of oligonucleotide targets.
Figure 3.
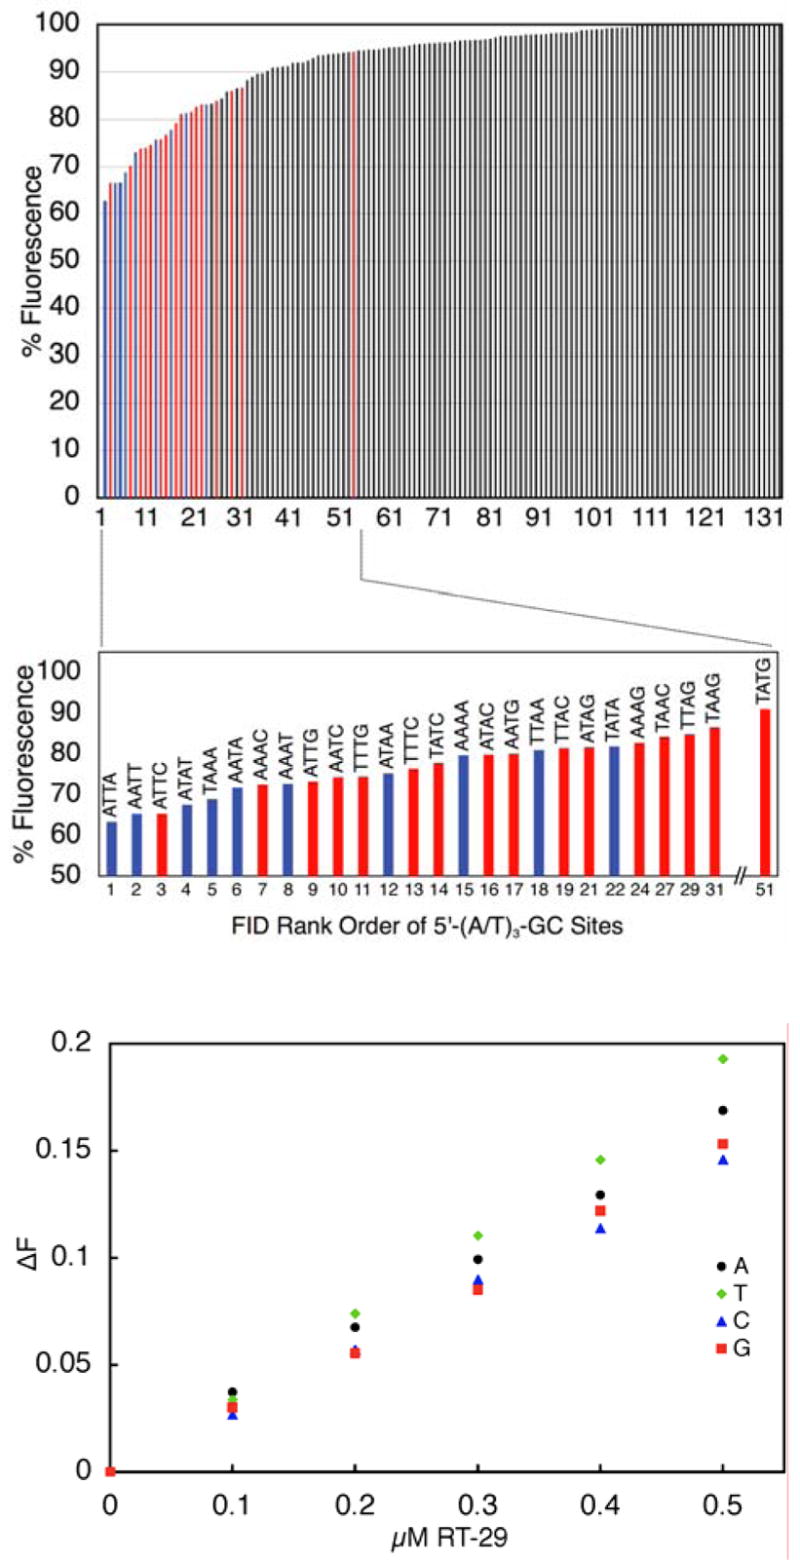
(A). FID analysis of RT −29 (0.75 μM) binding to all possible four base-pair DNA sequences (upper panel) emphasizing the overall rank and relative rank order of sites containing three contiguous A/T base pairs flanked by one G/C base pair [5′-(A/T)3-G/C sites]. Also illustrated is a comparison of the binding of RT-29 to the four possible 5′-ATTC-N sites (lower panel). The merged-bar FID analysis histogram in the upper panel is color-coded such that four base pair A/T-only DNA cassettes are blue [5′-(A/T)4 sites] while those containing 5′-(A/T)3-G/C sites are red; all other sites are black. (B) The plot shown illustrates the change in F (decrease) that occurs as ethidium bromide is displaced from oligonucleotides containing 5′-ATTC-N sites as a function of increasing RT-29 concentration; these data suggest that RT-29 exhibits a slight preference for 5′-ATTC-T sites (T > A > G > C).
Along with our examination of (A/T)3-G/C sites in general, we also examined details of the RT-29 interaction with the favored ATTC type of sites. Our x-ray structural analysis of RT-29 bound to ATTC determined that RT-29 interacts with this particular site, in part, through the formation of a water-mediated hydrogen bond between the RT29 benzamidine moiety and the nucleobase present at the 3′-flank of the ATTC site, i.e., to the N in ATTCN (30). While the observation of a water-mediated interaction suggests that the identity of the nucleobase present at N should not strongly influence RT-29 binding, direct evidence to support this notion was not available. To probe the ability of RT-29 to target the ATTC site in greater detail, the FID method was used further to investigate the influence of ATTC flanking sequences contained in oligonucleotide sequences of the type 5′-ATTCN- (where N is A, T, C, G in a hairpin duplex of the type previously used). All complexes formed were found to have a 1:1 RT29 to duplex stoichiometry (data not shown) and sites with N = T or A (T > A) exhibited slightly stronger binding to RT-29 in comparison to those with N = G or C within the drug concentration range 0–0.5 μM (Figure 3). These results indicate that, as expected based on the observed water-mediated interactions, all ATTC-like binding sites have similar affinity for RT29 with little flanking sequence influence. These observations further suggest that the overall groove width of ATTC sites, and perhaps 5′-(A/T)3-(G/C) in general, influences binding to an extent greater than specific intermolecular interactions.
Circular Dichroism: Probe the Binding Mode in Solution
CD spectra of the diamidine on titration into a solution of a DNA oligomer with an -AATT- sequence were monitored from 220nm to 400nm. At the maximum absorption wavelength of the compound, where the DNA CD signals do not interfere, positive induced CD signals were observed around 325nm (Figure 4). RT29 has no intrinsic CD signals and these signals are for the bound compound. Such positive induced CD signals are generally a characteristic of binding in the minor groove of DNA (40, 41) as observed for other diamidines. In summary, CD results indicate that RT29 binds in the DNA minor groove in AT sequences in solution in spite of the pronounced molecular twist in the RT29 diphenyl ether system.
Figure 4.
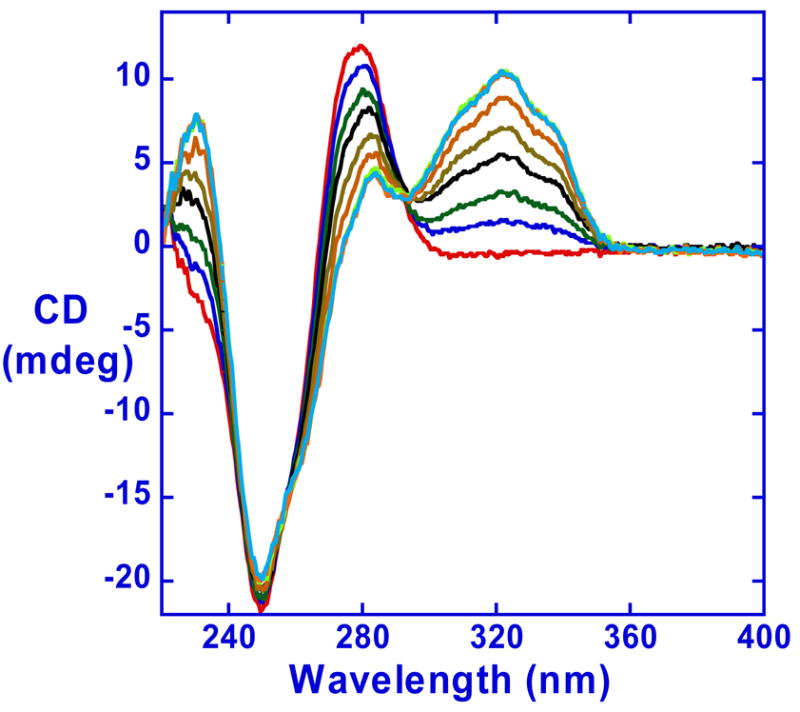
Induced CD signals for RT29 with the d(CGCGAATTCGCG)2 duplex in MES 10 buffer at 25°C. Molar ratios of compound to DNA duplex are 0, 0.2, 0.4, 0.6, 0.8, 1.0, 1.2, 1.5 from the bottom to the top at the induced CD wavelength maximum near 320nm.
RT29-DNA Thermal Melting Studies: Relative Binding Affinity
Thermal melting studies with polydA.polydT serve as a qualitative screen for compound binding affinity to AT sequences (42). ΔTm values (Tm of the DNA complex - the Tm for DNA) for RT29 with polydA.polydT were compared to the value for DB75 (ΔTm = 24.8 °C; the error in ΔTm values is ±0.5 °C) under the same conditions. Surprisingly for the highly twisted RT29, the binding is so strong that the DNA complex melts above 95 ºC and no transition could be observed (ΔTm > 28 °C). Tm studies were also done with a DNA hairpin duplex containing a single -AATTAA- site, the same sequence as in the crystallographic analysis. The oligomer Tm is 61.2 °C and at a 1:1 ratio of RT29 the Tm increases to 75.4 °C while at a 2:1 ratio the Tm increases only to 76.2 °C. This result indicates that RT29 binds to the oligomer duplex in a 1:1 complex as expected from the designed sequence, and that it binds to DNA significantly more strongly than the classically shaped minor groove agent, DB75.
Biosensor-Surface Plasmon Resonance (SPR): Quantitative Binding Affinity and Stoichiometry
In order to quantitatively evaluate the DNA interactions of RT29, SPR experiments were conducted with hairpin duplexes containing the sequences -AATT-, which has been used in studies of many minor groove binding compounds and which had the strongest RT29 affinity in FID experiments, -AATTAA- (the same as used in the Tm and crystal structure studies), as well as an alternating GC base pair sequence as a control. Because the SPR approach responds to mass, it can be used in comparative studies for diamidines that have very large differences in properties and equilibrium binding constants, K as well as weak spectral signals. In many cases rates for the binding can be observed in real time as the SPR signal increases with compound-DNA complex formation. A number of detailed and extensive comparative studies have conclusively shown that carefully conducted biosensor-SPR studies provide equivalent results to solution methods (37, 38, 43–46).
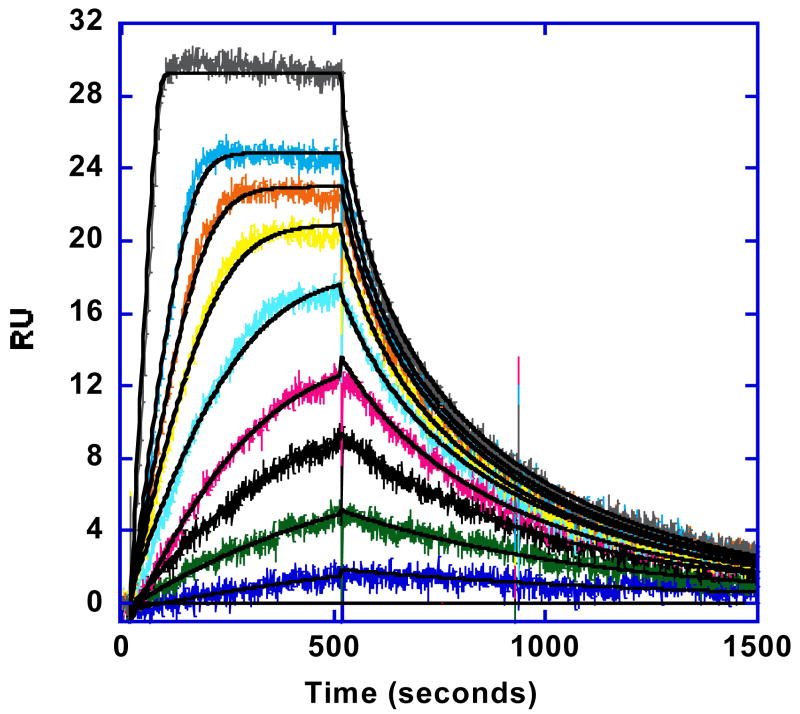
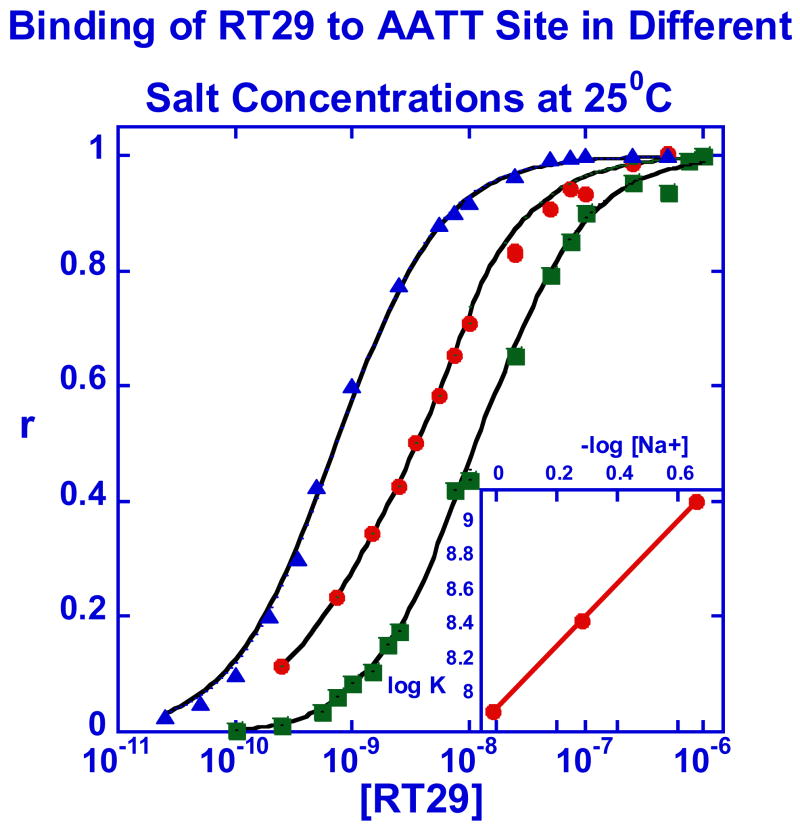
In agreement with the DNaseI footprinting and FID results, the observed binding of RT29 to the two hairpin AT sequences is quite strong while no significant binding could be detected to the GC sequence at concentrations that saturated the AT binding sites. The binding of RT29 to the AATT (Figures 5a) and AATTAA hairpins is very similar under the experimental conditions (Table 1). Because of the strong binding, low concentrations were required to obtain a mix of free and bound DNA sites and at the lowest concentrations, a steady state region was not reached in the 500 second maximum, volume limited, flow time for the experimental conditions (Figure 5a). Since the observed association rate is a mix of bimolecular complex formation and mass transfer (eq. 4), the observed rate increases with increasing concentration of RT29 in the flow solution. A steady state plateau was obtained at the higher concentrations. The observed dissociation rate is also quite slow and is not complete in 1000 sec, even at 0.5M salt concentration. As can be seen in Figure 5b, the compound binding sites are essentially saturated at RT29 concentrations above 25 nM at 0.2 M NaCl. The concentration required for saturation binding increases with increasing salt concentration (Figure 5b).
Figure 5.
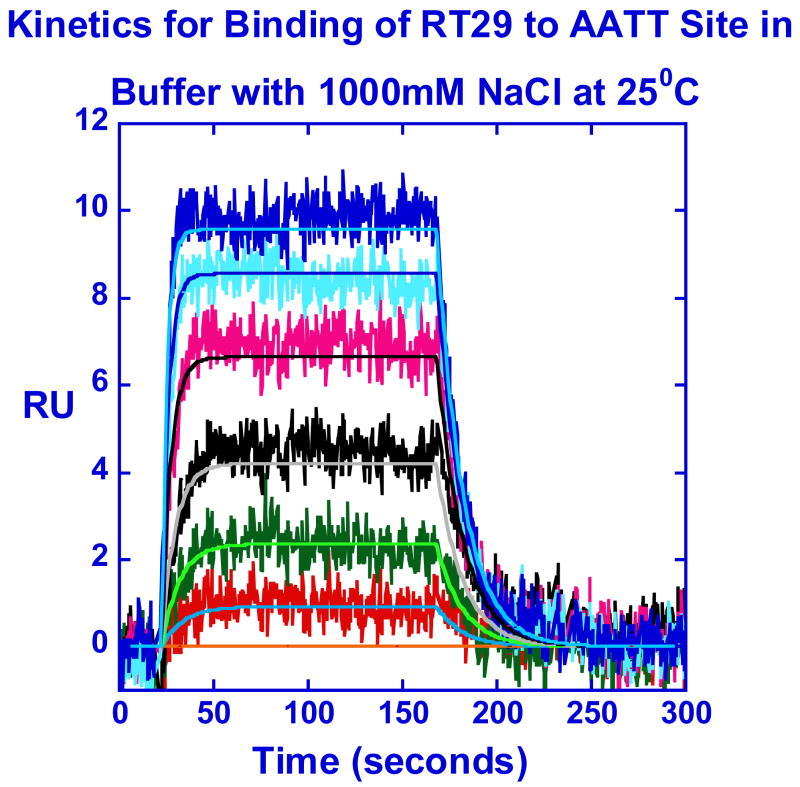
(A). SPR sensorgrams for binding of RT29 with AATT in Tris50 buffer at 25°C. The smooth black lines are best fit curves by global kinetics fitting as described in the text. For RT29, the concentrations from bottom to top are 0, 0.25, 0.75, 1.5, 2.5, 3.5, 5.5, 7.5, 10 and 20nM. (B) Binding results for RT29 with the AATT hairpin sequence (Figure 1) at different salt concentrations 0.2 (▲), 0.5 (•), and 1.0 (■) M NaCl) at 25 ºC. The inset shows the linear relation of log K to –log [Na+] which gives a slope of 1.8. (C) SPR sensorgrams for the binding kinetics of RT29 with AATT in Tris100 buffer at 25 ºC and a flow rate of 100μl/min on a low density C4-streptavidin chip. The black lines are best fit curves by global kinetics fitting. The RT29 concentrations from bottom to top are 0, 2.5, 5.5 10, 20, 30, and 40 nM.
Table 1.
Binding and kinetics result of RT29 binding to AATT and AATTAA sites at 25°C
| DNA | [Na+]mM | ka (1/Ms) | kd (1/s) | K(M−1) |
|---|---|---|---|---|
| AATT | 200 | MTa | MT | 1.4×10⁹ |
| 500 | MT | MT | 2.7×10⁸ | |
| 1000 | 6.88×10⁶ | 0.072 | 9.6×10⁷ | |
| AATTAA | 200 | MT | MT | 1.6×10⁹ |
| 500 | MT | MT | 2.5×10⁸ | |
| 1000 | 2.35×10⁶ | 0.026 | 9.2×10⁷ |
MT is mass transfer dominated binding rates
To evaluate the binding equilibrium constants, K, the experimental sensorgrams were quantitatively evaluated by fitting with a 1:1 global kinetics analysis model that included a mass transport limitation term (Materials and Methods). The results clearly show that the binding rate of RT29 to DNA under these conditions is dominated by the transport of RT29 molecules between the flow solution and the sensor surface with immobilized DNA. Given the rapid association of RT29 with the minor groove in AT sequences and the very low concentrations used in the experiments due to the strong binding of RT29, this is an expected observation (47). The apparent kinetics results also increase with an increase in the flow rate, a signature characteristic of mass transport influenced rates. The calculated ratios of ka*RUmax/kt are higher than 5 under these conditions, providing further evidence for mass transport limited binding. A ratio of less than 5 has been shown to be important for obtaining reliable kinetic data (38). True reaction kinetics results could thus not be determined for the RT29-DNA complex under these conditions (0.2 and 0.5M Na+ at 25°C), however, the equilibrium binding constant at 0.2M salt, K = 1.4 × 10⁹ M−1 (experimental error of ±20%), obtained from the global fit approach is valid (38, 47), as long as most of the observed association and dissociation rate data can be collected in the experimental time period. The fitting procedure allows the determination of equilibrium constants since mass transfer affects both the association and dissociation reactions and K can thus be determined from mass transfer limited apparent rate constants. The binding constant obtained from more limited steady state results at the highest concentrations is in good agreement with the K from kinetics analysis. The binding constant obtained for RT29 is higher than other minor groove binding dications of similar size and charge.
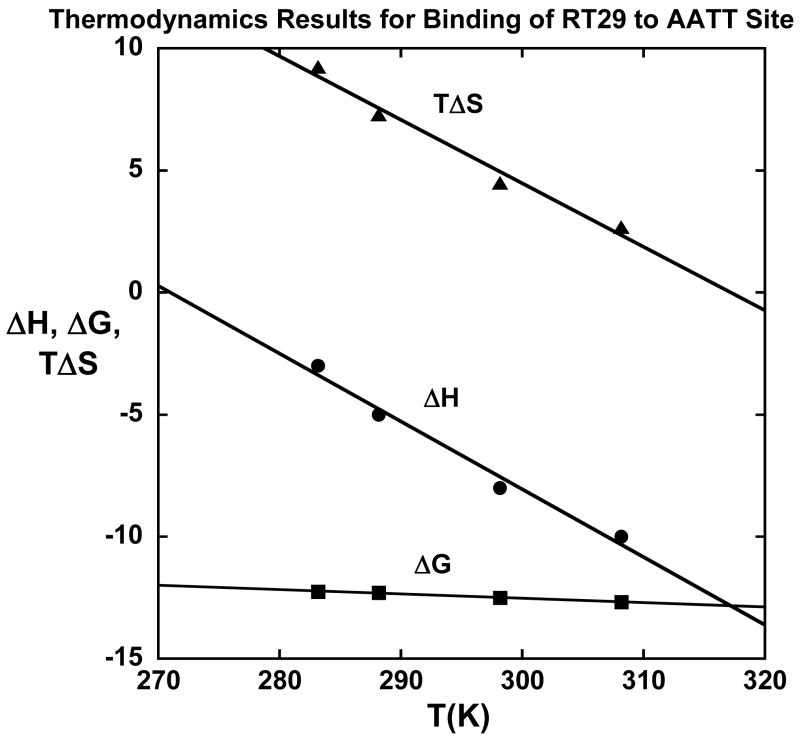
To better understand the energetic details of the RT29-DNA complex, binding studies were conducted as a function of salt concentration and temperature. A slope of 1.8 was obtained in a plot of log K versus –log Na+ and this indicates that both cationic amidines of RT29 are electrostatically interacting with the DNA duplex (Figure 5b). ΔG for binding changes very little over the experimental temperature range (Figure 6) in agreement with observations on other minor groove binding agents (27, 29, 48). In summary, the SPR results show that RT29, in spite of its unusual structure, binds very tightly to AT sequences of four or more AT base pairs in a 1:1 complex, but that it binds very weakly to sites composed of GC base pairs. For its size RT29 is one of the strongest DNA binding agents found to date.
Figure 6.
Thermodynamics results, ΔG from SPR, ΔH from ITC, and –TΔS (calculated from ΔG = ΔH –TΔS), for binding of RT29 to the AATT site (Figure 1) at different temperatures.
As described above, the interaction kinetics of RT29 with DNA at salt concentrations up to 0.5M NaCl have significant mass transport influence. Binding kinetics of RT29 to the AATT site at 1M NaCl salt concentration with a lower density of DNA on a CM4 chip are not significantly mass transport limited (Table 1,(38)) As the K value decreases at higher salt concentration, the association (ka) rate constant decreases and the mass transfer influence decreases to zero on lower density DNA surfaces. The ka and dissociation (kd) rate constants as well as the K value (Table 1 and Figure 5c) obtained from global fits are consistent with non-mass-transport limited binding kinetics at 1M salt concentration. Similar kinetics experiments were conducted with the AATTAA sequence (Figure S1 and Table 1) and the results are similar to those obtained with AATT site.
Isothermal titration calorimetry (ITC): Detailed Thermodynamics of the RT29-DNA Interaction
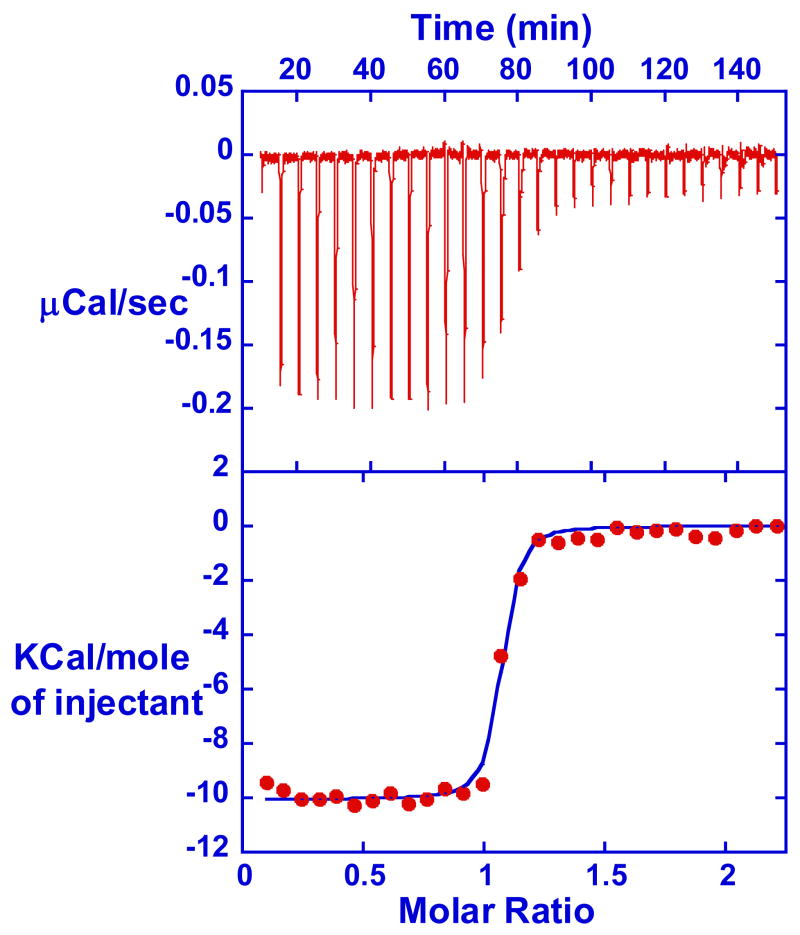
ITC experiments with an AATT sequence oligomer were conducted to obtain a full thermodynamic understanding of the exceptionally strong binding of RT29 (27, 29, 48–50). Titration of RT29 into buffer and into a DNA solution provided plots of heat/mol versus molar ratio by subtracting the integrated peak areas for the buffer titration from the DNA interaction titration (an example titration is in Figure 7). Due to the large K value for RT29 binding to DNA, only the binding enthalpy, ΔH, could be obtained in the ITC experiments. For molar ratios of less than approximately 0.9, the observed heat/mol is constant and equal to ΔH since essentially all of the added compound binds to DNA in the calorimeter under these conditions. The results were fit to a single site binding model and the observed ΔH value for binding is −8.0 ± 0.1 kcal/mol RT29 at 25 ºC. The calculated −T·ΔS values (−4.5 kcal/mol at 25 ºC) are based on SPR binding free energies (ΔG° =-RTlnK = −12.5 kcal/mol at 25 ºC) and ΔH from ITC (Figures 6, 7). These results clearly show that the strong binding of RT29 at 25 °C and above is dominated by a favorable binding enthalpy. This is in contrast to many diamidine derivatives and other minor groove binding agents for which the binding to AT sequences is entropy driven (25, 48, 50). ITC and SPR experiments were also conducted with the -AATTAA- sequence DNA used in crystallization (Figure S2). The observed binding enthalpy is −7.4 kcal/mol and the calculated -T·ΔS is −5.3 kcal/mol at 25ºC. Thus, the RT29 interaction with both AT DNAs is principally driven by the interaction enthalpy term.
Figure 7.
The upper panel is an ITC curve for titration of RT29 (0.050mM) into 0.005mM d(GCGAATTCGC)2 duplex (CAC20 buffer with 200mM NaCl) at 35 ºC. The integrated, blank subtracted heat are plotted versus molar ratio in the lower panel.
Footprinting results described above as well as previous fluorescence intercalator displacement (FID) studies (30) have shown that RT29 can bind to DNA sequences with three consecutive AT base pairs and a single GC base pair. To compare this type of interaction with that for pure AT sites, ITC experiments with a hairpin oligomer sequence, 5′-CGATTCCGTCTCCGAATCG-3′, with a -ATTC- binding site (in bold with the hairpin loop sequence underlined) which was previously used in SPR studies (30), were conducted (Figure S3). These studies provide a thermodynamic understanding of the differences in RT29 interactions with AT sites containing three or four AT base pairs. The experiments with -ATTC-were conducted as with -AATT- and the observed ΔH value for RT29 binding at 25ºC is −6.2 ± 0.07 kcal/mol. The calculated -T·ΔS value at 25 ºC for binding to -ATTC-, based on the SPR binding free energies (ΔG° =-RTlnK = −10.4 kcal/mol) (2) and ΔH from ITC, is −4.2 kcal/mol. These results again show that the binding of RT29 to DNA with three or four AT base pairs is dominated by the enthalpy term at 25 °C. The stronger binding to AATT, relative to ATTC, is entirely due to a more favorable binding enthalpy with the AATT site (−8 kcal/mol vs −6.2 kcal/mole).
Molecular Structural Comparisons and Models: Calculations and Crystallography
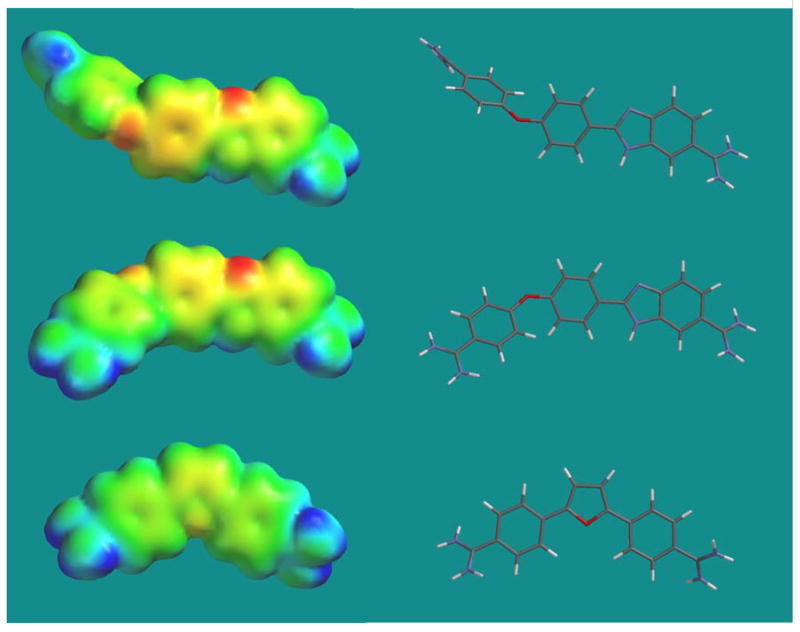
A geometry optimized structure for RT29 is shown in Figure 8 along with a model of RT29 with the coordinates from the crystal complex with DNA (30). An optimized structure for DB75 is also shown to allow comparison with a compound that has a more standard minor groove binding shape (17). The structures were calculated by quantum methods at both the HF and B3LYP levels (Materials and Methods) with different basis sets. The basis set level that was used in both cases had a small effect on the final torsional angles in RT29. The structure calculated by DFT methods has slightly smaller predicted torsional angles for all angles joining the benzimidazole, phenyl and amidine systems than found in the HF calculations. In the calculated structures for both RT29 and DB75 the amidine-aromatic ring torsional angles are 35 – 40º. The benzimidazole-amidine angle in the RT29 crystal structure is similar, but the phenyl-amidine angle is reduced to near 0° (Figure 8). The benzimidazole-phenyl angle in both the calculated and crystal structures of RT29 is near 0°. These results indicate that the amidine-benzimidazole-phenyl end of RT29 does not undergo significant structural changes on forming the -AATT-minor groove complex. The amidine-phenyl-O-phenyl end of RT29, on the other hand, undergoes considerable structural change on complex formation.
Figure 8.
Equilibrium geometries of RT29 (top) and DB75 (bottom) were calculated by the density functional method at the 631G(p, d) level. Tube models are shown at right with space filling electrostatic potential molecular surfaces on the left. The middle structure is RT29 in the conformation observed in the crystal complex. The crystal conformation was frozen in the calculations for comparison to the unconstrained minimum energy conformations of RT29 and DB75. A can be seen, there is a very significant difference between the equilibrium, unbound and bound conformations of RT29. Note that the bound conformation of RT29 is much closer to that for DB75 and other similar minor groove binding compounds.
There is a dramatic difference in structure between DB75 and RT29 that can also be seen from the comparisons in Figure 8. The aromatic system of DB75 has the classical curvature of DNA minor groove binding compounds with a relatively planar phenyl-furan-phenyl aromatic system while the diphenylether of RT29 is highly curved and twisted. The twist is especially significant relative to the width of the minor groove and in the equilibrium conformation, the compound can not slide deeply into the groove. The x-ray results, however, show that the angle between the phenyl planes of 62° in the calculated, unbound structure is reduced to 35° in the bound form (Figure 8, 9). It is this decrease in twist that makes it possible for RT29 to slide into the minor groove. The reduction in twist is largely made possible by an increase in the phe-O-phe bond angle. The bond angle is 126° in the unbound molecule but is 136° in the complex with DNA. This slight opening of the bond angle makes it possible for the reduction in phe-O-phe twist to occur without extensive atom-atom steric clash.
Figure 9.
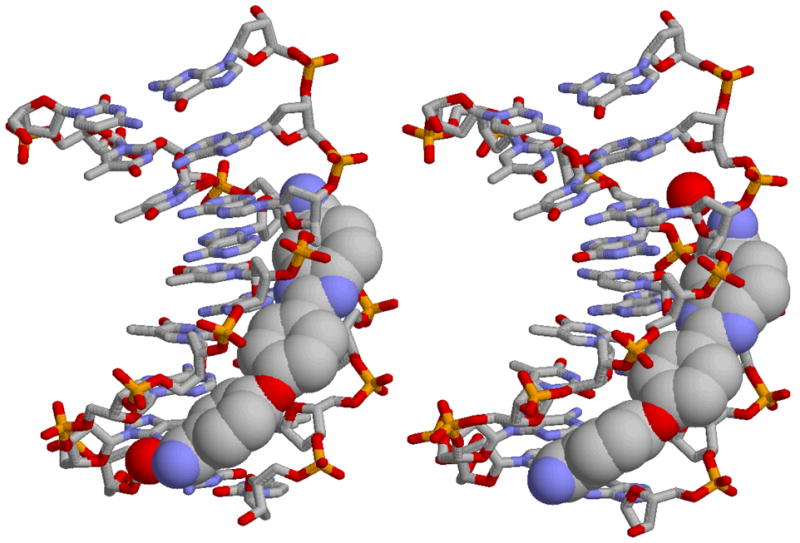
Crystal structures for RT 29 bound in the minor groove of an AATT (left) and ATTC site (right) are shown. The water molecules that complete the complexes are shown as red spheres. The water is at the bottom, phenylamidine group, in the AATT complex and at the top, benzimidazole amidine group, in the ATTC complex.
The induced structure of RT29 that is bound to DNA also has an impressively optimized electrostatic potential molecular surface for DNA interactions (Figure 8). The inner face of the molecule in the bound conformation contains the benzimidazole and amidine -NH groups with a significant positive potential. The opposite face with the unprotonated benzimidazole N and the ether oxygen, which faces out into the solvent, is significantly more negatively charged and does not have H-bond donating groups. This is an advantage for both formation of H-bonds with the AT base pairs at the floor of the DNA minor groove and for electrostatic interactions. The interaction of RT29 with DNA is thus similar to the folding-binding reaction that many proteins undergo on complex formation with DNA and the induced conformational change places the functional groups of RT29 in closely optimized positions for interaction with DNA (Figure 9).
Various methods have been proposed to calculate binding heat capacities for nucleic acid complexes based on the amount of polar and nonpolar surface area that is shielded from solvent on complex formation. From the crystal structure of RT29 bound at the AATT site, the amount of buried polar and nonpolar surface area can be determined and the values are collected in Table 2. Record and coworkers (51), based on protein folding and small molecule transfer to water, and Chaires and coworkers (52) based on small molecules binding to DNA, have determined equations to correlate buried surface areas with ΔCp. The Record equation predicts a heat capacity of −128 cal/mol K and the Chaires equation predicts ΔCp = −165 cal/mol K for RT29 binding to the AATT site. Both predictions are substantially below the experimental value of −278 cal/mol deg for the AATT complex that is determined from the slope of ΔH versus temperature in Figure 6.
Table 2.
Solvent accessible surface areas of d(CTTAATTC)2 and RT29 calculated using NACCESS
| Nonpolar Area (Å2) | Polar Area (Å2) | Total Area (Å2) | |
|---|---|---|---|
| Complex | 1403.7 | 1715.4 | 3119.1 |
| Bound DNA | 1284.4 | 1629.6 | 2914.0 |
| Bound RT29 | 119.3 | 85.8 | 205.1 |
| Free DNA | 1504.9 | 1734.6 | 3239.5 |
| Free RT29 | 416.6 | 246.7 | 663.3 |
SASAtotal=−783.7 Å2
DISCUSSION
It is important to study the DNA complexes of compounds of unusual structure, such as RT29, in detail in order to better understand the molecular basis for their unexpected ability to recognize DNA. This is especially true for RT29 since it has exceptional DNA binding strength, in addition to a non-standard shape for DNA recognition and can serve as the basis for design of a new class of nonclassical minor groove binders. DNaseI footprinting studies are the method of choice for defining sequence specificity in DNA binding of compounds with binding sites of different length in a long sequence context (11, 32, 53). Several important conclusions arise from the footprinting results (Figure 2): (i) the footprints seen with RT29 always coincide with the position of AT-rich sequence tracts; (ii) the footprints have the 3′-offset expected for footprinting of a minor groove complex, in accord with the model for asymmetric cleavage by DNase I across the minor groove of the B-form helix (53, 54); (iii) RT29 protects AT-rich sequences from cleavage by DNase I more intensely at AATT sites indicating that it exhibits a higher affinity for this DNA sequence; (iv) a less intense footprint is seen at a site with three AT and a terminal GC base pair. These results are complemented and expanded by results from FID experiments which show that AATT is a favored RT29 binding site in four base pair binding sequences (Figure 3). Binding sites that contain TA steps interact with RT29 significantly less strongly than other AT sequences in both footprinting and FID experiments. Similar poor binding to sequences with TA steps has been reported with other minor groove binding agents (55–57). Both DNaseI footprinting and FID as well as SPR studies show that four base pair sites with more than one GC pair bind RT29 too weakly to be detected. DNaseI is a large enzyme and this makes it somewhat difficult to precisely define the exact drug binding site in a footprinting study. In several footprints (Figure 2) a G/C base pair at the 3′ side is protected and this could be correlated with the FID results that support RT29 binding at (A/T)3-G/C sites. The correlation is complicated, however, by the 3′ offset of minor groove footprints and by the size of DNaseI.
X-ray structural results in Figure 9, (30) provide a model for RT29 binding in the minor groove and circular dichroism spectra provide support for a minor groove complex in solution (Figure 4). The strong minor groove binding of RT29 to AATT was unexpected based on the twist and curvature of the compound that is unique for a minor groove binding agent of this size. Similar compounds that are highly curved or twisted bind weakly to DNA (16, 58). In order to better understand the basis for the strong binding of RT29, crystallographic (30) and calculated structures are compared for RT29 in Figure 8. There are significant induced fit changes in conformation of RT29 on complex formation. Even with these changes, however, it is not possible to arrange all of the functional groups, the amidine and benzimidazole -NH, for example, to match the shape of the minor groove and position of DNA receptor groups. To complete the complex requires a bound water molecule that forms an essential part of a ternary complex (Figure 9). Interestingly, the benzimidazole -NH and amidine group of RT29 form direct H-bonds with DNA in the AATT site while the phenylamidine interacts with DNA through a bound water molecule. In the crystal structure with the compound bound at the ATTC sequence the water position shifts to the benzimidazole end of RT29 and the benzimidazole is pushed slightly off of the floor of the minor groove due to the GC base pair and the G-NH2 group in the minor groove in the benzimidazole binding region. As a result, there are no direct H-bonds from RT29 to the DNA bases in the ATTC complex and only indirect H-bonds are formed through the bound water molecule to the bases edges at the floor of the minor groove. The lack of H-bonding certainly helps explain the weaker binding of RT29 to the ATTC sequence. Bound water molecules thus provide a flexible way of linking RT29, and other diamidines, to the floor of the minor groove with a significant increase in Gibbs energy of binding. Interestingly, there are also a number of close contacts between phenyl C-H groups of RT29 and DNA TO2 keto groups in the minor groove that apparently add significant stabilization to the complex (Figure 9).
These interesting and unexpected structural observations raise specific questions that we have addressed in the thermodynamics studies reported here: what is the thermodynamic basis for the exceptionally strong binding of RT29 to AATT sites and how do the thermodynamic driving components for complex formation change when RT29 is bound to a site with only three AT base pairs (ATTC)? The answer to the first question is summarized in the thermodynamic results as a function of temperature (Figure 6). As with all minor groove dications studied in detail to this time, the Gibbs energy of binding changes very little with temperature near 25 °C while the calorimetric enthalpy of binding becomes significantly more negative, more favorable for complex formation, as the temperature is increased. The calculated –T·ΔS value for binding, thus, also becomes more negative, less favorable, as the temperature is increased. Complex formation of RT29 with the AATT site is strongly enthalpy driven at 25 °C and the plot in Figure 6 predicts that the binding reaction become completely enthalpy driven above 45 ºC but completely entropy driven below approximately 0 ºC.
The heat capacity difference between the DNA complex of RT29 and the free species is obtained from the slope of the plot of ΔH versus temperature (Figure 6) and is negative, −278 cal/mol deg for the AATT complex. From the crystal structure of RT29 bound at the AATT site, the amount of buried polar and nonpolar surface area can be calculated (Table 2) and used to estimate ΔCp (51, 52). Predicted values (Table 2) are substantially below the experimental value and this suggests that bound water, particularly the water that is an intrinsic part of the complex, adds significantly to the change in heat capacity on complex formation. Cooper and coworkers (59, 60) have clearly shown that many biopolymer transitions and binding interactions have detailed thermodynamics with the characteristics described above (Figure 6) and that such characteristic thermodynamics values are expected for processes involving numerous weak interactions, particularly those involving changes in bound water, in the overall reaction. They conducted an experimental and theoretical analysis of trisaccharide-protein binding with and without a specifically bound water molecule. Both experiment and theory indicated that for each extra H-bond in the system with water, the binding enthalpy would be approximately −2 kcal/mol larger than for the trisaccharide system without water. The binding heat capacity was found to be approximately −20 cal/mol K larger for the water system and this was within the range of theoretical predictions. An RT29 analog without bound water is not available but we can compare the results to other diamidines that bind without a water.
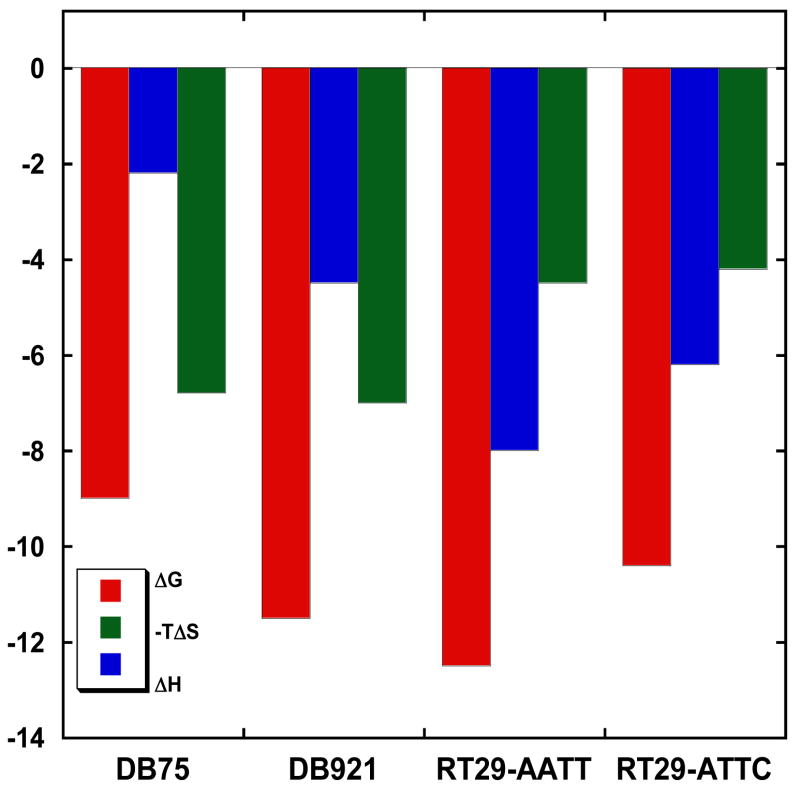
Figure 10 shows a comparison of the binding thermodynamics for the RT29-AATT complex with results for other dicationic minor groove binding agents with the same sequence. DB75, shown in Figures 1 and 8, is a classically shaped minor groove binding agent in which both amidines form H-bonds with DNA bases (61). No water molecule forms an intrinsic part of the interaction between the compound and DNA bases and complex formation is strongly entropy driven at 25 °C. Although there are many interactions in the RT29 complex that are not possible with the DB75 heterocyclic system, the differences in binding enthalpy and heat capacity with the theoretical results described above (59, 60) suggest that at least two water H-bonds must be present in the RT29 complex that are not found in the DB75 complex.
Figure 10.
Comparison of binding thermodynamics for DB75, DB921 and RT29 with an AATT site, and RT29 with an ATTC site at 25 ºC in buffer with 0.2M NaCl.
Thermodynamic results for DB921 (Figure 1), an AT specific minor groove agent that has similar groups to RT29 but with a less twisted and more linear shape, are also shown in Figure 10. DB921 also binds very strongly to DNA and requires a bound water molecule at the phenylamidine end of the molecule in order to H-bond with DNA bases at that end of the molecule (13). Interestingly, it has a different thermodynamic profile than RT29 with a larger entropy component for binding to AATT sites at 25 ºC. These results suggest that RT29 has a more ordered water network system to stabilize its DNA complex than DB921. Such a difference is not apparent in the x-ray structures of the two compound-DNA complexes. What is quite clear is that these two benzimidazole derivatives, with very nonstandard shape for minor groove complex formation, have some of the largest binding constants for molecules of their size. Results for RT29 binding to the ATTC sequence are also shown in Figure 10 and the reduction in binding enthalpy and Gibbs energy are clearly seen in comparison to the AATT results. The lower enthalpy is in agreement with the reduced number of H-bonds in the ATTC complex observed in the crystal structure.
For the therapeutic point, it is essential to design additional compounds that target DNA sequences in different but effective methods. RT29 represents a new paradigm that does not fit the classical model of minor groove interactions. An induced fit molecular structural change in RT29 reduces the twist of the ether group to complement the minor groove, and places the functional groups in position to interact with DNA bases at the floor of the minor groove. The interaction is completed by incorporating a water molecule into the complex, and in the AATT binding site the phenylamidine contacts the bases at the floor of the groove indirectly through a bound molecule of water. The RT29-water pair forms a curved noncovalent minor-groove binding module that matches the shape of the groove. With the ATTC site the water-RT29 interaction again creates a curved minor groove binding adduct that is better able to match the curvature of the groove. These results, along with previous analyses of linear diamidines that bind strongly in the minor groove (Figure 1, (25)), clearly suggest that traditional views of the compound shape required for minor groove complex formation must be reevaluated.
Supplementary Material
SPR data of RT29 binding to AATTAA sequence and ITC data for binding of RT29 to AATTAA and ATTC sequences (Figures S1–S3). This material is available free of charge via the Internet at http://pubs.acs.org.
Footnotes
This work was supported by National Institutes of Health Grants AI064200 (to W.D.W.), GM 62831 (to E.C.L.), and GM055026 (to M.M.G.); by the Bill and Melinda Gates Foundation (to W.D.W. and R.R.T.); and by Ligue Nationale Francaise Contre le Cancer (to C.B.). SPR and ITC instruments were funded in part by the Georgia Research Alliance.
Abbreviations: SPR, surface plasmon resonance; ITC, isothermal titration calorimetry; Tris, Tris(hydroxymethyl)-aminomethane; EtBr, ethidium bromide; FID, fluorescence intercalator displacement; DNaseI, bovine pancreatic deoxyribonuclease I.
References
- 1.Tidwell RR, Boykin DW. Dicationic DNA minor-groove binders as antimicrobial agents. In: Demeunynck M, Bailly C, Wilson WD, editors. DNA and RNA Binders: From Small Molecules to Drugs. WILEY-VCH; Weinheim: 2003. pp. 414–460. [Google Scholar]
- 2.Mathis AM, Holman JL, Sturk LM, Ismail MA, Boykin DW, Tidwell RR, Hall JE. Accumulation and intracellular distribution of antitrypanosomal diamidine compounds DB75 and DB820 in African trypanosomes. Antimicrob Agents Chemother. 2006:2185–2191. doi: 10.1128/AAC.00192-06. [DOI] [PMC free article] [PubMed] [Google Scholar]
- 3.Wilson WD, Nguyen B, Tanious FA, Mathis A, Hall JE, Stephens CE, Boykin DW. Dications that target the DNA minor groove: compound design and preparation, DNA interactions, cellular distribution and biological activity. Curr Med Chem Anti-Canc Agents. 2005;5:389–408. doi: 10.2174/1568011054222319. [DOI] [PubMed] [Google Scholar]
- 4.Neidle S. DNA minor-groove recognition by small molecules. Nat Prod Rep. 2001:291–309. doi: 10.1039/a705982e. [DOI] [PubMed] [Google Scholar]
- 5.Dervan PB, Edelson BS. Recognition of the DNA minor groove by pyrrole-imidazole polyamides. Curr Opin Struct Biol. 2003:284–299. doi: 10.1016/s0959-440x(03)00081-2. [DOI] [PubMed] [Google Scholar]
- 6.Lacy ER, Madsen EM, Lee M, Wilson WD. Polyamide Dimer Stacking in the DNA Minor Groove and Recognition of T.G Mismatched Base Pairs in DNA. In: Demeunynck M, Bailly C, Wilson WD, editors. DNA and RNA Binders: From Small Molecules to Drugs. WILEY-VCH; Weinheim: 2003. pp. 384–413. [Google Scholar]
- 7.Shapiro TA, Englund PT. Selective cleavage of kinetoplast DNA minicircles promoted by antitrypanosomal drugs. Proc Natl Acad Sci U S A. 1990:950–954. doi: 10.1073/pnas.87.3.950. [DOI] [PMC free article] [PubMed] [Google Scholar]
- 8.Woynarowski JM. Targeting critical regions in genomic DNA with AT-specific anticancer drugs. Biochim Biophys Acta. 2002:300–308. doi: 10.1016/s0925-4439(02)00093-5. [DOI] [PubMed] [Google Scholar]
- 9.Kopka ML, Yoon C, Goodsell D, Pjura P, Dickerson RE. The molecular origin of DNA-drug specificity in netropsin and distamycin. Proc Natl Acad Sci U S A. 1985;82:1376–1380. doi: 10.1073/pnas.82.5.1376. [DOI] [PMC free article] [PubMed] [Google Scholar]
- 10.Goodwin KD, Long EC, Georgiadis MM. A host-guest approach for determining drug-DNA interactions: an example using netropsin. Nucleic Acids Res. 2005;33:4106–4116. doi: 10.1093/nar/gki717. [DOI] [PMC free article] [PubMed] [Google Scholar]
- 11.Bailly C, Waring MJ. The use of diaminopurine to investigate structural properties of nucleic acids and molecular recognition between ligands and DNA. Nucleic Acids Res. 1998:4309–4314. doi: 10.1093/nar/26.19.4309. [DOI] [PMC free article] [PubMed] [Google Scholar]
- 12.Hannah KC, Armitage BA. DNA-templated assembly of helical cyanine dye aggregates: a supramolecular chain polymerization. Acc Chem Res. 2004:845–53. doi: 10.1021/ar030257c. [DOI] [PubMed] [Google Scholar]
- 13.Wemmer DE. Designed sequence-specific minor groove ligands. Annu Rev Biophys Biomol Struct. 2000;29:439–461. doi: 10.1146/annurev.biophys.29.1.439. [DOI] [PubMed] [Google Scholar]
- 14.Joubert A, Sun XW, Johansson E, Bailly C, Mann J, Neidle S. Sequence-selective targeting of long stretches of the DNA minor groove by a novel dimeric bis-benzimidazole. Biochemistry. 2003:5984–92. doi: 10.1021/bi026926w. [DOI] [PubMed] [Google Scholar]
- 15.Shapiro TA, Englund PT. The structure and replication of kinetoplast DNA. Annu Rev Microbiol. 1995;49:117–143. doi: 10.1146/annurev.mi.49.100195.001001. [DOI] [PubMed] [Google Scholar]
- 16.Fairley TA, Tidwell RR, Donkor I, Naiman NA, Ohemeng KA, Lombardy RJ, Bentley JA, Cory M. Structure, DNA minor groove binding, and base pair specificity of alkyl- and aryl-linked bis(amidinobenzimidazoles) and bis(amidinoindoles) J Med Chem. 1993;36:1746–1753. doi: 10.1021/jm00064a008. [DOI] [PubMed] [Google Scholar]
- 17.Nguyen B, Boykin DW, Wilson WD. DNA Minor Groove Interactions of Antiparasitic Diamidines: Reevaluation of The Crescent-Shape Concept in Groove-Binding. In: Lee M, Strekowski L, editors. Synthetic and Biophysical Studies of DNA binding Compounds. Research Signpost; in press (2007) [Google Scholar]
- 18.Luscombe NM, Laskowski RA, Thornton JM. Amino acid-base interactions: a three-dimensional analysis of protein-DNA interactions at an atomic level. Nucleic Acids Res. 2001:2860–74. doi: 10.1093/nar/29.13.2860. [DOI] [PMC free article] [PubMed] [Google Scholar]
- 19.Bergqvist S, Williams MA, O’brien R, Ladbury JE. Heat capacity effects of water molecules and ions at a protein-DNA interface. J Mol Biol. 2004;336:829–842. doi: 10.1016/j.jmb.2003.12.061. [DOI] [PubMed] [Google Scholar]
- 20.Ismail MA, Batista-Parra A, Miao Y, Wilson WD, Wenzler T, Brun R, Boykin DW. Dicationic near-linear biphenyl benzimidazole derivatives as DNA-targeted antiprotozoal agents. Bioorg Med Chem. 2005;13:6718–6726. doi: 10.1016/j.bmc.2005.07.024. [DOI] [PubMed] [Google Scholar]
- 21.Athri P, Wenzler T, Ruiz P, Brun R, Boykin DW, Tidwell R, Wilson WD. 3D QSAR on a library of heterocyclic diamidine derivatives with antiparasitic activity. Bioorg Med Chem. 2006;14:3144–3152. doi: 10.1016/j.bmc.2005.12.029. [DOI] [PubMed] [Google Scholar]
- 22.Nguyen B, Stanek J, Wilson WD. Binding-linked protonation of a DNA minor-groove agent. Biophys J. 2006;90:1319–1328. doi: 10.1529/biophysj.105.071381. [DOI] [PMC free article] [PubMed] [Google Scholar]
- 23.Nguyen B, Lee MP, Hamelberg D, Joubert A, Bailly C, Brun R, Neidle S, Wilson WD. Strong binding in the DNA minor groove by an aromatic diamidine with a shape that does not match the curvature of the groove. J Am Chem Soc. 2002;124:13680–13681. doi: 10.1021/ja027953c. [DOI] [PubMed] [Google Scholar]
- 24.Nguyen B, Hamelberg D, Bailly C, Colson P, Stanek J, Brun R, Neidle S, Wilson WD. Characterization of a novel DNA minor-groove complex. Biophys J. 2004;86:1028–1041. doi: 10.1016/s0006-3495(04)74178-8. [DOI] [PMC free article] [PubMed] [Google Scholar]
- 25.Miao Y, Lee MP, Parkinson GN, Batista-Parra A, Ismail MA, Neidle S, Boykin DW, Wilson WD. Out-of-shape DNA minor groove binders: induced fit interactions of heterocyclic dications with the DNA minor groove. Biochemistry. 2005:14701–14708. doi: 10.1021/bi051791q. [DOI] [PubMed] [Google Scholar]
- 26.Tanious FA, Hamelberg D, Bailly C, Czarny A, Boykin DW, Wilson WD. DNA sequence dependent monomer-dimer binding modulation of asymmetric benzimidazole derivatives. J Am Chem Soc. 2004;126:143–153. doi: 10.1021/ja030403+. [DOI] [PubMed] [Google Scholar]
- 27.Haq I, Ladbury JE, Chowdhry BZ, Jenkins TC, Chaires JB. Specific binding of hoechst 33258 to the d(CGCAAATTTGCG)2 duplex: calorimetric and spectroscopic studies. J Mol Biol. 1997;271:244–257. doi: 10.1006/jmbi.1997.1170. [DOI] [PubMed] [Google Scholar]
- 28.Satz AL, Bruice TC. Recognition in the minor groove of double-stranded DNA by microgonotropens. Acc Chem Res. 2002;35:86–95. doi: 10.1021/ar0101032. [DOI] [PubMed] [Google Scholar]
- 29.Haq I. Thermodynamics of drug-DNA interactions. Arch Biochem Biophys. 2002;403:1–15. doi: 10.1016/S0003-9861(02)00202-3. [DOI] [PubMed] [Google Scholar]
- 30.Goodwin KD, Lewis MA, Tanious FA, Tidwell RR, Wilson WD, Georgiadis MM, Long EC. A high-throughput, high-resolution strategy for the study of site-selective DNA binding agents: Analysis of a “highly twisted” benzimidazole-diamidine. J Am Chem Soc. 2006;128:7846–7854. doi: 10.1021/ja0600936. [DOI] [PMC free article] [PubMed] [Google Scholar]
- 31.Tidwell RR, Geratz JD, Dann O, Volz G, Zeh D, Loewe H. Diarylamidine derivatives with one or both of the aryl moieties consisting of an indole or indole-like ring. Inhibitors of arginine-specific esteroproteases. J Med Chem. 1978;21:613–623. doi: 10.1021/jm00205a005. [DOI] [PubMed] [Google Scholar]
- 32.Bailly C, Waring MJ. Comparison of different footprinting methodologies for detecting binding sites for a small ligand on DNA. J Biomol Struct Dyn. 1995;12:869–898. doi: 10.1080/07391102.1995.10508782. [DOI] [PubMed] [Google Scholar]
- 33.Tse WC, Boger DL. A fluorescent intercalator displacement assay for establishing DNA binding selectivity and affinity. Acc Chem Res. 2004;37:61–69. doi: 10.1021/ar030113y. [DOI] [PubMed] [Google Scholar]
- 34.Boger DL, Fink BE, Brunette SR, Tse WC, Hedrick MP. A simple, high-resolution method for establishing DNA binding affinity and sequence selectivity. J Am Chem Soc. 2001;123:5878–5891. doi: 10.1021/ja010041a. [DOI] [PubMed] [Google Scholar]
- 35.Lee B, Richards FM. The interpretation of protein structures: estimation of static accessibility. J Mol Biol. 1971;55:379–400. doi: 10.1016/0022-2836(71)90324-x. [DOI] [PubMed] [Google Scholar]
- 36.Hubbard SJ, Thornton JM. NACCESS, Computer Program, Department of Biochemistry and Molecular Biology. University College London.; 1993. at http://wolf.bms.umist.ac.uk/naccess/ [Google Scholar]
- 37.Myszka DG, He X, Dembo M, Morton TA, Goldstein B. Extending the range of rate constants available from BIACORE: interpreting mass transport-influenced binding data. Biophys J. 1998;75:583–594. doi: 10.1016/S0006-3495(98)77549-6. [DOI] [PMC free article] [PubMed] [Google Scholar]
- 38.Karlsson R. Affinity analysis of non-steady-state data obtained under mass transport limited conditions using BIAcore technology. J Mol Recognit. 1999;12:285–292. doi: 10.1002/(SICI)1099-1352(199909/10)12:5<285::AID-JMR469>3.0.CO;2-Y. [DOI] [PubMed] [Google Scholar]
- 39.Lewis MA, Long EC. Fluorescent intercalator displacement analyses of DNA binding by the peptide-derived natural products netropsin, actinomycin, and bleomycin. Bioorg Med Chem. 2006;14:3481–3490. doi: 10.1016/j.bmc.2006.01.006. [DOI] [PubMed] [Google Scholar]
- 40.Rodger A, Nordén B. Circular Dichroism and Linear Dichroism. New York: Oxford University Press; 1997. [Google Scholar]
- 41.Lyng R, Rodger A, Norden B. The CD of ligand-DNA systems. 2 Poly(dA-dT) B-DNA. Biopolymers. 1992;32:1201–1214. doi: 10.1002/bip.360320910. [DOI] [PubMed] [Google Scholar]
- 42.Wilson WD, Tanious FA, Fernandez-Saiz M, Rigl CT. Evaluation of drug-nucleic acid interactions by thermal melting curves. Methods Mol Biol. 1997;90:219–240. doi: 10.1385/0-89603-447-X:219. [DOI] [PubMed] [Google Scholar]
- 43.Myszka DG, Abdiche YN, Arisaka F, Byron O, Eisenstein E, Hensley P, Thomson JA, Lombardo CR, Schwarz F, Stafford W, Doyle ML. The ABRF-MIRG’02 study: assembly state, thermodynamic, and kinetic analysis of an enzyme/inhibitor interaction. J Biomol Tech. 2003;14:247–269. [PMC free article] [PubMed] [Google Scholar]
- 44.Day YS, Baird CL, Rich RL, Myszka DG. Direct comparison of binding equilibrium, thermodynamic, and rate constants determined by surface- and solution-based biophysical methods. Protein Sci. 2002;11:1017–1025. doi: 10.1110/ps.4330102. [DOI] [PMC free article] [PubMed] [Google Scholar]
- 45.Day YS, Myszka DG. Characterizing a drug’s primary binding site on albumin. J Pharm Sci. 2003;92:333–343. doi: 10.1002/jps.10293. [DOI] [PubMed] [Google Scholar]
- 46.Drake AW, Myszka DG, Klakamp SL. Characterizing high-affinity antigen/antibody complexes by kinetic- and equilibrium-based methods. Anal Biochem. 2004;328:35–43. doi: 10.1016/j.ab.2003.12.025. [DOI] [PubMed] [Google Scholar]
- 47.Karlsson R, Larsson A. Affinity measurement using surface plasmon resonance. Methods Mol Biol. 2004;248:389–415. doi: 10.1385/1-59259-666-5:389. [DOI] [PubMed] [Google Scholar]
- 48.Mazur S, Tanious FA, Ding D, Kumar A, Boykin DW, Simpson IJ, Neidle S, Wilson WD. A thermodynamic and structural analysis of DNA minor-groove complex formation. J Mol Biol. 2000;300:321–337. doi: 10.1006/jmbi.2000.3869. [DOI] [PubMed] [Google Scholar]
- 49.Wiseman T, Williston S, Brandts JF, Lin LN. Rapid measurement of binding constants and heats of binding using a new titration calorimeter. Anal Biochem. 1989;179:131–137. doi: 10.1016/0003-2697(89)90213-3. [DOI] [PubMed] [Google Scholar]
- 50.Wang L, Kumar A, Boykin DW, Bailly C, Wilson WD. Comparative thermodynamics for monomer and dimer sequence-dependent binding of a heterocyclic dication in the DNA minor groove. J Mol Biol. 2002;317:361–374. doi: 10.1006/jmbi.2002.5433. [DOI] [PubMed] [Google Scholar]
- 51.Spolar RS, Livingstone JR, Record MT., Jr Use of liquid hydrocarbon and amide transfer data to estimate contributions to thermodynamic functions of protein folding from the removal of nonpolar and polar surface from water. Biochemistry. 1992:3947–3955. doi: 10.1021/bi00131a009. [DOI] [PubMed] [Google Scholar]
- 52.Ren J, Jenkins TC, Chaires JB. Energetics of DNA intercalation reactions. Biochemistry. 2000:8439–8447. doi: 10.1021/bi000474a. [DOI] [PubMed] [Google Scholar]
- 53.Bailly C, Kluza J, Martin C, Ellis T, Waring MJ. DNase I Footprinting of Small Molecule Binding Sites on DNA. In: Herdewijn P, editor. Oligonucleotide Synthesis: Methods and Applications. Humana Press; Totowa, NJ: 2004. pp. 319–342. [DOI] [PubMed] [Google Scholar]
- 54.Weston SA, Lahm A, Suck D. X-ray structure of the DNase I-d(GGTATACC)2 complex at 2.3 A resolution. J Mol Biol. 1992:1237–1256. doi: 10.1016/0022-2836(92)91064-v. [DOI] [PubMed] [Google Scholar]
- 55.Abu-Daya A, Brown PM, Fox KR. DNA sequence preferences of several AT-selective minor groove binding ligands. Nucleic Acids Res. 1995;23:3385–3392. doi: 10.1093/nar/23.17.3385. [DOI] [PMC free article] [PubMed] [Google Scholar]
- 56.Abu-Daya A, Fox KR. Interaction of minor groove binding ligands with long AT tracts. Nucleic Acids Res. 1997;25:4962–4969. doi: 10.1093/nar/25.24.4962. [DOI] [PMC free article] [PubMed] [Google Scholar]
- 57.Fox KR, Yan Y, Gong B. DNA sequence recognition by a novel series of minor groove-binding ligands. Anticancer Drug Des. 1999;14:219–230. [PubMed] [Google Scholar]
- 58.Nguyen B, Tardy C, Bailly C, Colson P, Houssier C, Kumar A, Boykin DW, Wilson WD. Influence of compound structure on affinity, sequence selectivity, and mode of binding to DNA for unfused aromatic dications related to furamidine. Biopolymers. 2002:281–297. doi: 10.1002/bip.10073. [DOI] [PubMed] [Google Scholar]
- 59.Cooper A, Johnson CM, Lakey JH, Nollmann M. Heat does not come in different colours: entropy-enthalpy compensation, free energy windows, quantum confinement, pressure perturbation calorimetry, solvation and the multiple causes of heat capacity effects in biomolecular interactions. Biophys Chem. 2001;93:215–230. doi: 10.1016/s0301-4622(01)00222-8. [DOI] [PubMed] [Google Scholar]
- 60.Cooper A. Heat capacity effects in protein folding and ligand binding: a reevaluation of the role of water in biomolecular thermodynamics. Biophys Chem. 2005;115:89–97. doi: 10.1016/j.bpc.2004.12.011. [DOI] [PubMed] [Google Scholar]
- 61.Laughton CA, Tanious F, Nunn CM, Boykin DW, Wilson WD, Neidle S. A crystallographic and spectroscopic study of the complex between d(CGCGAATTCGCG)2 and 2,5-bis(4-guanylphenyl)furan, an analogue of berenil. Structural origins of enhanced DNA-binding affinity. Biochemistry. 1996;35:5655–5661. doi: 10.1021/bi952162r. [DOI] [PubMed] [Google Scholar]
Associated Data
This section collects any data citations, data availability statements, or supplementary materials included in this article.
Supplementary Materials
SPR data of RT29 binding to AATTAA sequence and ITC data for binding of RT29 to AATTAA and ATTC sequences (Figures S1–S3). This material is available free of charge via the Internet at http://pubs.acs.org.


