

Abstract
Steady-state and time-resolved fluorescence measurements on each of five native tryptophan residues in full-length and truncated variants of E. coli outer-membrane protein A (OmpA) have been made in folded and denatured states. Tryptophan singlet excited-state lifetimes are multiexponential and vary among the residues. In addition, substantial increases in excited-state lifetimes accompany OmpA folding, with longer lifetimes in micelles than in phospholipid bilayers. This finding suggests that the Trp environments of OmpA folded in micelles and phospholipid bilayers are different. Measurements of Trp fluorescence decay kinetics with full-length OmpA folded in brominated lipid vesicles reveal that W102 is the most distant fluorophore from the hydrocarbon core, while W7 is the closest. Steady-state and time-resolved polarized fluorescence measurements indicate reduced Trp mobility when OmpA is folded in a micelle, and even lower mobility when the protein is folded in a bilayer. The fluorescence properties of truncated OmpA, in which the soluble periplasmic domain is removed, only modestly differ from those of the full-length form, suggesting similar folded structures for the two forms under these conditions.
Introduction
Integral membrane proteins comprise ∼30% of all cellular proteins; they perform essential functions as gates, pumps, receptors, energy transducers, and enzymes. Since the 1975 structure analysis of bacteriorhodopsin at 7 Å resolution,1 ∼100 α-helical and β-barrel membrane proteins have been structurally characterized.2 In addition, a substantial body of work aimed at elucidating the mechanisms of membrane protein folding and assembly in vitro3,4 and in vivo5 has shed light on the steps involved in the formation of nanoscale biomolecular structures. These fundamental studies are poised to help elucidate the molecular basis of membrane protein misfolding diseases.2,6
Few integral membrane proteins have been successfully folded from fully denatured states in vitro;7 the Gram-negative bacterial outer membrane protein A (OmpA) is one example.8 OmpA is among the most abundant outer membrane proteins of E. coli with proposed functions that include linking the outer membrane to the underlying peptidoglycan layer as well as serving as a receptor for colicin and several phages.9 The N-terminal ∼170 residues of OmpA form a barrel built from eight transmembrane antiparallel β-strands; the ∼155-residue C-terminal domain occupies the periplasmic space.10 Structures (NMR11,12 and X-ray13) and molecular dynamics simulations14 of the transmembrane domain have been reported. OmpA, which unfolds completely in 8 M urea, spontaneously refolds into detergent micelles or phospholipids bilayers upon dilution of denaturant. Biochemical and steady-state emission data reveal that the folding efficiency and kinetics are highly dependent on several factors, such as pH,15 temperature,16,17 and bilayer properties.15,18
We have probed changes in local tryptophan microenvironments and relative mobilities via comparisons of excited-state and anisotropy decay kinetics in folded and unfolded OmpA. Native tryptophan (W) residues at positions 7, 15, 57, 102 and 143 (Figure 1) are located at the bilayer-water interface, consistent with the strong preference of the aromatic amino acids for interfacial positions. Our work includes an investigation of the effects of the soluble, C-terminal periplasmic domain on the transmembrane structure of OmpA. We have found that OmpA tryptophan fluorescence is a sensitive reporter of OmpA membrane insertion and folding.
Figure 1.

Structural representation of the OmpA membrane domain (residues 1−171; PDB file 1QJP13) highlighting the 5 native tryptophan residues and including a cartoon of the periplasmic domain.
Materials and Methods
Preparation of small unilamellar vesicles (SUVs)
The protocol for SUV preparation is adapted from a published procedure.8 A solution of 1,2-dimyristoyl-sn-glycero-3-phosphocholine (DMPC, Avanti Polar Lipids) in CHCl3 (20 mg/mL) was dried in a glass vial under vacuum or a stream of argon. For experiments with the brominated lipid 1-palmitoyl-2-stearoyl(6−7)dibromo-sn-glycero-3-phosphocholine (6,7-DiBr, Avanti Polar Lipids), a 1:3 molar 6,7-DiBr:DMPC solution was prepared by adding an appropriate volume of 6,7-DiBr in CHCl3 solution (25 mg/mL) to DMPC prior to drying. Dried lipids were hydrated in 20 mM potassium phosphate (KPi) buffer (pH 7.3) to a final lipid concentration of 5 mg/mL. SUVs were prepared by sonication of the lipid solution for 30 minutes using a Branson ultrasonicator microtip at 50 % duty cycle (200 W) in a water bath. Titanium dust and other particulates were removed either by centrifugation or by passing the sonicated solution through a 0.22 μm filter. The SUVs were diluted with 20 mM KPi (pH 7.3) to a final lipid concentration of 1 mg/mL (1.5 mM), then equilibrated overnight at 35 °C. DMPC SUVs were kept above its phase transition temperature of 23 °C and used the day after preparation in all experiments.
Preparation of single-tryptophan OmpA mutants
The plasmid (pET1102) coding for a mutant of full-length (325-residue) OmpA containing a single tryptophan at position 7 (W7) was provided by L. K. Tamm (University of Virginia).17 Site-directed mutagenesis was used to produce full-length, single-W OmpA variants (W15, W57, W102, and W143). The 147-residue periplasmic domain in each of the five single tryptophan mutants was removed by introduction of a stop codon at position 177; expression of these plasmids produced five truncated (176-residue) single-W OmpA mutants (W7t, W15t, W57t, W102t and W143t). PCR products were chemically transformed into XL1 Blue supercompetent cells. DNA was extracted using the Qiagen Miniprep Kit and sequences were verified at the Caltech Sequence and Structure Analysis Facility.
Expression, isolation, and purification of OmpA (wild-type and mutants)
OmpA isolation and purification protocols were adapted from published procedures.8,19,20 Native OmpA was obtained from the OmpC-free E. coli strain JF701 (E. coli Genetic Stock Center, Yale University). JF701 cells were first grown overnight at 37 °C in 50 mL of sterile media (1% bactotryptone, 0.5% yeast extract media, and streptomycin (25 μg/mL)). Cells were pelleted, washed, and transferred to 6 L of freshly prepared sterile growth media (1% bactotryptone, 0.5% yeast extract media, and streptomycin (25 μg/mL)). Cells were harvested at OD600 = 0.9 and washed twice with 10 mM Tris-Cl (pH 7.8).
OmpA mutants were overexpressed in the OmpA- and OmpF-free E. coli strain JF733 (E. coli Genetic Stock Center, Yale University). JF733 cells containing plasmids for mutant OmpA protein were grown overnight in 300 mL of LB media containing 0.5% glucose and 50 μg/mL of ampicillin at 37 °C. Cells were washed the following morning with LB and then transferred to 6 L of fresh sterile LB media containing 50 μg/mL ampicillin. OmpA expression was induced with 1−1.5 mM isopropyl β-d-thiogalactoside. Cells were harvested at OD600 = 1.3 and washed twice with 10 mM Tris-Cl (pH 7.8). If necessary, cell pellets were stored at −80 °C until further extraction procedures, upon which the cells were defrosted in a room temperature water bath.
Wild-type and mutant OmpAs were isolated and purified using the following procedure. Defrosted cell pellets were resuspended in a cold solution (50 mL) of sucrose (0.75M) in Tris-Cl buffer (10mM, pH 7.8), and a solution (50 mL) of cold EDTA (20mM) and lysozyme (0.5 mg/mL) was added over a span of 1 min. The cell suspension was stirred in an ice bath until no clumps were visible, and then sonicated on ice with a standard tip horn for a total of 5 min at 50% duty cycle. The lysed cells were then centrifuged at 1500 × g for 15 min to remove intact cells and other particulates, and the supernatant was then spun for 90 minutes at 150,000 × g. The red-brown pellets containing OmpA were resuspended in 70 mL of pre-extraction buffer (3.5 M urea, 20 mM Tris-Cl, pH 9.0, 0.05% 2-mercaptoethanol) by stirring in a 50 °C water bath. The solution was centrifuged at 150,000 × g for 2 h. The pelleted membranes were suspended in a buffer consisting of a 1:1 mixture of isopropanol:extraction buffer (8 M urea, 20 mM Tris-Cl, pH 8.5, 0.1% 2-mercaptoethanol), stirred at 50 °C until no clumps were visible, and centrifuged at 150,000 × g for 90 min to extract OmpA from the lipid membrane. The supernatant containing OmpA was then stored at 4 °C.
Crude OmpA was purified by anion-exchange chromatography using a Q Sepharose Fast Flow column (Pharmacia) equilibrated with a urea-buffer solution (8 M urea, 15 mM Tris-Cl, pH 8.5, 0.5% 2-mercaptoethanol). A linear NaCl gradient (0−150mM) was used to elute OmpA. Purified protein was washed and concentrated in a urea-buffer solution (8 M urea, 20mM KPi, pH 7.3) by ultrafiltration (Amicon, PM-10 for full-length mutants; YM-3 for truncated mutants), and these stock samples were stored at −80 or −20 °C. Yields of purified OmpA varied from 3 to 5 mg/L culture, and the samples were ∼90% pure based on the differential gel electrophoretic mobility of folded and unfolded OmpA.
Reconstitution
OmpA was refolded in detergent micelles or SUVs following an established protocol.8 For detergent studies, OmpA was diluted >20-fold into a solution of OG (10 mg/ml, 20mM KPi, pH 7.3) and allowed to equilibrate 30 minutes prior to spectroscopic measurements. This OG concentration is ∼1.4-times the critical micelle concentration, ensuring that OG is in a micellar form. The molar ratio of OmpA to OG was about 1:7500. For vesicle studies, OmpA was incubated in 1 mg/ml DMPC (20mM KPi, pH 7.3) for ∼ 3 hours in 30 °C prior to measurements. The molar ratio of OmpA to DMPC was about 1:300. Folding was confirmed by the differential gel electrophoretic mobility of folded (30 kDa) and unfolded (35 kDa) OmpA (data not shown).
Steady-state absorption, circular dichroism, and fluorescence spectra
Absorption spectra were recorded on a Hewlett-Packard 8453 diode-array spectrophotometer. Background spectra of SUVs were recorded and subtracted from OmpA absorption spectra. Protein concentrations were estimated using ε280 = 54,390, ε280 = 32,330, and ε280 = 26,020 M−1 cm−1 for OmpA wild-type, full-length mutants, and truncated mutants, respectively. CD spectra were recorded on an Aviv 62ADS spectropolarimeter (Aviv Associates, Lakewood, NJ). Measurements on ∼6 μM OmpA samples were recorded at room temperature (urea and n-octyl-β-D-glucopyranoside (OG)) and 30 °C (DMPC) in a 1-mm fused-silica cuvette. Scans were recorded from 190 to 260 nm at 1-nm intervals with an integration time of 3 s and a bandwidth of 1.5 nm. Background spectra of buffer-only, OG-only or DMPC-only were also recorded and subtracted from OmpA spectra. Steady-state tryptophan fluorescence spectra and anisotropy were measured with a Jobin Yvon/SPEX Fluorolog spectrofluorometer (Model FL3−11) equipped with a Hamamatsu R928 PMT. Samples (∼3 μM ) were excited at 290 nm (2-nm bandpass) and luminescence was observed from 300 to 500 nm (2-nm and 4-nm bandpass for fluorescence and anisotropy measurements, respectively) at 2-nm intervals with 0.5 s integration times at room temperature or 30 °C. For steady-state anisotropy measurements, polarization filters were placed before and after the sample. Four spectra were measured, IVV, IVH, IHH, and IHV, where the first and second subscripts correspond to the excitation and emission polarization directions (vertical or horizontal), respectively. The steady-state anisotropy value (rss) was calculated for each of the samples from the following equation:21
Tryptophan fluorescence and anisotropy decay kinetics
Typical OmpA samples consisted of 1.2 mL of ∼3 μM protein in a 1-cm path-length fused silica cuvette with a stir bar and rubber septum. Prior to excited-state and anisotropy decay measurements, samples were deoxygenated with 5−6 evacuation/Ar-refill cycles over a period of 10 min in a 30 °C water bath. Samples in DMPC were kept in a 35 °C oven for at least 3 h before measurements and a temperature-controlled cuvette holder was used to keep samples at 30 °C during measurements. Samples were excited at a 1 kHz repetition rate with 290-nm pulses (550−650 μW for excited-state decay; 900 μW for anisotropy decay) from a femtosecond Ti:sapphire regenerative amplifier (Spectra Physics) and decay kinetics were measured (355 ± 5 nm) using a picosecond streak camera (9−15 min integration times, photon-counting mode) (Hamamatsu C5680). Under our experimental conditions, the temporal instrument response had a full-width at half-max of ∼300 ps. Luminescence decay measurements were performed using magic-angle polarization conditions.22 For anisotropy decay kinetics, the excitation beam was polarized vertically or horizontally and the luminescence was selected with vertically or horizontally oriented polarizers. Data sets under the different folding or unfolding conditions were acquired on the same day for all OmpA mutants to ensure that the relative differences between mutants were reliable. A standard decay curve (typically NATA in KPi) was used to confirm that data sets from different days could be compared. Absorption spectra were recorded before and after decay measurements to confirm minimal (<10%) photobleaching.
Results and Discussion
CD spectra report on the secondary structure of wild type and mutant OmpA (Figure 2). The protein is unfolded in 8 M urea; the spectra show no evidence of secondary structure. Upon folding in detergent, however, a characteristic β-sheet peak centered at 212 nm (full length protein) or 216 nm (truncated protein) appears.8,15 Full-length mutant and wild-type OmpA have virtually identical spectra, indicating that mutation of 4 of the 5 native tryptophans to phenylalanine does not disturb the general β-barrel of the protein. Removal of the soluble C-terminus causes a decrease in molar ellipticity as well as a slightly red-shifted CD peak. This loss of ellipticity for the truncated mutants suggests that the C-terminus has secondary structure (possibly β-sheet). It has been suggested at temperatures above 26 °C, OmpA forms a large ∼1 nm β-barrel pore in which the C-terminus is inserted into the transmembrane domain.23 While our CD data are consistent with increased secondary structure arising from the C-terminus, this “large-pore” (if it exists in substantial populations) structure does not drastically alter the microenvironment near each native trp, evidenced by only modest difference in fluorescence properties between truncated and full-length proteins (vide infra).
Figure 2.

Steady-state CD spectra of wild type, full-length and truncated OmpA mutants unfolded in urea, folded in OG, and folded in DMPC (30°C).
Fluorescence spectra of N-acetyl-tryptophanamide (NATA) and full-length and truncated OmpA mutants are shown in Figure 3 (data are in Table 1). For non hydrogen-bonded systems, the Stokes shift is correlated with solvent dielectric properties and refractive indices.24 NATA exhibits the largest Stokes shift (72 nm, λabs 280 nm, λem 352 nm) in urea, OG, and DMPC, and this emission maximum is unchanged in Pi buffer (data not shown). The observed Stokes shift is consistent with a polar environment for the indole chromophore in the presence of lipids, indicating that NATA does not reside in the interior of a micelle or embedded in a vesicle.
Figure 3.

Steady-state fluorescence spectra of NATA, full-length and truncated OmpA mutants unfolded in urea, folded in OG, and folded in DMPC (30 °C).
Table 1.
Fluorescence maxima of NATA and OmpA mutants unfolded in urea, folded in OG, and folded in DMPC, and ratios of quenched to unquenched emission intensities (F/F0) and lifetimes (τ/τ0) for full-length OmpA mutants in DMPC and DMPC/6,7-DiBr. Lifetime ratios are based on amplitude-weighted average lifetimes from tri-exponential decay fits.
| Fluorescence Maxima (nm) | Quenching | ||||
|---|---|---|---|---|---|
| Urea | OG | DMPC | F/F0 | τ/τ0 | |
| NATA | 352 | 352 | 352 | 1 | 1 |
| W7 | 346 | 322 | 318 | 0.4 | 0.6 |
| W7t | 346 | 324 | 318 | ----- | ----- |
| W15 | 346 | 328 | 326 | 0.4 | 0.6 |
| W15t | 346 | 328 | 326 | ----- | ----- |
| W57 | 346 | 324 | 325 | 0.5 | 0.7 |
| W57t | 346 | 326 | 325 | ----- | ----- |
| W102 | 346 | 326 | 324 | 0.8 | 1 |
| W102t | 346 | 326 | 324 | ----- | ----- |
| W143 | 346 | 326 | 326 | 0.4 | 0.7 |
| W143t | 346 | 326 | 327 | ----- | ----- |
Trp residues in unfolded OmpA exhibit a small blue shift in fluorescence maximum relative to NATA (346 nm, independent of Trp position). Upon folding in detergent micelles or vesicles, however, the Stokes shift decreases to 38−48 nm and the emission maximum varies from 318 to 328 nm, depending on Trp location on the protein. The observed blue shift and increase in fluorescence quantum yield upon folding is attributed to the hydrophobic environment around tryptophan in the folded protein.8,15,17,25,26 Fluorescence spectra of OmpA folded in OG or DMPC show slight differences. In addition, there are only minor differences in fluorescence spectra between full-length and truncated proteins, supporting a picture in which OmpA structure is only minimally affected by the presence of the large periplasmic domain.
Trp emission maxima in folded OmpA vary with location: W7 has the most blue-shifted fluorescence peak (322 nm in OG; 318 nm in DMPC), suggesting that it is in the most hydrophobic environment of the five Trp residues. Measurements with brominated lipids confirm that W7 is closest to the hydrocarbon region of the lipid vesicle (Figure 4, Table 1). Fluorescence spectra and emission decay kinetics of full-length single-Trp OmpA mutants in vesicles composed of 100% DMPC and 25% 6,7-DiBr reveal that W7 experiences the greatest degree of quenching, and W102 the least. X-ray diffraction studies indicate that the bromine atoms in vesicles of this composition are ∼11 Å from the bilayer center and 3.5 Å from the head-group/hydrocarbon boundary.27 Using an empirical correlation between fluorescence quenching and Trp-Br distance,28 we estimate that W7, W15, W57, and W143 are ∼10 Å from the Br atom. The absence of Trp102 quenching suggests that the indole side chain is >14 Å from this site, a finding that is consistent with a model in which only this Trp residue points away from the hydrocarbon core (Figure 1).
Figure 4.
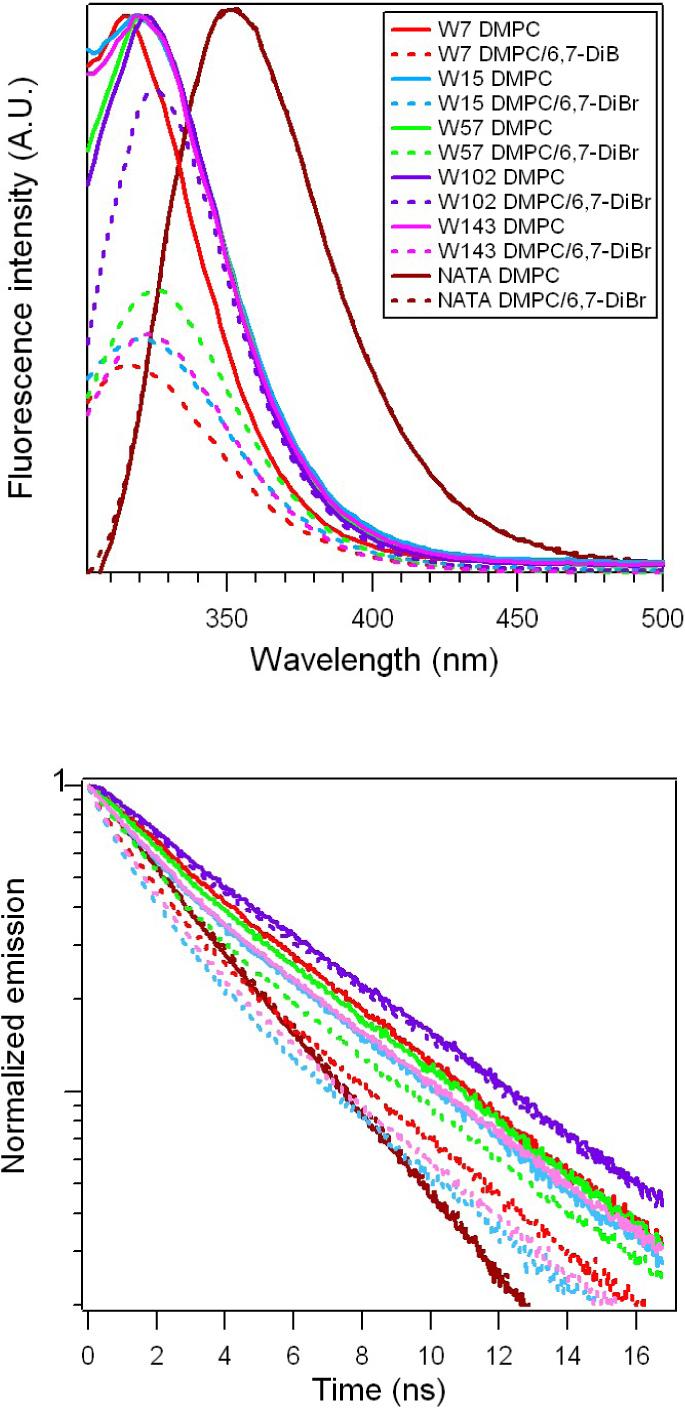
Steady-state fluorescence spectra (top) and fluorescence decay (bottom) of NATA and full-length OmpA mutants folded in 100% DMPC or 75% DMPC/25% 6,7-DiBr.
The indole fluorescence decay kinetics of NATA in the presence of urea, micelles, and vesicles (Figure 5, Table 2) are adequately described by bi- or triexponential functions (urea, τ1 = 4.9 ns (70%), τ2 = 3.5 ns (30%); OG, 3.9 (60%), 1.9 (32%), 1.7 (9%); DMPC, 3.4 (62%), 1.8 (31%), 1.7 (9%)). The nonexponential decay of tryptophan fluorescence has been attributed to both static (equilibrium of mixture of conformers) and dynamic (rapid interconversion of conformers) effects.24,26,29 Emission decay kinetics for Trp residues in OmpA are quite different from those of NATA, even under strongly denaturing conditions (8 M urea). Trp fluorescence decays in fully denatured OmpA are faster than those of NATA (τ1 = 4.5−5.5 ns (∼50%), τ2 = 1.5−1.8 ns (∼40%)) and in some cases are better fit with triexponential functions.
Figure 5.

Fluorescence decay of NATA, full-length and truncated OmpA mutants unfolded in urea, folded in OG, and folded in DMPC (30 °C).
Table 2.
Amplitude-weighted average lifeteims of NATA and OmpA mutants unfolded in urea, folded in OG, and folded in 30°C DMPC.
| Average Lifetime (ns) | |||
|---|---|---|---|
| Urea | OG | DMPC | |
| NATA | 4.5 | 3.1 | 2.9 |
| W7 | 3.1 | 5.2 | 4.1 |
| W7t | 3.1 | 4.9 | 4.6 |
| W15 | 2.9 | 4.2 | 3.7 |
| W15t | 3.0 | 4.3 | 3.9 |
| W57 | 3.5 | 4.5 | 4.5 |
| W57t | 3.7 | 4.8 | 4.7 |
| W102 | 3.9 | 4.1 | 4.8 |
| W102t | 3.9 | 4.7 | 4.9 |
| W143 | 2.9 | 4.6 | 3.7 |
| W143t | 3.1 | 4.1 | 3.8 |
Trp lifetimes increase when OmpA folds in detergent micelles or (although to a lesser extent) vesicles (OG, τ1 = 6.0−6.7 ns (∼50%), τ2 = 2.2−2.6 (∼45%) ns; DMPC, 5.3−6.3 ns (∼45%), 2.1−2.7 ns (∼45%)) (Figure 6). Our finding of an increase in Trp lifetime upon folding is consistent with an earlier report on the average lifetimes of the five native tryptophans in wild type OmpA denatured in guanidine hydrochloride and folded in vesicles.15 W7 and W7t exhibit the greatest increases in tryptophan lifetime upon folding, whereas W102 and W102t display the smallest, a result consistent with the position of these residues in the lipid bilayer; (W7 is closest to the hydrocarbon core; W102 is the most distant).
Figure 6.

Fluorescence decay of full-length (left) and truncated (right) OmpA mutants unfolded in urea (red), folded in OG (blue), and folded in 30 °C DMPC (green).
Singlet-excited Trp residues in proteins are quenched by electron and possibly proton transfer reactions with amino acids such as tyrosine and cysteine.30 In addition, it is likely that local solvent refractive index and polarity modulate these Trp excited-state decay rates.31 Hence, variations in lifetimes for folded OmpA in OG and DMPC reflect different microenvironments for individual Trp residues subjected to the two different folding conditions. Variations in CD spectra for the protein in OG and DMPC are consistent with this interpretation. This finding suggests that the structure of OmpA in vesicles may differ from that in detergent micelles; currently, the only structures of OmpA are from both NMR solution12 and X-ray crystal13 data collected for the protein folded in micelles.
The fluorescence decay kinetics of the different Trp mutants reveal interesting trends. Under strongly denaturing conditions, the microenvironments of the five residues, which are not identical, vary substantially from that of free NATA. Evidence for residual structure has been documented in studies of other denatured proteins, including the soluble heme protein cytochrome c.32 Our data suggest that the membrane protein OmpA also exhibits residual structure under strongly denaturing conditions. Notably, this deviation from random coil behavior is not affected by the periplasmic domain, as truncated and full length OmpA exhibit similar Trp fluorescence decay kinetics in 8 M urea. The longer singlet excited-state lifetimes of the five Trp residues in folded OmpA reflect the microenvironment of detergent or lipid. Under folding conditions, removal of the periplasmic domain has only a minor effect on the microenvironment of transmembrane Trp residues, as evidenced by the modest changes in emission decays between the folded truncated and full-length proteins.
The microenvironment of each Trp residue was investigated further using fluorescence anisotropy measurements (Table 3). The tryptophan fluorescence anisotropy, which is nearly zero when OmpA is unfolded, increases to ∼0.1 upon folding in OG. This value is similar to that from a previous study that probed tryptophan anisotropy in cold propylene glycol solution.33 In both urea and OG, the anisotropies of truncated and full-length proteins are essentially identical and there is minimal difference among the five positions. Upon folding in DMPC, however, the anisotropies of the full-length mutants further increase, and some variation can be seen among the five Trp residues. The anisotropy values in Table 3 are upper limits due to contribution of vesicle scattering in polarized emission spectra. Specifically, vesicle-only polarized spectra displayed strong scattering, especially in the deep-UV region and because these polarized vesicle-only spectra were subtracted from polarized OmpA spectra, variations in the shape of the vesicle-only spectra affected the resulting final polarized OmpA spectra. Despite this source of error, the increase in anisotropy upon folding in DMPC is supported by time-resolved anisotropy data (vide infra). Solutions of truncated proteins had a greater tendency to become cloudy and exhibited strong polarization-dependent scattering. This propensity for folded, truncated OmpA to form cloudy solutions may reflect the decreased solubility of OmpA when the large, soluble periplasmic domain is removed; upon folding in DMPC, the truncated protein may enhance SUV fusion or aggregation.
Table 3.
Steady-state anisotropy of NATA and OmpA mutants unfolded in urea, folded in OG, and folded in 30°C DMPC.
| Steady-state Anisotropy | |||
|---|---|---|---|
| Urea | OG | DMPC | |
| NATA | 0.00 | 0.02 | < 0.01 |
| W7 | 0.03 | 0.06 | < 0.17 |
| W7t | 0.03 | 0.06 | ----- |
| W15 | 0.05 | 0.08 | < 0.13 |
| W15t | 0.02 | 0.08 | ----- |
| W57 | 0.06 | 0.09 | < 0.08 |
| W57t | 0.02 | 0.10 | ----- |
| W102 | 0.06 | 0.12 | < 0.15 |
| W102t | 0.01 | 0.10 | ----- |
| W143 | 0.04 | 0.09 | < 0.12 |
| W143t | 0.03 | 0.09 | ----- |
Fluorescence anisotropy decay measurements provide direct insight into structural fluctuations occurring during the excited-state lifetime of tryptophan. Local motions of tryptophan, fluctuations in the polypeptide backbone, and orientational motion of the whole molecule in the bilayer or of the vesicle occur on widely different timescales; each of these dynamics will contribute to the overall steady state fluorescence anisotropy. Figure 7 displays anisotropy decays of single tryptophan residues in OmpA mutants and NATA in urea, OG, and DMPC. Since individual residue motions are likely to be faster (<100 ps) than the instrument response time, our time-resolved fluorescence anisotropy measurements primarily reflect the kinetics of orientational changes of subsections or the whole protein. In urea, biexponential fits to the anisotropy decays reveal fast (<0.6 ns) and slow (∼2 ns) components; the decays are interpreted as segmental rotational correlation times of polypeptide subsections of unfolded OmpA in urea. These similarities in correlation times suggest that peptide regions near Trp residues in unfolded OmpA retain similar polymer-segment dynamics despite variations in local microenvironment (Figure 5 and Table 2). It appears that any residual structure which may remain in unfolded protein does not cause a change in effective local correlation times. This is consistent with the fact that the factors that affect Trp lifetime are not necessarily the same as those that determine anisotropy decay. The anisotropy values measured at the earliest times after excitation (r0) are similar for the 5 Trp residues in full-length and truncated proteins, suggesting that the “frozen” anisotropy values are identical for all Trp positions in unfolded protein.
Figure 7.

Anistropy decay of NATA, full-length and truncated OmpA mutants unfolded in urea, folded in OG, and folded in 30 °C DMPC.
When OmpA folds in detergent, the timescales of the fast and slow components increase to <2 ns and <30 ns, respectively, suggesting that the residue motion is more hindered relative to unfolded protein. Moreover, the slower tumbling time of folded protein subsections in OG (or the combined tumbling of subsections and detergent molecules) is reflected in the observation that the anisotropy values do not reach zero during the lifetime of the singlet excited state. As with unfolded OmpA, the r0 values and decays are similar among the mutants when OmpA is folded in detergent. These r0 values for unfolded and folded OmpA are consistent with previous studies on tryptophan.34,35
In a lipid bilayer environment, OmpA Trp mutants display similarly fast (<2 ns) and slow rotation correlation times. In addition, there are variations among r0 values. W7 in the full length protein is the least hindered residue, a finding supported by anisotropy decay kinetics measurements on shorter timescales (5 ns timebase, data not shown). The variations in r0 values may reflect differences in decay rates attributed to residue motion. It appears that each trp residue experiences a different microenvironment when folded in fluid DMPC vesicles. Prior studies that mapped site-specific tryptophan reorientation dynamics at different positions along the length of a transmembrane polypeptide36 and along a lipid-associated peptide37 revealed similarly complex, nonexponential anisotropy decays. Tryptophan residues located near the ends of the peptide exhibited greater flexibility than those in the middle, and all Trp residues displayed decreased mobility when the lipid bilayer was changed to a more gel-like phase.36 Since W7 is presumably the most buried trp residue based on the strong blue-shifted fluorescence as well as greatest quenching by brominated lipid (Fig. 4), our finding that W7 is the least hindered indicates that the hydrocarbon core is fluid; this fluidity may be the result of being above the lipid transition temperature. Current studies of anisotropy decay kinetics below the lipid transition temperature are in progress.
In summary, our data demonstrate that time-resolved fluorescence and anisotropy measurements provide sensitive probes of the folding state of membrane proteins and complement standard integrated intensity measurements. The results presented in this current work provide important foundations for ongoing studies of membrane protein folding based on lifetime measurements. Not only will these studies contribute to a physical understanding of membrane protein folding, but they open the door to more advanced spectroscopic studies, such as fluorescence energy transfer kinetics experiments which may reveal heterogeneous distance distributions corresponding to sub-structures.32,38,39
Acknowledgment
We thank Lukas K. Tamm at the University of Virginia for providing us with plasmids pET1102 and pET1103; Dennis Rinehart (University of Virginia), Thomas Surrey (EMBL Heidelberg), and William Ja for assistance with OmpA isolation and purification; and Jennifer C. Lee and Kate Pletneva for helpful discussions. Supported by NIH (NRSA postdoctoral fellowship to JEK; NRSA training grant to GA; GM-068461 to JRW), the Department of Energy (JRW, DE-FG02-02ER15359), the Ellison Medical Foundation (Senior Scholar in Aging to HBG), and the Arnold and Mabel Beckman Foundation.
Abbreviations
- OmpA
outer membrane protein A
- DMPC
1,2-Dimyristoyl-sn-glycero-3-phosphocholine
- 6,7-DiBr
1-Palmitoyl-2-Stearoyl(6−7)dibromo-sn-glycero-3-phosphocholine
- OG
n-octyl-β-D-glucopyranoside
- SUV
small unilamellar vesicle
- KPi
potassium phosphate
- NATA
N-acetyl-tryptophanamide
- CD
circular dichroism.
References
- 1.Henderson R, Unwin PNT. Nature. 1975;257:28. doi: 10.1038/257028a0. [DOI] [PubMed] [Google Scholar]
- 2.Barral JM, Broadley SA, Shaffar G, Hartl FU. Sem. in Cell and Dev. Biol. 2004;15:17. doi: 10.1016/j.semcdb.2003.12.010. [DOI] [PubMed] [Google Scholar]
- 3.Booth PJ, Templer RH, Meijberg W, Allen SJ, Curran AR, Lorch M. Crit. Rev. Biochem. Molec. Biol. 2001;36:501. doi: 10.1080/20014091074246. [DOI] [PubMed] [Google Scholar]
- 4.White SH, Wimley WC. Annu. Rev. Biophys. Biomol. Struct. 1999;28:319. doi: 10.1146/annurev.biophys.28.1.319. [DOI] [PubMed] [Google Scholar]
- 5.von Heijne G. Membrane Protein Assembly in vivo. In: Rees DC, editor. Advances in Protein Chemistry: Membrane proteins. Vol. 63. Elsevier Science; Boston: 2003. p. 1. [DOI] [PubMed] [Google Scholar]
- 6.Sanders CR, Myers JK. Annu. Rev. Biophys. Biomol. Struct. 2004;33:25. doi: 10.1146/annurev.biophys.33.110502.140348. [DOI] [PubMed] [Google Scholar]
- 7.Dixit SN, Waring AJ, Vanderkooi JM. FEBS Letters. 1981;125:86. doi: 10.1016/0014-5793(81)81002-2. [DOI] [PubMed] [Google Scholar]
- 8.Surrey T, Jahnig F. Proc. Natl. Acad. Sci. USA. 1992;89:7457. doi: 10.1073/pnas.89.16.7457. [DOI] [PMC free article] [PubMed] [Google Scholar]
- 9.Wang Y. Biochem. Biophys. Res. Comm. 2002;292:396. doi: 10.1006/bbrc.2002.6657. [DOI] [PubMed] [Google Scholar]
- 10.Koebnik R, Locher KP, Van Gelder P. Molec. Microbiol. 2000;37:239. doi: 10.1046/j.1365-2958.2000.01983.x. [DOI] [PubMed] [Google Scholar]
- 11.Fernandez C, Hilty C, Bonjour S, Adeishvili K, Pervushin K, Wuthrich K. FEBS Letters. 2001;504:173. doi: 10.1016/s0014-5793(01)02742-9. [DOI] [PubMed] [Google Scholar]
- 12.Arora A, Abildgaard F, Bushweller JH, Tamm LK. Nat. Struct. Biol. 2001;8:334. doi: 10.1038/86214. [DOI] [PubMed] [Google Scholar]
- 13.Pautsch A, Schulz GE. J. Mol. Biol. 2000;298:273. doi: 10.1006/jmbi.2000.3671. [DOI] [PubMed] [Google Scholar]
- 14.Bond PJ, Sansom MSP. J. Mol. Biol. 2003;329:1035. doi: 10.1016/s0022-2836(03)00408-x. [DOI] [PubMed] [Google Scholar]
- 15.Doring K, Konermann L, Surrey T, Jahnig F. Eur. J. Biophys. 1995;23:423. doi: 10.1007/BF00196829. [DOI] [PubMed] [Google Scholar]
- 16.Kleinschmidt JH, Tamm LK. Biochem. 1996;35:12993. doi: 10.1021/bi961478b. [DOI] [PubMed] [Google Scholar]
- 17.Kleinschmidt JH, den Blaauwen T, Driessen AJM, Tamm LK. Biochem. 1999;38:5006. doi: 10.1021/bi982465w. [DOI] [PubMed] [Google Scholar]
- 18.Kleinschmidt JH, Tamm LK. J. Mol. Biol. 2002;324:319. doi: 10.1016/s0022-2836(02)01071-9. [DOI] [PubMed] [Google Scholar]
- 19.Teather RM, Bramhall J, Riede I, Wright JK, Furst M, Aichele G, Wilhelm U, Overath P. Eur. J. Biochem. 1980;108:223. doi: 10.1111/j.1432-1033.1980.tb04715.x. [DOI] [PubMed] [Google Scholar]
- 20.Surrey T, Schmid A, Jahnig F. Biochem. 1996;35:2283. doi: 10.1021/bi951216u. [DOI] [PubMed] [Google Scholar]
- 21.Lakowicz J. Principles of Fluorescence Spectroscopy. Plenum; U.S.: 1999. [Google Scholar]
- 22.O'Connor DV, Phillips D. Time-Correlated Single Photon Counting. Academic Press; 1984. [Google Scholar]
- 23.Zakharian E, Reusch RN. Biochem. 2005;44:6701. doi: 10.1021/bi047278e. [DOI] [PubMed] [Google Scholar]
- 24.Szabo AG, Rayner DM. J. Am. Chem. Soc. 1980;102:554. [Google Scholar]
- 25.Reshetnyak YK, Koshevnik Y, Burstein EA. Biophys. J. 2001;81:1735. doi: 10.1016/S0006-3495(01)75825-0. [DOI] [PMC free article] [PubMed] [Google Scholar]
- 26.Eftink MR. Fluorescence techniques for studying protein structure. In: Suelter CH, editor. Methods of Biochemical Analysis: Protein Structure Determination. Vol. 35. John Wiley and Sons, Inc.; 1991. [DOI] [PubMed] [Google Scholar]
- 27.McIntosh TJ, Holloway PW. Biochem. 1987;26:1783. doi: 10.1021/bi00380a042. [DOI] [PubMed] [Google Scholar]
- 28.Bolen EJ, Holloway PW. Biochem. 1990;29:9638. doi: 10.1021/bi00493a019. [DOI] [PubMed] [Google Scholar]
- 29.Beechem JM, Brand L. Ann. Rev. Biochem. Vol. 54. Annual Reviews, Inc.; 1985. Time-resolved fluorescence of proteins. p. 43. [DOI] [PubMed] [Google Scholar]
- 30.Chen Y, Barkley MD. Biochem. 1998;37:9976. doi: 10.1021/bi980274n. [DOI] [PubMed] [Google Scholar]
- 31.Toptygin D, Savtchenko RS, Meadow ND, Roseman S, Brand L. J. Phys. Chem. B. 2002;106:3724. [Google Scholar]
- 32.Pletneva EV, Gray HB, Winkler JR. J. Mol. Biol. 2005;345:855. doi: 10.1016/j.jmb.2004.10.085. [DOI] [PubMed] [Google Scholar]
- 33.Veleur B, Weber G. Photochem. Photobio. 1977;25:441. doi: 10.1111/j.1751-1097.1977.tb09168.x. [DOI] [PubMed] [Google Scholar]
- 34.Hansen JE, Rosenthal SJ, Fleming GR. J. Phys. Chem. 1992;96:3034. [Google Scholar]
- 35.Ruggiero AJ, Todd DC, Fleming GR. J. Am. Chem. Soc. 1990;112:1003. [Google Scholar]
- 36.Vogel H, Nilsson L, Rigler R, Voges K, Jung G. Proc. Natl. Acad. Sci. USA. 1988;85:5067. doi: 10.1073/pnas.85.14.5067. [DOI] [PMC free article] [PubMed] [Google Scholar]
- 37.Clayton AHA, Sawyer WH. Biophys. J. 2000;79:1066. doi: 10.1016/S0006-3495(00)76360-0. [DOI] [PMC free article] [PubMed] [Google Scholar]
- 38.Lyubovitsky JG, Gray HB, Winkler JR. J. Am. Chem. Soc. 2002;124:5481. doi: 10.1021/ja017399r. [DOI] [PubMed] [Google Scholar]
- 39.Lee JC, Langen R, Hummel PA, Gray HB, Winkler JR. Proc. Natl. Acad. Sci. USA. 2004;101:16466. doi: 10.1073/pnas.0407307101. [DOI] [PMC free article] [PubMed] [Google Scholar]