

Abstract
The rat dentate gyrus is usually described as relatively homogeneous. Here, we present anatomic and physiological data which demonstrate that there are striking differences between the supra- and infrapyramidal blades after status epilepticus and recurrent seizures. These differences appear to be an accentuation of a subtle asymmetry present in normal rats. In both pilocarpine and kainic acid models, there was greater mossy fiber sprouting in the infrapyramidal blade. This occurred primarily in the middle third of the hippocampus. Asymmetric sprouting was evident both with Timm stain as well as antisera to brain-derived neurotrophic factor (BDNF) or neuropeptide Y (NPY). In addition, surviving NPY-immunoreactive hilar neurons were distributed preferentially in the suprapyramidal region of the hilus. Extracellular recordings from infrapyramidal sites in hippocampal slices of pilocarpine-treated rats showed larger population spikes and weaker paired-pulse inhibition in response to perforant path stimulation relative to suprapyramidal recordings. A single stimulus could evoke burst discharges in infrapyramidal granule cells but not suprapyramidal blade neurons. BDNF exposure led to spontaneous epileptiform discharges that were larger in amplitude and longer lasting in the infrapyramidal blade. Stimulation of the infrapyramidal molecular layer evoked larger responses in area CA3 than suprapyramidal stimulation. In slices from the temporal pole, in which anatomic evidence of asymmetry waned, there was little evidence of physiological asymmetry either. Of interest, some normal rats also showed signs of greater evoked responses in the infrapyramidal blade, and this could be detected with both microelectrode recording and optical imaging techniques. Although there were no signs of hyperexcitability in normal rats, the data suggest that there is some asymmetry in the normal dentate gyrus and this asymmetry is enhanced by seizures. Taken together, the results suggest that supra- and infrapyramidal blades of the dentate gyrus could have different circuit functions and that the infrapyramidal blade may play a greater role in activating the hippocampus.
Indexing terms: neuropeptide Y (NPY), brain-derived neurotrophic factor (BDNF), voltage-dependent dyes, pilocarpine, mossy fiber sprouting, seizure
The rat dentate gyrus is a laminar structure that consists of a dense layer of granule cells, an adjacent molecular layer, and a polymorphic layer (the hilus). The granule cell layer is usually described as relatively homogeneous, i.e., structurally and functionally similar along its entire length. Thus, the width of the layer and the properties of the cells within it are similar from the lateral tip of the “suprapyramidal” blade (i.e., the area closest to CA1, also referred to as the upper, dorsal, or inner blade), to the lateral tip of the “infrapyramidal” blade. The organization of the molecular layer also appears to be homogeneous. Hilar neurons appear to be distributed in a random manner, with no preference for any particular area of the hilus (Amaral, 1978). Granule cell axons, the mossy fibers, appear to be homogeneous in general (Blackstad et al., 1970; Gaarskjaer, 1981; Frotscher et al., 1994; Acsady et al., 1998), although some variations related to the supra- or infrapyramidal site of origin have been reported (Claiborne et al., 1986). The entorhinal cortical neurons that give rise to the major afferent projection to the dentate gyrus, the perforant path, appear to innervate supra- and infrapyramidal granule cells to an equal extent (Steward and Scoville, 1976; Tamamaki and Nojyo, 1993). Modulatory inputs to the dentate gyrus also appear to be organized without selectivity for either blade (Amaral and Campbell, 1986; Oleskevich et al., 1989; Oleskevich and Descarries, 1990; Freund, 1992; Frotscher et al., 1992).
Functional studies of granule cells suggest homogeneity as well. Thus, there have been few electrophysiologic reports of regional differences among granule cells. Those reports that have identified differences do not indicate that variations are related to supra- or infrapyramidal location (Liu et al., 1996; Dietrich et al., 1999; Wang et al., 2000). There are differences in the dendritic architecture of supra- vs. infrapyramidal granule cells (Claiborne et al., 1990), but whether there is a corresponding functional difference is unclear.
Some anatomic data indicate, however, that the dentate gyrus may not be so uniform as commonly assumed. For example, the axon plexus formed by calretinin-immunoreactive neurons is greater in the suprapyramidal blade (Freund and Magloczky, 1993; Nitsch and Leranth, 1993; Jiang and Swann, 1997). In addition, several studies have demonstrated that inhibitory circuitry is not uniform. Quantitation of cresyl violet-stained tissue showed that fewer “basket” cells were associated with the infrapyramidal granule cell layer (Seress and Pokorny, 1981). Later studies showed that there were greater numbers of γ-aminobutyric acid (GABA) -immunoreactive neurons in the suprapyramidal granule cell layer and hilus (Woodson et al., 1989; Czeh et al., 1997). Ribak and Peterson (1991) showed with Timm stain that inhibitory neurons of the suprapyramidal blade are more densely innervated by mossy fibers than infrapyramidal inhibitory neurons.
In addition, there appear to be variations in vulnerability within the dentate gyrus granule cell layer. The lateral tip of the suprapyramidal blade has a greater vulnerability to adrenalectomy (Sloviter, 1989). Infrapyramidal granule cells are more susceptible to hypoxia (Hara et al., 1990). Suprapyramidal GABA neurons appear more vulnerable to alcohol (Cadete-Leite et al., 1997). In aging, and after cannabinoid treatment, there are greater changes in the infrapyramidal blade than the suprapyramidal blade (Simonyi et al., 2000).
This study was undertaken to critically examine the distinctions between the supra- and infrapyramidal blades of the dentate gyrus, both in the normal adult rat, and after chronic seizures and synaptic reorganization. Some of these data have been previously reported (Goodman and Scharfman, 1999).
Materials and Methods
Animal care and use followed the guidelines set by the NIH. All chemicals were purchased from Sigma Chemical Co., unless stated otherwise. Animals were provided food and water ad libitum and maintained on a 12:12 hour light:dark cycle.
Pilocarpine and kainic acid treatment
Adult male Sprague-Dawley rats (180–240 g) were injected with atropine methylbromide (1 mg/kg s.c.) and 30 minutes later with pilocarpine hydrochloride (380 mg/kg i.p.) or with kainic acid (12 mg/kg i.p.). Diazepam (5 mg/kg i.p., Wyeth-Ayerst) was injected 1 hour after the onset of status epilepticus. The onset of status was defined as the first stage 5 seizure (Racine, 1972) that did not abate after several minutes. After approximately 5 hours, animals were injected with 2.5 ml of 5% dextrose in lactated Ringer's s.c. An apple was cut in half and laid at the bottom of the cage each day for approximately 7 days. Saline controls were the same age group as drug-treated rats, and received identical treatment (atropine, diazepam, dextrose-saline, apple), but were injected with saline instead of pilocarpine. All animals in this study that had status epilepticus had multiple spontaneous stage 5 seizures in subsequent weeks.
Anatomic methods
After deep anesthesia with an overdose of urethane (twice the anesthetic dose of 1.25 g/kg), animals were perfused through the aorta with fixative as previously described (Scharfman et al., 1999, 2000). Brains were left in the skull overnight at 4°C and removed the next day. They were post-fixed in 4% paraformaldehyde at 4°C and cut on a Vibratome (50-μm-thick sections). Starting with the ventral surface of the brain, sections were cut horizontally. After reaching the middle of the hippocampus, the brain was rotated so that the rest of the hippocampus could be cut in the coronal plane.
Timm stain
For Timm stain, animals were perfused with 0.9% saline for 3 minutes followed by 0.37% sodium sulfide in sodium phosphate buffer (pH 7.2) for 5 minutes, 0.9% saline for 2 minutes, and finally 4% paraformaldehyde (pH 7.4) for 10 minutes. Sections (50 μm) were slide mounted and processed according the methods of Sloviter (1982).
Immunocytochemistry
Neuropeptide Y, calretinin, parvalbumin, and antibody to a neuronal nuclear protein (NeuN)
Rats were perfused with 4% paraformaldehyde (pH 7.4). Sections were processed with an antibody to neuropeptide Y (NPY; polyclonal; 1:30,000; Peninsula), calretinin (polyclonal; 1:20,000; Chemicon), parvalbumin (monoclonal; 1:100,000; Sigma), or an antibody to a neuronal nuclear protein (NeuN; monoclonal; 1:5,000; Chemicon), by using free-floating sections that were initially washed twice (5 minutes each) in 0.1 M TRIS buffer (pH 7.6) and treated with 1% H2O2 made in 0.1 M TRIS buffer (pH 7.6; 30 minutes). Sections were then washed in 0.1 M TRIS buffer (pH 7.6; 5 minutes) and then treated with 0.1% Triton X-100 dissolved in 0.1 M TRIS buffer (TRIS A; 10 minutes), followed by 0.1% Triton X-100 and 0.005% bovine serum albumin (BSA) in 0.1 M TRIS buffer (TRIS B; 10 minutes). Sections were then treated with 10% normal goat serum (for polyclonal antibodies) or 10% horse serum (for monoclonal antibodies), diluted in TRIS B, for 45 minutes. Sections were subsequently washed in TRIS A (10 minutes) and then TRIS B (10 minutes) and incubated in antisera (diluted in TRIS B) for 48 hours at 4°C on a rotating shaker. On the following day, sections were treated with TRIS A (10 minutes) followed by TRIS B (10 minutes) and then incubated for 45 minutes with a biotinylated secondary antibody against rabbit immunoglobulin (Ig) G made in goat (for polyclonal antibodies, 1:1,000, Vector Labs) or a biotinylated antibody to mouse IgG made in horse (for monoclonal antibodies, 1:400, Vector Labs). Sections were washed in TRIS A (10 minutes), then 0.1% Triton X-100 and 0.005% BSA in 0.5 M TRIS buffer (TRIS D; pH 7.6; 10 minutes), and finally incubated for 1 hour in avidin-biotin horseradish peroxidase complex diluted in TRIS D (ABC Elite kit, 1:1,000; Vector Labs). Sections were washed three times in 0.1 M TRIS buffer (5 minutes each), developed in diaminobenzidine tetrahydrochloride (DAB; Polysciences; 50 mg/100 ml of 0.1 M TRIS buffer) with 200 mg of D-glucose, 0.3 mg of glucose oxidase, and 40 mg of ammonium chloride, and then washed three times (5 minutes each) in 0.1 M TRIS buffer.
BDNF
Procedures for BDNF immunocytochemistry were similar to those described above, except for the following. Animals were perfusion-fixed with 2% paraformaldehyde followed by 2% paraformaldehyde containing 0.01% glutaraldehyde. Brains were cryoprotected by immersion in 30% sucrose dissolved in 0.1 M phosphate buffer. Sections (40 μm thick) were cut on a cryostat after 2–3 days. Sections were first washed in 0.05 M potassium phosphate buffered saline (KPBS, pH 7.3) and then treated with 0.5% H2O2 in KPBS for 30 minutes. After a 5-minute wash in KPBS, sections were incubated in 10% normal goat serum, 1% BSA, and 0.4% Triton X-100 in KPBS for 20 minutes. Sections were incubated in antisera (polyclonal; 1:30,000; kindly provided by Amgen-Regeneron Partners, Tarrytown, NY) in 1% BSA and 0.4% Triton X-100 in KPBS for 48 hours at 4°C and subsequently rinsed 10 times (10 minutes each) in 0.25% BSA and 0.02% Triton X-100 in 0.01 M KPBS. Then sections were incubated in a biotinylated secondary antibody against rabbit IgG made in goat (1:1,000; Vector) in 1% BSA and 0.02% Triton X-100 in KPBS for 1 hour, followed by ABC (ABC Elite kit; 1:1,000; Vector) in 1% BSA in KPBS for 1 hour. Sections were rinsed in KPBS and then TRIS buffer, reacted with DAB (50 mg/100 ml in 0.1 M TRIS) in 50 mM NiCl2, and then washed (3 × 5 minutes) in TRIS.
Digital images
Anatomic images were produced by using an Olympus BX-51 microscope, video camera (Model DEI-750 CE, Optronics), and StereoInvestigator software (Microbrightfield, Inc.). Figures were composed by using Adobe Photoshop 6.0.
Microelectrode recording and analysis
Hippocampal slice preparation and maintenance
Hippocampal slices (400 μm thick) were prepared from rats that were deeply anesthetized with ether and decapitated. Slices were cut in ice cold buffer (“sucrose-buffer”) containing (in mM): 126 sucrose, 5 KCl, 2.0 CaCl2, 2.0 MgSO4, 26 NaHCO3, 1.25 NaH2PO4, and 10 d-glucose (pH 7.4), by using a Vibroslice (Campden Instruments). Slices were cut from the middle third of the hippocampus and were cut either in the horizontal plane or in the coronal plane. They were immediately placed on a nylon net at an interface of sucrose-buffer and warm (31–33°C), humidified (95%O2, 5% CO2) air by using a slice chamber (Fine Science Tools) that was modified as follows: (1) buffer approached the slices from their undersurface and was directed up and over them and then to a distant exterior port, (2) three additional air vents were made to increase humidity at the location where slices were placed, (3) a hole was added to allow air bubbles to exit outside the recording area, and (4) a collar was placed around the netting where slices were placed so that the fluid level could be raised, allowing slices to be semisubmerged. All slices from a given animal were placed in the recording chamber immediately after the dissection. Thirty minutes after slices were placed in the chamber, buffer was switched to one containing NaCl substituted equimolar for sucrose (“NaCl-buffer”). Recordings began 30 minutes thereafter until approximately 7 hours after the dissection. Flow rate was approximately 1 ml/min.
Microelectrode recording
General recording procedures
Intracellular recordings were made with borosilicate glass with a capillary in the lumen (0.75 mm i.d., 1.0 mm o.d.; World Precision Instruments) filled with 1 M potassium acetate (60–80 MΩ). Intracellular data were collected by using an intracellular amplifier with a bridge circuit (Axoclamp 2B, Axon Instruments), and the bridge was balanced whenever current was passed. Extracellular electrodes were made from the same glass and broken to a lower resistance (5–10 MΩ); they were filled with NaCl-buffer. The stimulating electrode was monopolar and made from Teflon-coated wire (75 μm wide, including the Teflon coating); stimuli were triggered digitally (10–200 μsec; Pulsemaster, World Precision Instruments) using stimulus isolators (100 μA; AMPI). Stimulus frequency was less than 0.05 Hz. Data were collected using a digital oscilloscope (Pro10, Nicolet Instruments) and analyzed with accompanying software as well as Origin 6.1 (OriginLab).
Stimulation and recording sites
For stimulation of the outer molecular layer at the crest, the stimulating electrode was placed adjacent to the hippocampal fissure; the crest was defined as the midpoint between the supra- and infrapyramidal blades (Fig. 1A). For extracellular recordings in the granule cell layer, the recording electrode was positioned at the border of the granule cell layer and the hilus. Recording sites were equidistant from the stimulating electrode, to ensure that a closer proximity to the stimulus site was not a reason for a larger response. Recording electrodes were ≥ 300 μm from the stimulating electrode, to avoid direct stimulation of granule cells located near recording sites.
Fig. 1.
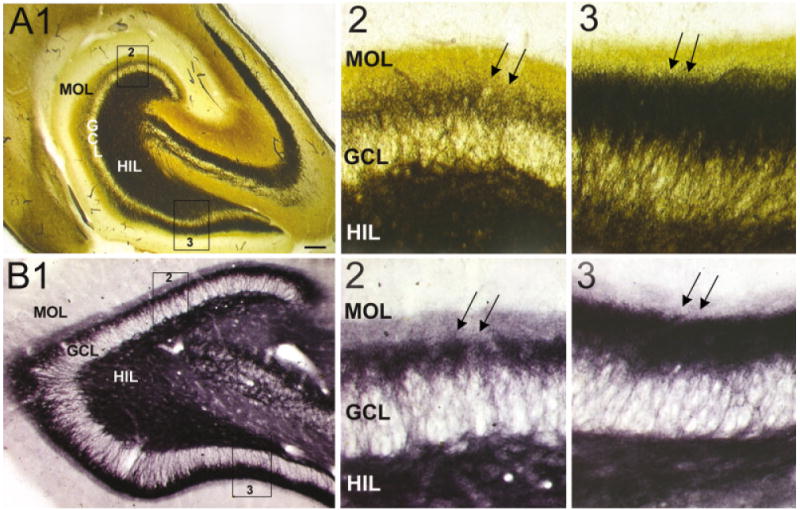
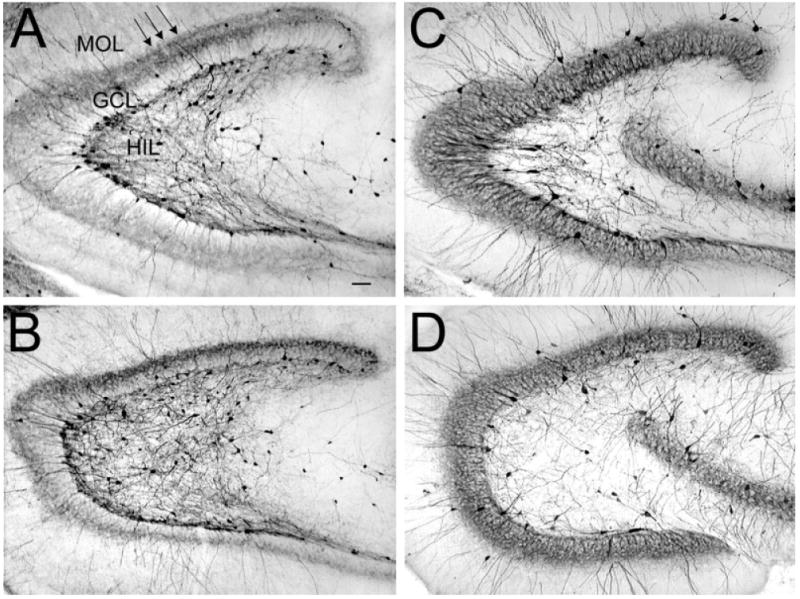
Differences in mossy fiber sprouting in the supra- and infrapyramidal blade of pilocarpine-treated rats with chronic seizures. A: A Timm-stained horizontal section of a pilocarpine-treated rat, killed 6 months after status epilepticus. A1: Timm-stained mossy fibers are distributed throughout the hilus (HIL), stratum lucidum, and the inner molecular layer. The suprapyramidal area, expanded in A2, shows less sprouting than the infrapyramidal blade, expanded in A3. MOL, molecular layer, GCL, granule cell layer. A2: The outlined section of the suprapyramidal blade shown in A1. A3: The outlined section of the infrapyramidal blade shown in A1. Note that sprouting is darker and more extensive in A3 than A2 (arrows). B: A BDNF–stained horizontal section of a different pilocarpine-treated rat than A. This animal was killed 4.5 months after pilocarpine-induced status epilepticus. B1: At low power, mossy fibers are visualized in the hilus, inner molecular layer, and area CA3. B2: The outlined section of the suprapyramidal blade shown in B1. B3: The outlined section of the infrapyramidal blade shown in B1. Note that sprouting is darker and more extensive in B3 relative to B2 (arrows). Scale bar in A1 = 200 μm in A1, 50 μm in A2,A3,B2,B3, 100 μm in B1.
A slice was accepted only if there was evidence that granule cells in both blades were viable. Slice viability was judged on the basis of evoked responses recorded in the granule cell layer to a stimulus in the outer molecular layer at the crest (Fig. 1A). Slices were used if, at both supra- and infrapyramidal recording sites, a population spike at threshold was superimposed on a large positivity (>4 mV from baseline to peak). The requirements were based on past recordings in which healthy intracellular recordings were prevalent only if this positivity was at least 4 mV.
Drug application
Brain-derived neurotrophic factor (BDNF) was a generous gift from Amgen-Regeneron partners (Tarrytown, NY). It was dissolved in 0.05% bovine albumin in sterile phosphate buffered saline (Gibco) to make a concentrated solution that was refrigerated until use. The final concentration (100 ng/ml) was obtained by dilution of an aliquot immediately before use. All glassware and pipette tips were rinsed in 0.005% bovine albumin before use of BDNF. Previous studies in our laboratory showed that bovine albumin alone did not have detectable effects on hippocampal physiology in either normal or epileptic rats (Scharfman, 1997; Croll et al., 1999; Scharfman et al., 1999).
Voltage-sensitive dyes
Hippocampal slices were prepared using a Vibratome from animals killed under CO2-induced narcosis and the same solution was used for recordings (i.e., without sucrose substitution for NaCl). Imaging of voltage was performed as described previously (Jackson and Scharfman, 1996; Demir et al., 1998). Slices were incubated in recording solution for at least 1 hour before experiments. Slices were then stained for 15 minutes by incubation in a 50 μM solution of the voltage-sensitive fluorescent dye RH414 (Molecular Probes, Eugene, OR) in recording solution at room temperature. Slices were held in position with a nylon net while perfusing with recording solution at 2–3 ml/min at room temperature. Imaging was performed in a submerged recording chamber on the stage of an upright epifluorescent microscope equipped with a 5×, 0.25 NA objective (Zeiss). The imaging system is roughly equivalent to that commercially available from RedShirtImaging (Fairfield, CT). Light provided by a 300 W tungsten-halogen bulb was filtered by a 475- to 565-nm bandpass filter and reflected onto the preparation with a 570-nm dichroic mirror. Fluorescent light was filtered with a 610-nm-long pass filter focused onto a 464-element fiber optic photodiode array. Signals were amplified as described by Wu and Cohen (1993), low-pass filtered at 500 Hz and high-pass filtered with a 100-msec time constant. Images were acquired at 0.7-msec intervals by using the computer program Neuroplex (RedShirtImaging). Slices were stimulated with 200-μsec, 100-μA pulses with a stimulus isolator through a glass micropipette filled with recording solution. Visual images were recorded for every experiment with a CCD camera. Imaging data was analyzed with Neuroplex and with additional programs written in IDL (Research Systems, Inc., Boulder, CO).
Data analysis
Extracellular recordings
Population spike amplitude was defined as the average of the descending and ascending portions of the spike, as previously described (Alger and Teyler, 1976; Scharfman and Sarvey, 1985). Paired-pulse stimulation used identical stimuli that were 20 msec apart. This interval was chosen because paired-pulse inhibition is maximal at intervals less than 25 msec, but intervals much less can produce responses that partially overlap. Paired-pulse inhibition was defined as the ratio of the population spike amplitude evoked by the second stimulus relative to the population spike amplitude evoked in response to the first stimulus (i.e., population spike 2 amplitude divided by population spike 1 amplitude). In the results, paired-pulse inhibition refers to a ratio less than 1.0 and paired-pulse facilitation refers to a ratio greater than 1.0.
Intracellular recordings
Granule cells that were impaled were first screened to ensure that they were healthy (stable resting potential > −65 mV, overshooting action potential; Table 1). Their intrinsic (membrane) properties were then characterized by using intracellularly injected current steps (0.05–1.5 nA, 150 msec) from resting potential. Analysis of intrinsic properties were made as previously described (Scharfman et al., 2000). In brief, resting potential was defined as the difference between the potential while intracellular and that recorded after withdrawing the microelectrode from the cell. Input resistance was defined by the steepest slope of an I-V curve at resting potential, based on steady-state responses to a family of current pulses (0.05–1.0 nA, 150 msec). Time constant was defined as the time to reach 63% of the steady state response to a minimal current step (0.1 nA), i.e., one that did not activate rectifying currents. Action potential (AP) characteristics were based on a single AP at threshold evoked by current injected intracellularly (a 0.1- to 0.5-nA, 150-msec pulse) at resting potential. Threshold was defined as the point on the passive response to the current pulse where the AP began. AP amplitude was measured from resting potential to peak. Half-width was the period from the start of the AP to the time when the AP reached half of the threshold amplitude. Maximum rising and decay slopes of APs were defined by the maximum dv/dt by using a resolution of 50 kHz.
TABLE 1.
Intrinsic Properties of Granule Cells in the Suprapyramidal and Infrapyramidal Blades of the Dentate Gyrus From Pilocarpine-Treated Rats1
| Resting membrane potential
(mV) |
Input resistance
(megohms) |
Time constant
(msec) |
Action potential amplitude
|
Action potential maximum slope
|
Action potential duration
|
After hyperpolarization amplitude
(mv) |
||||
|---|---|---|---|---|---|---|---|---|---|---|
| Total
(mV) |
Threshold
(mV) |
Rise
(V/S) |
Fall
(V/S) |
Total
(msec) |
Half
(msec) |
|||||
| Suprapyramidal | ||||||||||
| mean | 70.0 | 57.2 | 5.8 | 96.8 | 79.6 | 381 | 82 | 1.80 | 0.15 | 7.1 |
| SEM | 1.0 | 7.5 | 0.7 | 2.9 | 4.2 | 46 | 4 | 0.14 | 0.02 | 0.8 |
| n | 7 | 10 | 9 | 8 | 7 | 9 | 9 | 9 | 9 | 8 |
| Infrapyramidal | ||||||||||
| mean | 70.6 | 53.3 | 7.6 | 96.1 | 75.6 | 340 | 86 | 1.70 | 0.21 | 6.6 |
| SEM | 1.2 | 4.9 | 1.7 | 2.4 | 2.8 | 46 | 9 | 0.08 | 0.25 | 1.2 |
| n | 7 | 6 | 5 | 9 | 8 | 9 | 9 | 9 | 7 | 8 |
Intrinsic properties of granule cells located in the suprapyramidal or infrapyramidal blades were recorded in slices from pilocarpine-treated rats that had status epilepticus and recurrent seizures. For characterization of action potentials, an action potential was evoked at threshold using intracellular current injection (150-msec rectangular pulses) at resting potential. Afterhyperpolarization refers to the fast afterhyperpolarization immediately following the threshold action potential. All measurements are explained in the Materials and Methods section. Statistical comparisons were made using a Student's t test and no comparison was statistically different (P > 0.05).
Statistics
Statistical comparisons of data were made using a Student's t test or paired t test (PSI-plot version 6.5, Poly Software International). Significance was set at 0.05 before experiments.
Results
Anatomic demonstration of blade differences in epileptic rats
Both pilocarpine- and kainic acid–treated rats were examined 1–7 months after status epilepticus, at a time when they were exhibiting spontaneous, repetitive seizures. There were no detectable differences in the results related to the type of convulsant or the time elapsed after status epilepticus; therefore, these data were pooled.
Several anatomic methods demonstrated differences between the suprapyramidal and infrapyramidal blades of pilocarpine- and kainic acid–treated rats, mainly in the middle third of the hippocampus. In the experiments described below, NPY immunoreactivity was used in two ways. First, NPY was used as a marker of mossy fiber axons of dentate granule cells, which express NPY after seizures (Gruber et al., 1994; Schwarzer et al., 1995; Vezzani et al., 1996, 1999a). NPY immunoreactivity was also used to examine a subpopulation of hilar GABAergic neurons that colocalize NPY. In these neurons, NPY is expressed in the soma and in the axons, which project mainly to the outer molecular layer (Deller and Leranth, 1990; Milner and Veznedaroglu, 1992). There also are GABAergic neurons in the granule cell layer that colocalize NPY (Gruber et al., 1994; Schwarzer et al., 1995; Vezzani et al., 1996). Both types of GABA/NPY neurons have been reported to increase their expression of NPY after seizures (Gruber et al., 1994; Schwarzer et al., 1995; Vezzani et al., 1996), although some lose immunoreactivity because they are vulnerable to seizures and die (Sloviter, 1991; Leranth et al., 1992).
Mossy fiber sprouting
Timm stain and immunoreactivity to BDNF or NPY were used to examine mossy fiber sprouting, because all of these markers label sprouted mossy fibers (Tauck and Nadler, 1985; Turski et al., 1989; Schwarzer et al., 1995; Pollard et al., 1996; Vezzani et al., 1999a; Wenzel et al., 2000). As shown in Figure 2A, Timm stain demonstrated that sprouting was often greater in the infrapyramidal blade (n = 10/12 rats). In the two cases in which infrapyramidal sprouting was not greater, there was no detectable difference in the blades (data not shown). Thus, the suprapyramidal blade never demonstrated greater sprouting than the infrapyramidal blade. The differences in mossy fiber sprouting were evident primarily in the middle third of the hippocampus and were apparent as both an increase in the width of the sprouted band of fibers in the inner molecular layer, as well as darker Timm stain (Fig. 2A2 vs. 2A3). Sprouting gradually increased from the suprapyramidal to infrapyramidal blade, i.e., the crest region or “bend” in the dentate gyrus demonstrated an intermediate degree of sprouting, and the lateral tips of each blade were at the extremes (Fig. 2A1).
Fig. 2.
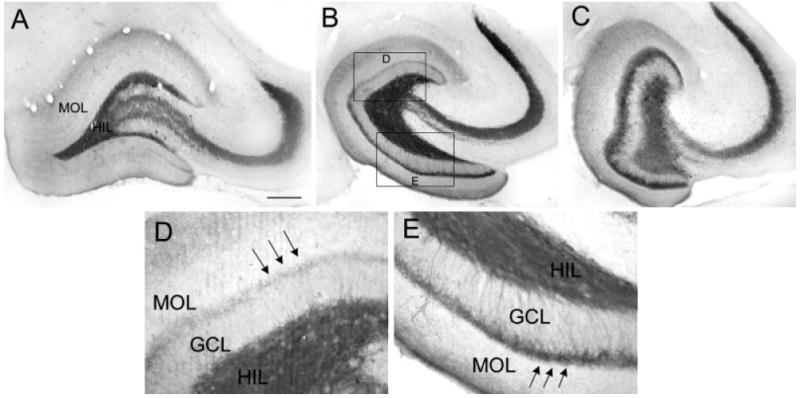
Blade asymmetry in mossy fiber sprouting equalize at the septal and temporal poles of the hippocampus. A: A coronal section through the septal hippocampus of a kainic acid-treated rat that was killed 2.5 months after status epilepticus and stained with antisera to neuropeptide Y (NPY) shows very little mossy fiber sprouting and homogeneous staining throughout the hilar mossy fibers. The sections shown in A–C were processed together. B: A horizontal section through the middle of the hippocampus of same animal as A. For A–C, the brain was rotated, after horizontal sections were cut, to examine the same hippocampus coronally at septal levels. This section, from the middle of the hippocampus, shows asymmetric sprouting (expanded in D,E). C: A horizontal section from the temporal pole of the same hippocampus as A,B. This section shows little asymmetry in sprouting. D,E: The sections outlined in B are expanded to allow better comparison of sprouting in the suprapyramidal and infrapyramidal blades. Scale bar in A = 300 μm in A–C, 75 μm in D,E.
Asymmetric sprouting was also evident when antisera to BDNF (Fig. 2B) or NPY (Fig. 3, see also Fig. 4A) were used, and again, this finding occurred primarily in the middle third of the hippocampus. In two of the animals examined with Timm stain, BDNF and NPY antisera were used on alternate sections, and asymmetry was observed with all three methods. In two additional animals, only BDNF immunoreactivity was studied and both animals demonstrated greater infrapyramidal sprouting. In 12 other animals, only NPY immunoreactivity was examined, and blade differences were demonstrated in all but 1 rat. In the exceptional animal, a difference in sprouting could not be detected between the two blades.
Fig. 3.
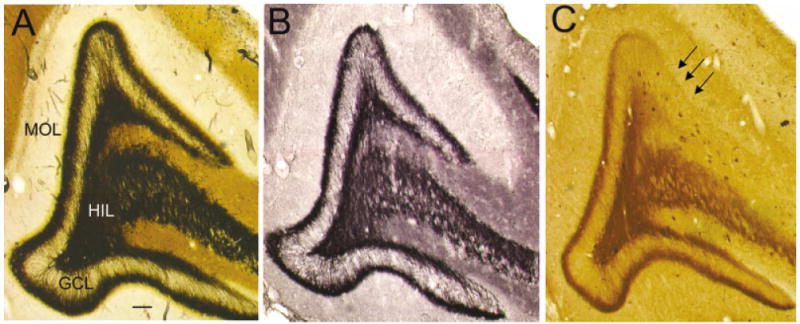
Preferential decrease in neuropeptide Y (NPY) immunoreactivity of sprouted mossy fibers at the lateral tip of the suprapyramidal blade in septal hippocampus of epileptic rats. A: A Timm-stained, coronal section from the septal hippocampus of a pilocarpine-treated rat that was killed 7 months after status epilepticus. There is relatively homogeneous sprouting in the suprapyramidal and infrapyramidal blades. MOL, molecular layer, GCL, granule cell layer; HIL, hilus. B: An adjacent section to the one in A, stained with antisera to BDNF, shows a similar degree of sprouting as in A. C: An adjacent section to the one in B, stained with antisera to NPY. Note the selective loss of NPY immunoreactivity in mossy fibers of the lateral tip of the suprapyramidal blade (arrows). Scale bar = 75 μm in A (applies to A–C).
Fig. 4.
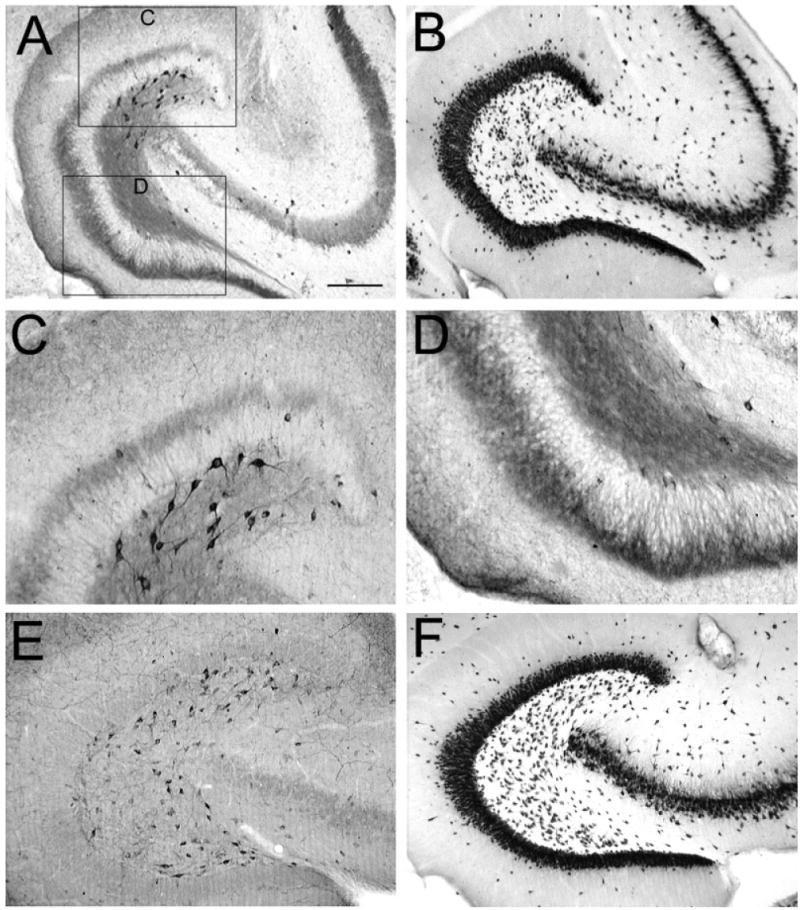
Asymmetry of neuropeptide Y (NPY) -immunoreactive mossy fibers and hilar neurons in epileptic rats. A: A NPY-stained section through the middle of the hippocampus of a pilocarpine-treated rat shows surviving hilar NPY-immunoreactive neurons are close to the suprapyramidal blade. This animal was killed 9 months after status epilepticus. B: An adjacent section to the one in A, stained with antisera to an antibody to a neuronal nuclear protein (NeuN), shows a considerable number of neurons located throughout the hilus. C,D: Areas of A are expanded in C (suprapyramidal) and D (infrapyramidal). Note the greater number of immunoreactive hilar neurons in C compared with D and the greater extent of sprouting in D relative to C. E: NPY staining in a horizontal section through the middle of the hippocampus in a saline-treated control rat that was killed 7 months after saline injection. Note the relatively homogeneous distribution of NPY-immunoreactive hilar cells in the control condition relative to the epileptic tissue shown in A. F: NeuN staining in an adjacent section to the one shown in E. Scale bar in A = 500 μm in A,B,E,F, 100 μm in C,D.
Blade differences in mossy fiber sprouting equalized at the most septal and temporal parts of the hippocampus. Thus at extreme temporal levels, sprouting was robust in all animals and appeared equivalent throughout the two blades (Fig. 3C; compare with Fig. 3A,B). At the septal pole of the same animal, sprouting could be relatively weak (Fig. 3A). When there was sprouting in the septal hippocampus, it was similar to the temporal hippocampus in that asymmetry was rare (data not shown).
When blade asymmetry was present in septal regions (n = 4), there was a notable difference in the ability to detect asymmetry among the stains used. In three of the four animals, NPY immunoreactivity demonstrated striking asymmetry but there was no clear asymmetry in adjacent sections of the same animals by BDNF or Timm stain. Figure 5 compares Timm, BDNF, and NPY staining in adjacent sections from the septal hippocampus of the same pilocarpine-treated rat. Although Timm and BDNF staining showed homogeneous sprouting throughout the section, there was a selective loss of NPY immunoreactivity in the lateral part of the suprapyramidal blade (Fig. 5). These data further suggest that the sprouted fibers of the suprapyramidal blade have differences from infrapyramidal sprouted fibers, and in particular, they indicate an asymmetry related to NPY.
Fig. 5.
Calretinin and parvalbumin immunoreactivity in pilocarpine-treated rats and saline-treated controls. A,B: Calretinin immunoreactivity in a pilocarpine-treated (A) and saline-treated (B) rat demonstrates preferential distribution of fibers in the suprapyramidal granule cell layer relative to the infrapyramidal blade (arrows). MOL, molecular layer, GCL, granule cell layer; HIL, hilus. C,D: Parvalbumin immunoreactivity in a pilocarpine-treated (C) and saline-treated (D) rat shows homogeneous immunoreactivity. Scale bar = 100 μm in A (applies to A–D).
Markers of inhibitory neurons and afferent systems
The data described above demonstrated differences in NPY immunoreactivity of sprouted fibers. We also detected an asymmetry in NPY-immunoreactive somata in the hilus. In epileptic tissue, NPY-immunoreactive somata appeared to be distributed preferentially in the area of the hilus closest to the suprapyramidal blade (Fig. 4A). This finding occurred at the same septotemporal levels where sprouting was asymmetric, i.e., the middle third of the hippocampus (Fig. 4A). In contrast, the distribution of NPY-immunoreactive hilar neurons was relatively homogeneous in control rats (Fig. 4E). NeuN-immunoreactivity in the hilus was homogeneous, both in pilocarpine-treated and control rats. Figure 4B shows NeuN immunoreactivity in a section adjacent to Figure 4A, and Figure 4F shows NeuN immunoreactivity in a section from a control rat at a similar septotemporal level. Consistent with previous studies (Gruber et al., 1994; Schwarzer et al., 1995; Vezzani et al., 1996), NPY-immunoreactive neurons from epileptic rats (Fig. 4A) were more darkly stained than in control tissue (Fig. 4E; note that in these experiments, control and epileptic tissue was processed concurrently, to allow such comparisons).
To understand how other afferents and other hilar neurons besides those immunoreactive for NPY might be distributed in epileptic rats, two other markers were used: calretinin and parvalbumin (Fig. 6). As shown in Figure 6, calretinin immunoreactivity in control rats (n = 4) had a distinct distribution, which has been described previously by others (Gulyas et al., 1992, 1996; Miettinen et al., 1992; Freund and Magloczky, 1993; Nitsch and Leranth, 1993, 1996; Martinez et al., 1999). Thus, there is an axonal plexus in the granule cell layer that represents supramammillary afferents primarily. This plexus is greater in the suprapyramidal blade than the infrapyramidal blade (Freund and Magloczky, 1993; Nitsch and Leranth, 1993; Jiang and Swann, 1997). The dentate gyrus also contains numerous calretinin-immunoreactive neurons in the hilus.
Fig. 6.
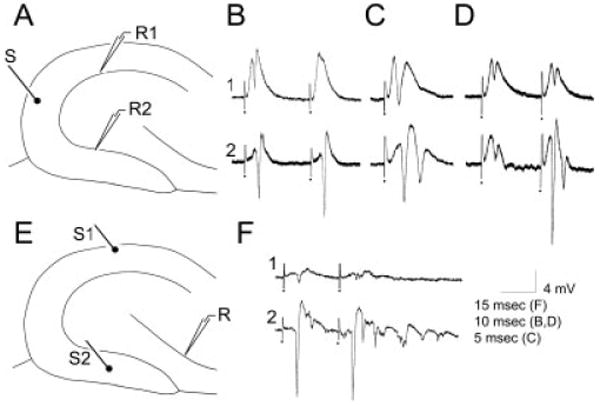
Extracellular recordings in slices from pilocarpine-treated rats with chronic seizures. A: A schematic diagram illustrates the recording arrangement for responses shown in B–D. The stimulating electrode was in the outer molecular layer at the crest (S). The stimulating electrode was monopolar and, thus, is diagrammed as a single line, with a small filled circle at the end to indicate where the electrode contacted the slice. The recording electrodes were equidistant from the stimulating electrode in the suprapyramidal (site R1) or infrapyramidal (site R2) blade. For this and all other dentate gyrus recordings, recording electrode depth was 50 μm; similar results were obtained at other depths. B: Responses to paired stimulation (identical stimuli triggered with a 20-msec interstimulus interval) of the outer molecular layer (as shown in A), recorded in the suprapyramidal (1) or infrapyramidal (2) blades. Stimuli evoked larger population spikes and less paired-pulse inhibition in the infrapyramidal blade. In this and other figures, the dots indicate the stimulus artifact. Stimulus artifacts were truncated. C: In a different slice, a single stimulus to the outer molecular layer (as shown in A) evoked one population spike in the suprapyramidal blade and two in the infrapyramidal blade. D: In a different slice, a pair of stimuli were triggered so that the population spike amplitudes evoked in response to the first stimulus were similar in amplitude; this was achieved by using a lower stimulus strength for the infrapyramidal blade recording than the suprapyramidal blade recording. Note that there was paired pulse inhibition at the suprapyramidal site but paired-pulse facilitation at the infrapyramidal site. E: A schematic diagram of the recording arrangement for the responses shown in F. The stimulating electrode was placed in the outer molecular layer in the center of the suprapyramidal blade (site S1) or the infrapyramidal blade (site S2). The recording site (R) was the pyramidal cell layer at the junction of area CA3b and CA3c. The depth of the recording was approximately 50 μm deep, where the maximal response was recorded in response to both stimuli. Similar results were obtained from other sites in area CA3b-c. F: The responses to two stimulation of site S1 and site S2 as shown in E. The response to stimulation of the suprapyramidal site (S1) was smaller than the response to the infrapyramidal stimulus (S2). Stimulus strength was identical. Stimuli were triggered 10 msec apart. The same result occurred regardless of the order of stimulation (i.e., site S1 was tested first or site S2 was first).
In our saline-treated control rats, calretinin-immunoreactivity had the characteristics described above (Fig. 6). In epileptic rats, calretinin-immunoreactivity was similar to controls (Fig. 6A,B; six of six pilocarpine- and four of four kainic acid–treated rats). Thus, the distribution of calretinin-immunoreactive fibers was asymmetric but calretinin-immunoreactive somata were not.
Parvalbumin immunoreactivity showed no preferential distribution in the dentate gyrus in all control rats that were examined (Fig. 6; n = 4), as has been previously shown (Kosaka et al., 1987; Sloviter, 1989; Baimbridge, 1992). Immunoreactivity was evenly distributed in all pilocarpine-treated rats as well (Fig. 6C,D; n = 13).
In summary, structural asymmetry was demonstrated in epileptic rats by the following: (1) sprouting, (2) the distribution of NPY-immunoreactive hilar neurons, (3) a loss of NPY in the suprapyramidal blade of septal hippocampus, and (4) the axon plexus of calretinin-immunoreactive neurons. In saline-treated rats, asymmetry was only evident in the axon plexus of calretinin-immunoreactive neurons. The following characteristics were relatively homogeneous in both control and epileptic rats: (1) the distribution of all hilar neurons, (2) the distribution of calretinin-immunoreactive somata, and (3) parvalbumin-immunoreactivity.
Recordings from slices of epileptic rats
Extracellular recordings
Rats that had pilocarpine-induced status epilepticus and repeated spontaneous seizures were examined electrophysiologically between 2 and 10 months after pilocarpine injection (n = 7). Data were similar regardless of age; therefore, data were pooled. The stimulating electrode was placed in the outer molecular layer at the crest in horizontal slices from the middle of the hippocampus (Fig. 1A). Care was taken to place the stimulating electrode equidistant from the recording electrodes in the two blades to avoid biasing the results, because in general, stimulating closer to a recording site will evoke a larger response. Despite this symmetry in recording conditions, a single stimulus evoked a larger population spike in the infrapyramidal blade relative to the suprapyramidal blade of the same slice (n = 12 slices from 10 rats; Fig. 1B,C). Thus, for stimuli that evoked a 1.0–2.0 mV population spike in the suprapyramidal recording site, the population spike evoked at the infrapyramidal site was 4.8 ± 0.7 mV (n = 12; paired t test, P < 0.05). There were no slices that exhibited a larger population spike in the suprapyramidal blade. The larger responses in the infrapyramidal blade occurred whether the stimulus was relatively weak (e.g., 10–50 μsec, 100 μA) or strong (100–200 μsec, 100 μA). Interestingly, the asymmetry persisted when the stimulating electrodes were positioned slightly differently in the molecular layer, e.g., closer to the suprapyramidal blade recording site or further from it (see below).
An additional, striking manifestation of asymmetry was evident from these extracellular recordings. Multiple population spikes could be evoked by a single stimulus at infrapyramidal blade sites (6 of 12 slices, Fig. 1C; in the other 6 slices, only one spike was evoked) but never in suprapyramidal locations (12 of 12 slices).
Another distinction between molecular layer-evoked responses in the supra- vs. infrapyramidal blades was a relative lack of paired-pulse inhibition in the infrapyramidal blade. As shown in Figure 1B,D, paired-pulse facilitation occurred in the infrapyramidal blade but not the suprapyramidal blade (n = 12; 20-msec interstimulus interval; Fig. 1B,D). Responses to paired pulse stimulation were compared in two ways. First, as described above, responses to pairs of identical intensity were compared (Fig. 1B). Second, stimulus strength was adjusted so that the population spike amplitude evoked by the first stimulus was identical in both blades; this required lowering the stimulus intensity for infrapyramidal blade recordings (Fig. 1B). As shown in Figure 1B,D, the results demonstrated that there was less paired-pulse inhibition in the infrapyramidal blade with either stimulus strength. Thus, regardless of the method used to compare paired-pulse inhibition, the same result occurred: paired-pulse inhibition was weak or not apparent at all in the infrapyramidal blade.
Finally, differences between the suprapyramidal and infrapyramidal blades also occurred when the responses of CA3 pyramidal cells to stimulation of the two blades were compared. For these recordings, the stimulating electrodes were placed in the middle molecular layer of the suprapyramidal or infrapyramidal blades, and the recording site was in the pyramidal cell layer of CA3, at the border of CA3b and CA3c (Fig. 1E). Stimulation of the suprapyramidal molecular layer evoked very little response in area CA3, but stimulation of the infrapyramidal molecular layer of the same slice evoked multiple population spikes (Fig. 1F; n = 4 of four slices from four different animals).
Notably, slices from the temporal pole did not demonstrate asymmetry. These slices were also cut in the horizontal plane and were from the same group of animals as those described above, in which slices from the middle of the hippocampus were used. Thus, in five slices (from five animals), there was no detectable difference in the population spike amplitude evoked by a molecular layer stimulus at the crest (suprapyramidal blade: 4.24 ± 0.58 mV; infrapyramidal: 3.86 ± 0.40 mV; paired t test, P > 0.05). In these animals, one hemisphere was used for slices and the other was immersion-fixed for NPY immunocytochemistry, which demonstrated equivalent sprouting at the temporal pole and asymmetry in the middle of the hippocampus (data not shown).
The results described above and shown in Figure 1 used a stimulus site at the crest of the dentate gyrus and recording sites approximately 300–500 μm away in either the suprapyramidal or infrapyramidal blades. To determine whether this stimulus site biased the results by preferentially activating the infrapyramidal blade, other stimulus sites in the molecular layer were tested. The same recording positions were used, but the stimulus site was moved either closer to the infrapyramidal blade or suprapyramidal blade (approximately 150 μm from the recording electrode). Even under these conditions, the infrapyramidal blade population spike was larger (n = 6 of six slices tested; data not shown).
To ensure that the molecular layer stimulus sites, regardless of proximity to the recording electrode, preferentially activated the infrapyramidal blade, recordings were made in the molecular layer to examine whether infrapyramidal excitatory postsynaptic potentials (EPSPs; recorded extracellularly) were largest. In these recordings, several sites in the outer and middle molecular layer adjacent to the recordings in the granule cell layer were tested to be sure that the maximal EPSPs were compared. In all slices tested (n = 6), the extracellularly recorded EPSP in the suprapyramidal blade was similar or larger in amplitude than the infrapyramidal blade; the slopes of the rising phases of the EPSPs were similar (Fig. 7).
Fig. 7.
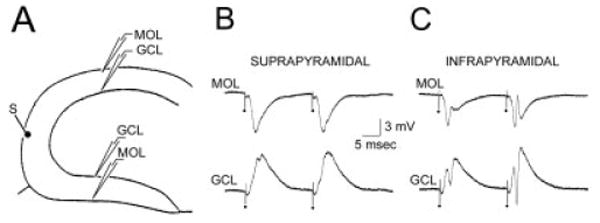
Extracellular recordings of somatic and dendritic field potentials in response to molecular layer stimulation. A: A schematic of the recording and stimulation sites shows a single stimulus site in the outer molecular layer at the crest (S), and two pairs of recording sites: one in the suprapyramidal blade and the other in the infrapyramidal blade. For each pair of sites, one recording electrode was placed at the granule cell layer/hilar border (GCL) and the other site was positioned in the outer molecular layer at a location adjacent to the GCL electrode and at a depth that produced the maximal field excitatory postsynaptic potentials (MOL). B: Responses recorded simultaneously in the suprapyramidal blade GCL and MOL to a pair of identical crest stimuli, as shown in A. C: Responses of the infrapyramidal blade GCL and MOL recording sites to the same stimuli as those that were used to evoke the responses shown in B.
Intracellular recording
Intracellular recordings in slices from pilocarpine-treated rats failed to reveal any differences in intrinsic properties between granule cells in the suprapyramidal vs. infrapyramidal blades (Table 1). However, stimulation of the outer molecular layer often produced all-or-none bursts of action potentials in infrapyramidal granule cells (Fig. 8). In 5 of 15 (33%) infrapyramidal cells (10 slices from six different animals), a single stimulus evoked an all-or-none epileptiform burst (Fig. 8). Such bursts never were recorded from granule cells in the suprapyramidal blade of the same slice (Fig. 8; n = 0 of 16, 0%; the infra- and suprapyramidal cells were recorded from the same slices). Instead, the same stimulus only evoked a single AP in suprapyramidal blade cells (Fig. 8), similar to that of control rats.
Fig. 8.
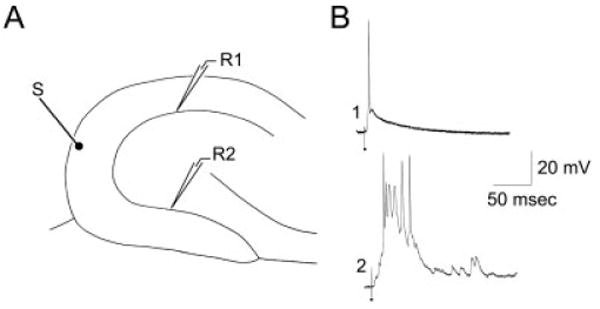
Intracellular recordings from granule cells of the suprapyramidal and infrapyramidal blades of pilocarpine-treated rats with chronic seizures. A: A schematic of the recording and stimulating electrodes used to obtain the recordings shown in B. The stimulating electrode (S) was in the outer molecular layer at the crest. Intracellular recordings were made from granule cells of either the suprapyramidal blade (site R1) or the infrapyramidal blade (site R2). B: The response of two different granule cells that were sequentially impaled in the same slice. The same stimulus that triggered a single action potential in the suprapyramidal granule cell (1) evoked several action potentials in the infrapyramidal blade cell (2).
BDNF
In previous studies, exposure of slices from epileptic pilocarpine-treated rats to BDNF led to spontaneous epileptiform discharges in granule cells in the suprapyramidal blade, and these could be recorded either extracellularly in the granule cell layer or intracellularly (Scharfman et al., 1999). To compare the activity induced by BDNF in the supra- and infrapyramidal blades, extracellular recordings were made in the two blades simultaneously as BDNF was added to the buffer flowing over the slices (i.e., “bath-application”; Fig. 9A). Spontaneous epileptiform events recorded in the infrapyramidal blade thereafter were larger in amplitude and longer in duration than those in the suprapyramidal blade (Fig. 9B; n = 8 slices from five animals). In two of the eight slices, spontaneous events were recorded only in the infrapyramidal blade; no spontaneous activity was recorded in the suprapyramidal blade at all, despite testing many different sites of the suprapyramidal granule cell layer. For those six slices in which activity was recorded in both blades, the mean amplitude of bursts in the suprapyramidal blade was 9.33 ± 0.71 mV and, in the infrapyramidal blade, it was 2.76 ± 0.31 mV, which was significantly different (paired t test, P < 0.05). In the infrapyramidal blade, the duration of spontaneous bursts was 0.5–6.2 seconds in five slices and over 60 seconds in three slices, whereas all events in the suprapyramidal blade lasted less than 0.25 seconds.
Fig. 9.
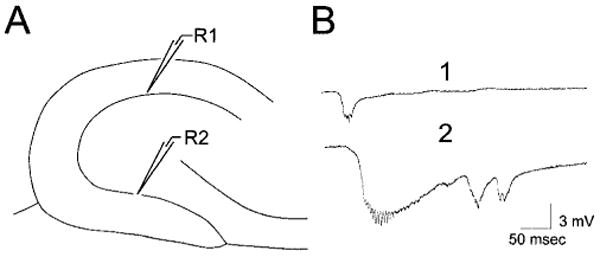
Spontaneous epileptiform burst discharges after exposure of slices from pilocarpine-treated rats to BDNF. A: A schematic of the recording arrangement used to obtain the responses shown in B. There were two recording sites: one in the suprapyramidal blade (site R1) and the other in the infrapyramidal blade (site R2). B: Spontaneous epileptiform burst discharges recorded from the suprapyramidal (B1) and infrapyramidal (B2) blades of the same slice. BDNF (100 ng/ml) was added to the buffer that flowed over the slices (“bath-application”) 60 minutes before the recordings. The spontaneous events corresponded to large depolarizations and repetitive action potential discharge in granule cells (Scharfman et al., 1999). Note that spontaneous events were larger in amplitude and longer lasting in the infrapyramidal blade.
Recordings from normal rat hippocampal slices
Molecular layer stimulation
Analogous experiments were conducted in age-matched, saline-treated rats (n = 4), and untreated adult rats (n = 10). Results were similar; therefore, data were pooled. Stimulation of the outer molecular layer at the crest evoked larger population spikes in the infrapyramidal blade than the suprapyramidal blade in the majority of slices (Fig. 10A,B, n = 14 of 20 slices; 67%). Thus, for stimuli that evoked a 0.75–1.0 mV population spike in the suprapyramidal recording site, the population spike evoked at the infrapyramidal site was 3.4 ± 0.5 mV (n = 14; paired t test, P < 0.05). In the remaining 6 of 20 (33%) of slices, responses were similar in the supra- and infrapyramidal blades (Fig. 10C). Thus, these differences were modest compared with recordings from epileptic tissue. As for epileptic tissue, no slices exhibited a larger population spike in the suprapyramidal blade and asymmetry was independent of the position of the molecular layer stimulating electrode, because when the stimulating electrode was placed approximately 250 μm closer to the suprapyramidal blade recording site, the population spike recorded at the infrapyramidal blade site was still larger than the population spike recorded at the infrapyramidal blade site (n = 5 of five slices tested).
Fig. 10.
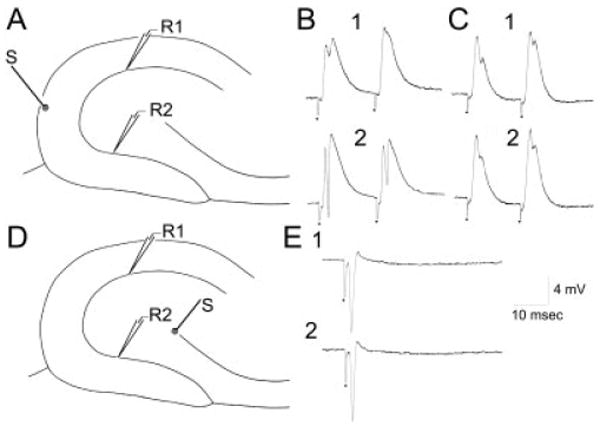
Extracellular recordings from the suprapyramidal and infrapyramidal granule cell layer of normal adult rat hippocampal slices, in response to stimulation of the molecular layer or hilar/CA3 border. A: Schematic diagram of the recording arrangement for responses shown in B and C. The stimulation site was the outer molecular layer at the crest (S). Recording sites were equidistant from the stimulus site, either in the suprapyramidal (R1) or infrapyramidal blade (R2). B: Responses to two identical stimuli (20-msec interval) are shown, recorded at site 1 (B1) or site 2 (B2). Note that the same stimulus that evoked a small population spike in the suprapyramidal blade evoked a large population spike in the infrapyramidal blade. C: In a different slice from B, a similar recording and stimulating arrangement was tested and responses were similar in the two blades. Thus, blade asymmetry was not always present in normal rats. D: Schematic diagram of the recording arrangement for responses shown in E. The stimulus site was at the border of the hilus and the end of the CA3c pyramidal cell layer (S). Recording sites were similar to those in A. E: A fixed stimulus evoked similar antidromic population spikes in the two blades.
Slice preparation
Asymmetry in evoked responses to molecular layer stimulation occurred independent of the angle used to prepare slices. Thus, in slices that were cut in the coronal plane (six slices in three different animals), stimulation of the molecular layer at the crest produced larger population spikes in the infrapyramidal blade in the majority of slices (n = 6 of eight slices, 75%). This finding occurred whether the stimulating electrode was precisely positioned at the crest, or placed in the suprapyramidal blade molecular layer, approximately 200 μm from the crest.
Paired-pulse inhibition
There was no statistically significant differences between the two blades in paired-pulse inhibition (Fig. 10B,C). For a stimulus intensity that evoked a 1.0–2.0 mV population spike at the suprapyramidal recording site, the ratio of the second population spike to the first was 0.2 ± 0.3 for the suprapyramidal blade recording site and 1.0 ± 0.9 for the infrapyramidal blade (Fig. 10; n = 14; paired t test, P > 0.05). When the stimulus strength was lowered to evoke a 1.0–1.2 mV population spike at the infrapyramidal site, so that comparisons could be made when the first population spike was similar in amplitude at both recording sites, paired-pulse inhibition was also similar to that in the suprapyramidal blade (0.9 ± 0.9 mV).
There was substantial variability in paired-pulse inhibition in the infrapyramidal blade. Indeed, several slices demonstrated paired-pulse facilitation rather than inhibition. In contrast, paired-pulse facilitation never occurred in the suprapyramidal blade recordings (Fig. 10B,C). Thus, mean paired-pulse inhibition was not statistically different, but there were several slices that showed pronounced asymmetry: the infrapyramidal blade exhibited paired-pulse facilitation, whereas the suprapyramidal blade exhibited paired-pulse inhibition.
Antidromic stimulation
To address intrinsic excitability in granule cells of the two blades, antidromic stimulation was tested by stimulating the end of the CA3c pyramidal cell layer at the border with the hilus (Fig. 10D). Recording sites were at locations that were equidistant from the stimulating electrode, either in the suprapyramidal or infrapyramidal blade (Fig. 10D). The antidromic population spike that resulted was similar in amplitude (Fig. 10E) in most slices (18 of 20, 90%), regardless of stimulus strength. Thus, for an antidromic population spike that was approximately 5 mV in amplitude (5.0 ± 0.5 mV) at the suprapyramidal recording site, the same stimulus produced a population spike that was 5.1 ± 0.7 mV at the infrapyramidal site (Fig. 10E; n = 5 slices; paired t test, P > 0.05).
Intracellular recordings
To compare intracellularly recorded synaptic responses of granule cells, stimulating and recording sites were similar to those used for molecular layer stimulation (Fig. 11A). Comparisons were made between supra- and infrapyramidal neurons of the same slice. In the majority of suprapyramidal granule cells (n = 7 of 10; 70%), higher stimulus intensities were required to evoke EPSPs that reached threshold for action potential generation compared with infrapyramidal blade cells in the same slice (Fig. 11). Infrapyramidal blade cells never required higher currents than suprapyramidal blade cells. The mean current required to reach threshold for stimulus-evoked action potentials was 42.0 ± 6.8 μsec for infrapyramidal blade granule cells and 100.0 ± 12.2 μsec for suprapyramidal blade granule cells (n = 10; paired t test, P < 0.05). In some cells in the suprapyramidal blade, even the maximal intensity failed to reach threshold. Stimulus strengths were not tested above 200 μsec, 100 μA, because such currents spread beyond the outer two thirds of the molecular layer.
Fig. 11.
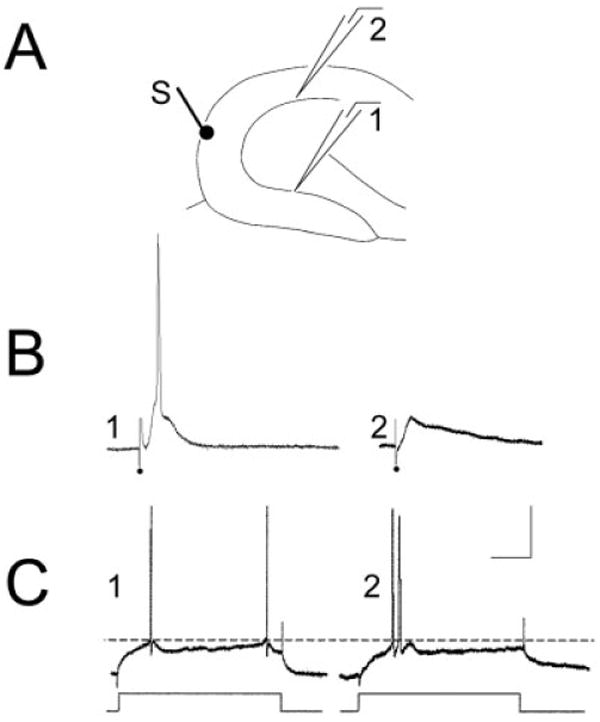
Intracellular recordings of granule cells in the suprapyramidal and infrapyramidal blades of the same slice. A: Schematic diagram of the recording and stimulating arrangement used to record responses in B and C. The stimulating electrode (S) was placed at the outer molecular layer at the crest. Recording electrodes were equidistant from the stimulating electrode in the infrapyramidal blade (site 1) or suprapyramidal blade (site 2). B: Intracellularly recorded responses of an infrapyramidal cell at site 1 (left) and suprapyramidal cell at site 2 (right). The response to a 20-μsec, 100-μA stimulus evoked an action potential in the suprapyramidal cell but not the infrapyramidal cell. Even increasing the stimulus to 200 μsec, 100 μA did not evoke an action potential in the suprapyramidal cell (not shown). However, robust excitatory postsynaptic potentials were recorded in both cells. C: Responses of the same cells in B to intracellular injection of current. These responses show that threshold for action potential generation was a similar membrane potential in the two cells (a dotted line is provided to more easily compare threshold membrane potential). Intracellular current was injected as rectangular current pulses (150-msec duration). Calibration bar in C = 20 mV, 20 msec in B; 25 mV, 0.6 nA, 35 msec in C.
Voltage-sensitive dye recordings
To examine evoked responses at multiple sites simultaneously throughout the dentate gyrus, imaging experiments were conducted with voltage-sensitive dye. A stimulus of 200 μsec, 100 μA, applied in the middle molecular layer at the crest evoked responses through the molecular layer, spreading in both directions into the upper and lower blades (see also Jackson and Scharfman, 1996). However, responses in the infrapyramidal blade were consistently greater than responses in the suprapyramidal blade. When the amplitude of the fluorescence change was encoded as color to provide a map of the depolarizing response, the responsive region appeared as a red area extending well into the infrapyramidal blade (Fig. 12). By contrast, little red was evident in the suprapyramidal blade, indicating that the fluorescence change in that region was much smaller. This asymmetry was observed in six of six slices.
Fig. 12.
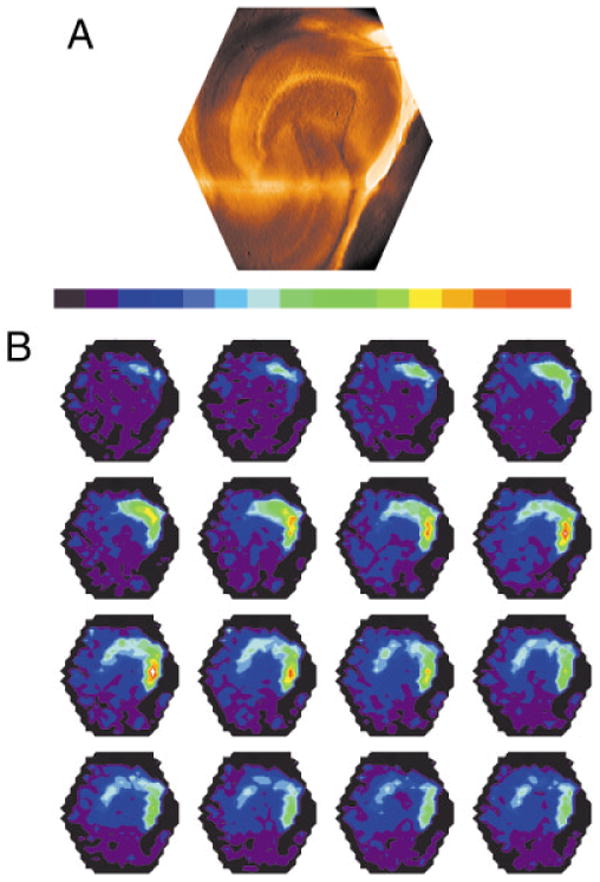
Asymmetry of fluorescent images in normal slices. A: A video image of a slice from which voltage imaging data (shown in B) was taken. This view shows the orientation and location of the slice as a reference for the fluorescence images in B. The microelectrode used for stimulation can be seen at the top of the image, in the molecular layer at the crest of the dentate gyrus. CA3 is down; CA1 is to the right. B: A time sequence of fluorescence images from the slice shown in A shows the spread of depolarization after the application of a 200-μsec, 100-μA stimulus to the crest in the middle molecular layer. Intensity was encoded in color according to the bar above, with higher fluorescence encoded as red and lower fluorescence encoded as blue. The images were taken at 0.7-msec intervals starting with the first frame after stimulation, with the sequence from left to right and top to bottom. The first row shows the initiation of a local depolarization as a small light green spot corresponding to the site of the stimulus pipette visible in A. The red signifies a large depolarization evoked by the stimulus, extending well into the infrapyramidal blade.
The peak stimulus-evoked fluorescence change was normalized to baseline fluorescence (ΔF/F) and averaged at equivalent positions for these six slices. The magnitudes of the fluorescence changes were more than threefold greater in the infrapyramidal blade than in the suprapyramidal blade. These fluorescence changes were then normalized to the value in the crest and plotted (Fig. 13). The difference between responses in the upper and lower blades were statistically significant (P < 0.05). Thus voltage imaging showed that a stimulus applied to the molecular layer at the crest evoked responses that were larger and spread more deeply into the infrapyramidal blade than the suprapyramidal blade.
Fig. 13.
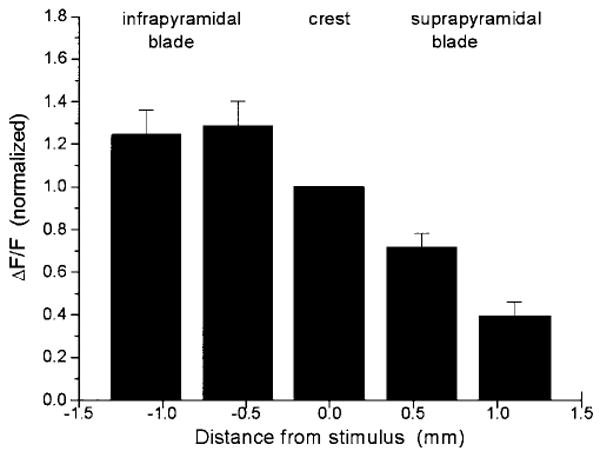
Quantification of fluorescent signals evoked by molecular layer stimulation. The peak value of ΔF/F was measured in response to a 200 μsec, 100 μA applied to the middle molecular layer at the crest. Responses are in the middle molecular layer at the indicated distances from the stimulus electrode. Responses were normalized to that in the crest, where the mean value of ΔF/F was 0.0023 ± 0.0004. Means with standard errors are shown for measurements in six slices.
Discussion
Summary
The results demonstrate both anatomic and physiological differences between the suprapyramidal and infrapyramidal blades of the adult rat dentate gyrus. In epileptic rats, these differences included greater mossy fiber sprouting in the infrapyramidal blade and preferential distribution of NPY-immunoreactive neurons in the suprapyramidal hilus. Recordings showed robust differences in excitability between the suprapyramidal and infrapyramidal blades in slices of epileptic rats, and more subtle asymmetry in control tissue. Taken together with previous anatomic reports of structural asymmetry in the normal dentate gyrus (Seress and Pokorny, 1981; Woodson et al., 1989; Ribak and Peterson, 1991; Freund and Magloczky, 1993; Nitsch and Leranth, 1993; Czeh et al., 1997; Jiang and Swann, 1997), the results suggest that the dentate gyrus is not homogeneous under normal conditions or after seizures.
Epileptic rats
Striking differences between the suprapyramidal and infrapyramidal blades were demonstrated in rats with chronic seizures. They were demonstrated in two different animal models of epilepsy, both involving status epilepticus and recurrent limbic seizures. They could be shown physiologically in slices that were cut either in the coronal or horizontal axis, either with stimulation of the slice or with pharmacologic stimuli (BDNF). Asymmetry waned at the septal and temporal poles of the hippocampus, and this finding may be one of the reasons why it has not been reported previously.
Anatomy
One of the first questions that arose upon examination of the anatomic results was the possibility that differential fixation could have contributed to an appearance of asymmetry. This reason seems unlikely given that the data were obtained with three different types of fixative: sulfide (Timm), paraformaldehyde (NPY), and paraformaldehyde-glutaraldehyde (BDNF). One can also argue against uneven fixation, as well as uneven section thickness, because parvalbumin staining showed uniform immunoreactivity, and these sections were adjacent to sections that showed asymmetry by using other staining methods. Therefore, if fixation were unequal or section thickness varied within a given section, it should have been apparent in at least some of the parvalbumin-stained sections, but it was not. Still, one could argue that parvalbumin antisera is relatively insensitive to poor fixation or section thickness.
But there are other arguments. For example, calretinin immunoreactivity was stronger in the area of the suprapyramidal blade where NPY antisera stained sprouted mossy fibers weakly. In addition, NPY-immunoreactive neurons were very darkly stained in the suprapyramidal region where NPY immunoreactivity of mossy fibers was weak. Thus, in the same area of a given section, a single antisera-stained somata strongly but the fibers stained weakly. In other areas, for example the outer molecular layer, fiber staining was strong, but somata were rarely stained.
It is also possible that apparent asymmetry could occur if sections were cut at variable angles, i.e., tangential to the layers in the infrapyramidal blade but not tangential to the layers in the suprapyramidal blade. This asymmetry might occur if the hippocampus becomes shrunken and distorted after seizures, as indeed occurs. However, further inspection of the Timm-stained material (for example, Fig. 2A) suggested that shrinkage and distortion are unlikely to explain the results. Thus, the width of the band of infrapyramidal sprouted fibers was greater than the width of the suprapyramidal band, but the widths of the adjacent granule cell layers were similar. If the infrapyramidal blade were cut tangentially, both the inner molecular layer and the adjacent granule cell layer should be similarly distorted.
Physiological asymmetries and their relationship to anatomic asymmetry
Several blade differences were shown in epileptic rats that suggest greater excitability of infrapyramidal blade neurons. In addition, when there were few differences detected with anatomic methods in temporal slices, there were few physiological differences. These data argue that infrapyramidal blade excitability may relate, or even depend, on the anatomic differences. Indeed, this possibility supports the hypothesis in the literature that mossy fiber sprouting increases dentate gyrus excitability, based on anatomic (Frotscher and Zimmer, 1983; Represa et al., 1993; Franck et al., 1995; Okazaki et al., 1995; Sutula et al., 1998; Wenzel et al., 2000) and physiological data (Tauck and Nadler, 1985; Sutula et al., 1992, 1998; Dudek et al., 1994; Pollard et al., 1996; Wuarin and Dudek, 1996; Patrylo and Dudek, 1998; Molnar and Nadler, 1999; Okazaki et al., 1999).
However, it is not clear that mossy fiber sprouting only has effects that are excitatory. There are multiple neuroactive compounds in sprouted fibers. Not only do they contain glutamate, but they also contain BDNF, NPY, and other substances. Although BDNF appears to enhance mossy fiber transmission (Scharfman, 1997; Scharfman et al., 1999), NPY has been shown to have primarily inhibitory effects on synaptic transmission (Vezzani et al., 1999b; but see also Gariboldi et al., 1998).
Other factors, such as the distribution of inhibitory neurons or various afferents to the dentate gyrus, also could influence excitability, independent of mossy fiber sprouting. Thus, the relative paucity of NPY-immunoreactive inhibitory neurons close to the infrapyramidal blade and the relatively weak axonal projection of calretinin-immunoreactive fibers to the infrapyramidal blade could contribute to greater infrapyramidal excitability. It is important to bear in mind, however, that the proximity of NPY-immunoreactive somata to the suprapyramidal blade does not prove that their axons do. Furthermore, conclusions should also be made with caution with respect to interpretation of altered NPY immunoreactivity. Indeed, whether the changes in NPY-immunoreactive cell distribution represent a loss of infrapyramidal hilar NPY neurons, a loss of peptide in those neurons, or new expression in suprapyramidal hilar neurons is unclear.
In summary, the greater degree of sprouting in the infrapyramidal blade, preferential distribution of NPY-immunoreactive neurons in the suprapyramidal hilus, and greater axon plexus of calretinin-immunoreactive cells in the suprapyramidal granule cell layer could have contributed to the greater excitability that was evident in the infrapyramidal blade recordings from epileptic rats. There may also be other reasons for the changes in excitability. Regardless of their relationship, however, the striking anatomic and physiological differences in the blades are important to consider because of their potential implications for hippocampal signal processing.
Blade differences in normal rats
Our data show a potential physiological correlate to the studies that have shown anatomic asymmetry in the normal rat dentate gyrus (Seress and Pokorny, 1981; Woodson et al., 1989; Ribak and Peterson, 1991; Freund and Magloczky, 1993; Nitsch and Leranth, 1993; Czeh et al., 1997; Jiang and Swann, 1997). One of the potential confounds with these experiments was any bias that the stimulus site at the crest of the molecular layer might produce. This site could have activated the infrapyramidal blade preferentially, for reasons currently unclear. However, stimulus sites closer to the suprapyramidal blade were used, as well as sites closer to the infrapyramidal blade, and the results were the same. Furthermore, extracellularly-recorded EPSPs were often larger in the suprapyramidal blade. We, therefore, hypothesize that, under normal conditions, there is weak asymmetry in the inhibition of granule cells and that this normal asymmetry is accentuated after seizures by asymmetric mossy fiber sprouting and other changes.
Significance
These differences are significant because there have been some discrepancies in the literature concerning the changes in granule cell excitability after seizures, as well as the changes that occur after other experimental manipulations such as those involving long-term potentiation. Dentate gyrus excitability may be poorly estimated if sites in both supra- and infrapyramidal blades are not sampled or if recording sites are restricted to one part of the septotemporal axis.
Another implication is that the granule cells of the infrapyramidal blade may activate the hippocampus more than the granule cells of the suprapyramidal blade in the epileptic condition. This possibility is supported by our comparisons of granule cell target activation (i.e., area CA3 activation) after supra- vs. infrapyramidal molecular layer stimulation. Seizure propagation through the hippocampus may be dependent on infrapyramidal blade granule cells more than the prevailing view, i.e., that the dentate gyrus as a whole acts as a relatively uniform “gate” that breaks down in an all-or-none unit before seizures can pass through (Heinemann et al., 1992; Lothman et al., 1992). The results from this study raise the possibility that, under conditions leading to seizures, the “gate” may primarily be in the infrapyramidal blade. It is also possible that trisynaptic activation of hippocampal circuits and hippocampal information processing may rely more heavily on infrapyramidal behavior than previously assumed. The results indicate the potential importance of considering blade differences when evaluating granule cell behavior, both under normal conditions as well as after seizures.
Acknowledgments
The authors thank Annmarie Curcio for technical assistance, Ruth Marshall for administrative support, and Amgen-Regeneron Partners for BDNF antisera. H.E.S. and M.B.J. received funding from the National Institute of Health and H.E.S. received funding from the Human Frontiers Science Program.
Grant sponsor: National Institute of Health; Grant number: NS37562; Grant number: NS38285; Grant number: NS37212; Grant sponsor: the Human Frontiers Science Program.
Literature Cited
- Acsady L, Kamondi A, Sik A, Freund TF, Buzsaki G. GABAergic cells are the major postsynaptic targets of mossy fibers in the rat hippocampus. J Neurosci. 1998;18:3386–3403. doi: 10.1523/JNEUROSCI.18-09-03386.1998. [DOI] [PMC free article] [PubMed] [Google Scholar]
- Alger BE, Teyler TJ. Long-term and short-term plasticity in the CA1, CA3, and dentate regions of the rat hippocampal slice. Brain Res. 1976;110:463–480. doi: 10.1016/0006-8993(76)90858-1. [DOI] [PubMed] [Google Scholar]
- Amaral DG. A Golgi study of cell types in the hilar region of the hippocampus in the rat. J Comp Neurol. 1978;182:851–914. doi: 10.1002/cne.901820508. [DOI] [PubMed] [Google Scholar]
- Amaral DG, Campbell MJ. Transmitter systems in the primate dentate gyrus. Hum Neurobiol. 1986;5:169–180. [PubMed] [Google Scholar]
- Baimbridge KG. Calcium-binding proteins in the dentate gyrus. Epilepsy Res Suppl. 1992;7:211–220. [PubMed] [Google Scholar]
- Blackstad TW, Brink K, Hem J, Jeune B. Distribution of hippocampal mossy fibers in the rat. An experimental study with silver impregnation methods. J Comp Neurol. 1970;138:433–450. doi: 10.1002/cne.901380404. [DOI] [PubMed] [Google Scholar]
- Cadete-Leite A, Brandao F, Andrade JP, Ribeiro da Silva A, Paula-Barbosa MM. The GABAergic system of the dentate gyrus after withdrawal from chronic alcohol consumption: effects of intracerebral grafting and putative neuroprotective agents. Alcohol. 1997;32:471–484. doi: 10.1093/oxfordjournals.alcalc.a008282. [DOI] [PubMed] [Google Scholar]
- Claiborne BJ, Amaral DG, Cowan WM. A light and electron microscopic analysis of the mossy fibers of the rat dentate gyrus. J Comp Neurol. 1986;246:435–458. doi: 10.1002/cne.902460403. [DOI] [PubMed] [Google Scholar]
- Claiborne BJ, Amaral DG, Cowan WM. Quantitative, three-dimensional analysis of granule cell dendrites in the rat dentate gyrus. J Comp Neurol. 1990;302:206–219. doi: 10.1002/cne.903020203. [DOI] [PubMed] [Google Scholar]
- Croll SD, Suri C, Compton DL, Simmons MV, Yancopoulos GD, Lindsay RM, Weigand SJ, Scharfman HE. Brain-derived neurotrophic factor (BDNF) transgenic mice exhibit passive avoidance deficits, increased seizure severity and in vitro hyperexcitability in the hippocampus and entorhinal cortex. Neuroscience. 1999;93:1491–1506. doi: 10.1016/s0306-4522(99)00296-1. [DOI] [PMC free article] [PubMed] [Google Scholar]
- Czeh G, Seress L, Houser CR. Number and distribution of GAD65 mRNA-containing neurons in the rat hippocampal formation. Neurobiology (Bp) 1997;5:116. [Google Scholar]
- Deller T, Leranth C. Synaptic connections of neuropeptide Y (NPY) immunoreactive neurons in the hilar area of the rat hippocampus. J Comp Neurol. 1990;300:433–447. doi: 10.1002/cne.903000312. [DOI] [PubMed] [Google Scholar]
- Demir R, Haberly LB, Jackson MB. Voltage imaging of epileptiform activity in slices from rat piriform cortex: onset and propagation. J Neurosci. 1998;80:2727–2742. doi: 10.1152/jn.1998.80.5.2727. [DOI] [PubMed] [Google Scholar]
- Dietrich D, Clusmann H, Cral T, Steinhauser C, Blumcke I, Heinemann U, Schramm J. Two electrophysiologically distinct types of granule cells in epileptic human hippocampus. Neuroscience. 1999;90:1197–1206. doi: 10.1016/s0306-4522(98)00574-0. [DOI] [PubMed] [Google Scholar]
- Dudek FE, Obenaus A, Schweitzer JS, Wuarin JP. Functional significance of hippocampal plasticity in epileptic brain: electrophysiological changes of the dentate granule cells associated with mossy fiber sprouting. Hippocampus. 1994;4:259–265. doi: 10.1002/hipo.450040306. [DOI] [PubMed] [Google Scholar]
- Franck JE, Pokorny J, Kunkel DD, Schwartzkroin PA. Physiologic and morphologic characteristics of granule cell circuitry in human epileptic hippocampus. Epilepsia. 1995;36:543–558. doi: 10.1111/j.1528-1157.1995.tb02566.x. [DOI] [PubMed] [Google Scholar]
- Freund TF. GABAergic septal and serotonergic median raphe afferents preferentially innervate inhibitory interneurons in the hippocampus and dentate gyrus. Epilepsy Res Suppl. 1992;7:79–91. [PubMed] [Google Scholar]
- Freund TF, Magloczky Z. Early degeneration of calretinin-containing neurons in the rat hippocampus after ischemia. Neuroscience. 1993;56:581–596. doi: 10.1016/0306-4522(93)90358-m. [DOI] [PubMed] [Google Scholar]
- Frotscher M, Zimmer J. Lesion-induced mossy fibers to the molecular layer of the rat fascia dentata: identification of postsynaptic granule cells by the Golgi-EM technique. J Comp Neurol. 1983;215:299–311. doi: 10.1002/cne.902150306. [DOI] [PubMed] [Google Scholar]
- Frotscher M, Soriano E, Leranth C. Cholinergic and GABAergic neurotransmission in the fascia dentata: electron microscopic immunocytochemical studies in rodents and primates. Epilepsy Res Suppl. 1992;7:65–78. [PubMed] [Google Scholar]
- Frotscher M, Soriano E, Misgeld U. Divergence of hippocampal mossy fibers. Synapse. 1994;16:148–160. doi: 10.1002/syn.890160208. [DOI] [PubMed] [Google Scholar]
- Gaarskjaer FB. The hippocampal mossy fiber system of the rat studied with retrograde tracing techniques. Correlation between topographic organization and neurogenetic gradients. J Comp Neurol. 1981;203:717–735. doi: 10.1002/cne.902030409. [DOI] [PubMed] [Google Scholar]
- Gariboldi M, Conti M, Cavaleri D, Samani R, Vezzani A. Anticonvulsant properties of BIBP3226, a non-peptide selective antagonist at neuropeptide Y Y1 receptors. Eur J Neurosci. 1998;10:757–759. doi: 10.1046/j.1460-9568.1998.00061.x. [DOI] [PubMed] [Google Scholar]
- Goodman JH, Scharfman HE. Co-variation of hyperexcitability and mossy fiber sprouting along the septotemporal axis of the rat hippocampus. Soc Neurosci Abstr. 1999;25:847. [Google Scholar]
- Gruber B, Greber S, Rupp E, Sperk G. Differential NPY mRNA expression in granule cells and interneurons of the rat dentate gyrus after kainic acid injection. Hippocampus. 1994;4:474–482. doi: 10.1002/hipo.450040409. [DOI] [PubMed] [Google Scholar]
- Gulyas AI, Miettinen R, Jacobowitz DM, Freund TF. Calretinin is present in non-pyramidal cells of the rat hippocampus. I. A new type of neuron specifically associated with the mossy fibre system. Neuroscience. 1992;48:1–27. doi: 10.1016/0306-4522(92)90334-x. [DOI] [PubMed] [Google Scholar]
- Gulyas AI, Hajos N, Freund TF. Interneurons containing calretinin are specialized to control other interneurons in the rat hippocampus. J Neurosci. 1996;16:3397–3411. doi: 10.1523/JNEUROSCI.16-10-03397.1996. [DOI] [PMC free article] [PubMed] [Google Scholar]
- Hara H, Onodera H, Kogure K, Akaike N. The regional difference of neuronal susceptibility in the dentate gyrus to hypoxia. Neurosci Lett. 1990;115:189–194. doi: 10.1016/0304-3940(90)90453-g. [DOI] [PubMed] [Google Scholar]
- Heinemann U, Beck H, Dreier JP, Ficker E, Stabel J, Zhang CL. The dentate gyrus as a regulated gate for the propagation of epileptiform activity. Epilepsy Res Suppl. 1992;7:273–280. [PubMed] [Google Scholar]
- Jackson MB, Scharfman HE. Positive feedback from hilar mossy cells to granule cells in the dentate gyrus revealed by voltage-sensitive dye and microelectrode recording. J Neurophysiol. 1996;76:601–616. doi: 10.1152/jn.1996.76.1.601. [DOI] [PubMed] [Google Scholar]
- Jiang M, Swann JW. Expression of calretinin in diverse neuronal populations during development of rat hippocampus. Neuroscience. 1997;81:1137–1154. doi: 10.1016/s0306-4522(97)00231-5. [DOI] [PubMed] [Google Scholar]
- Kosaka T, Katsumaru H, Hama K, Wu JY, Heizmann CW. GABAergic neurons containing the Ca2+- binding protein parvalbumin in the rat hippocampus and dentate gyrus. Brain Res. 1987;419:119–130. doi: 10.1016/0006-8993(87)90575-0. [DOI] [PubMed] [Google Scholar]
- Leranth C, Nitsch R, Deller T, Frotscher M. Synaptic connections of seizure-sensitive neurons in the dentate gyrus. Epilepsy Res Suppl. 1992;7:49–64. [PubMed] [Google Scholar]
- Liu YB, Lio PA, Pasternak JF, Trommer BL. Developmental changes in membrane properties and postsynaptic currents of granule cells in rat dentate gyrus. J Neurophysiol. 1996;76:1074–1088. doi: 10.1152/jn.1996.76.2.1074. [DOI] [PubMed] [Google Scholar]
- Lothman EW, Stringer JL, Bertram EH. The dentate gyrus as a control point for seizures in the hippocampus and beyond. Epilepsy Res Suppl. 1992;7:301–313. [PubMed] [Google Scholar]
- Martinez A, Ruiz M, Soriano E. Spiny calretinin-immunoreactive neurons in the hilus and CA3 region of the rat hippocampus: local axon circuits, synaptic connections, and glutamate acid decarboxylase 65/67 mRNA expression. J Comp Neurol. 1999;404:438–448. doi: 10.1002/(sici)1096-9861(19990222)404:4<438::aid-cne2>3.0.co;2-k. [DOI] [PubMed] [Google Scholar]
- Miettinen R, Gulyas AI, Baimbridge KG, Jacobowitz DM, Freund TF. Calretinin is present in non- pyramidal cells of the rat hippocampus. II. Co-existence with other calcium binding proteins and GABA. Neuroscience. 1992;48:29–43. doi: 10.1016/0306-4522(92)90335-y. [DOI] [PubMed] [Google Scholar]
- Milner T, Veznedaroglu E. Ultrastructural localization of neuropeptide Y-like immunoreactivity in the rat hippocampal formation. Hippocampus. 1992;2:107–125. doi: 10.1002/hipo.450020204. [DOI] [PubMed] [Google Scholar]
- Molnar P, Nadler JV. Mossy fiber-granule cell synapses in the normal and epileptic rat dentate gyrus studied with minimal laser photostimulation. J Neurophysiol. 1999;82:1883–1894. doi: 10.1152/jn.1999.82.4.1883. [DOI] [PubMed] [Google Scholar]
- Nitsch R, Leranth C. Calretinin immunoreactivity in the monkey hippocampal formation. II. Intrinsic GABAergic and hypothalamic non-GABAergic systems: an experimental tracing and co-existence study. Neuroscience. 1993;55:797–812. doi: 10.1016/0306-4522(93)90442-i. [DOI] [PubMed] [Google Scholar]
- Nitsch R, Leranth C. GABAergic neurons in the rat dentate gyrus are innervated by subcortical calretinin-containing afferents. J Comp Neurol. 1996;625:425–438. doi: 10.1002/(SICI)1096-9861(19960115)364:3<425::AID-CNE4>3.0.CO;2-6. [DOI] [PubMed] [Google Scholar]
- Okazaki MM, Evenson DA, Nadler JV. Hippocampal mossy fiber sprouting and synapse formation after status epilepticus in rats: visualization after retrograde transport of biocytin. J Comp Neurol. 1995;352:515–534. doi: 10.1002/cne.903520404. [DOI] [PubMed] [Google Scholar]
- Okazaki MM, Molnar P, Nadler JV. Recurrent mossy fiber pathway in rat dentate gyrus: synaptic currents evoked in presence and absence of seizure-induced growth. J Neurophysiol. 1999;81:1645–1460. doi: 10.1152/jn.1999.81.4.1645. [DOI] [PubMed] [Google Scholar]
- Oleskevich S, Descarries L. Quantified distribution of the serotonin innervation in adult rat hippocampus. Neuroscience. 1990;34:19–33. doi: 10.1016/0306-4522(90)90301-j. [DOI] [PubMed] [Google Scholar]
- Oleskevich S, Descarries L, Lacaille JC. Quantified distribution of the noradrenaline innervation in the hippocampus of adult rat. J Neurosci. 1989;9:3803–3015. doi: 10.1523/JNEUROSCI.09-11-03803.1989. [DOI] [PMC free article] [PubMed] [Google Scholar]
- Patrylo PR, Dudek FE. Physiological unmasking of new glutamatergic pathways in the dentate gyrus of hippocampal slices from kainate-induced epileptic rats. J Neurophysiol. 1998;79:418–429. doi: 10.1152/jn.1998.79.1.418. [DOI] [PubMed] [Google Scholar]
- Pollard H, Bugra K, Khrestchatisky M, Represa A, Ben-Ari Y. Seizure-induced molecular changes, sprouting and synaptogenesis of hippocampal mossy fibers. Epilepsy Res Suppl. 1996;12:355–363. [PubMed] [Google Scholar]
- Racine RJ. Modification of seizure activity by electrical stimulation. II. Motor seizure. Electroencephalogr Clin Neurophysiol. 1972;32:281–294. doi: 10.1016/0013-4694(72)90177-0. [DOI] [PubMed] [Google Scholar]
- Represa A, Jorquera I, Le Gal La Salle G, Ben-Ari Y. Epilepsy induced collateral sprouting of hippocampal mossy fibers: does it induce the development of ectopic synapses with granule cell dendrites? Hippocampus. 1993;3:257–268. doi: 10.1002/hipo.450030303. [DOI] [PubMed] [Google Scholar]
- Ribak CE, Peterson GM. Intragranular mossy fibers in rats and gerbils form synapses with the somata and proximal dendrites of basket cells in the dentate gyrus. Hippocampus. 1991;1:355–364. doi: 10.1002/hipo.450010403. [DOI] [PubMed] [Google Scholar]
- Scharfman HE. Hyperexcitability in combined entorhinal/hippocampal slices of adult rat after exposure to brain-derived neurotrophic factor. J Neurophysiol. 1997;78:1082–1095. doi: 10.1152/jn.1997.78.2.1082. [DOI] [PubMed] [Google Scholar]
- Scharfman HE, Sarvey JM. Postsynaptic firing during repetitive stimulation is required for long-term potentiation in hippocampus. Brain Res. 1985;331:267–274. doi: 10.1016/0006-8993(85)91552-5. [DOI] [PubMed] [Google Scholar]
- Scharfman HE, Goodman JH, Sollas AL. Actions of BDNF in slices from rats with spontaneous seizures and mossy fiber sprouting in the dentate gyrus. J Neurosci. 1999;19:5619–5631. doi: 10.1523/JNEUROSCI.19-13-05619.1999. [DOI] [PMC free article] [PubMed] [Google Scholar]
- Scharfman HE, Goodman JH, Sollas AL. Granule-like neurons at the hilar/CA3 border after status epilepticus and their synchrony with area CA3 pyramidal cells: functional implications of seizure-induced neurogenesis. J Neurosci. 2000;20:6144–6158. doi: 10.1523/JNEUROSCI.20-16-06144.2000. [DOI] [PMC free article] [PubMed] [Google Scholar]
- Schwarzer C, Williamson JM, Lothman EW, Vezzani A, Sperk G. Somatostatin, neuropeptide Y, neurokinin B and cholecystokinin immunoreactivity in two chronic models of temporal lobe epilepsy. Neuroscience. 1995;69:831–845. doi: 10.1016/0306-4522(95)00268-n. [DOI] [PubMed] [Google Scholar]
- Seress L, Pokorny J. Structure of the granular layer of the rat dentate gyrus. A light microscopic and Golgi study. J Anat. 1981;133:181–195. [PMC free article] [PubMed] [Google Scholar]
- Simonyi A, Miller LA, Sun GY. Region-specific decline in the expression of metabotropic glutamate receptor mRNA in rat brain during aging. Mol Brain Res. 2000;82:101–106. doi: 10.1016/s0169-328x(00)00189-3. [DOI] [PubMed] [Google Scholar]
- Sloviter RS. A simplified Timm stain procedure compatible with formaldehyde fixation and routine paraffin embedding of rat brain. Brain Res Bull. 1982;8:771–774. doi: 10.1016/0361-9230(82)90104-6. [DOI] [PubMed] [Google Scholar]
- Sloviter RS. Calcium-binding protein (Calbindin D28K) and parvalbumin immunocytochemistry: localization in the rat hippocampus with specific reference to the selective vulnerability of hippocampal neurons to seizures activity. J Comp Neurol. 1989;280:183–196. doi: 10.1002/cne.902800203. [DOI] [PubMed] [Google Scholar]
- Sloviter RS. Permanently altered hippocampal structure, excitability, and inhibition after experimental status epilepticus in the rat: the “dormant basket cell” hypothesis and its possible relevance to temporal lobe epilepsy. Hippocampus. 1991;1:41–66. doi: 10.1002/hipo.450010106. [DOI] [PubMed] [Google Scholar]
- Sutula TP, Golarai G, Cavozos J. Assessing the functional significance of mossy fiber sprouting. Epilepsy Res Suppl. 1992;7:251–259. [PubMed] [Google Scholar]
- Sutula T, Zhang P, Lynch M, Sayin U, Golarai G, Rod R. Synaptic and axonal remodeling of mossy fibers in the hilus and supragranular region of the dentate gyrus in kainate-treated rats. J Comp Neurol. 1998;390:578–594. doi: 10.1002/(sici)1096-9861(19980126)390:4<578::aid-cne9>3.0.co;2-y. [DOI] [PubMed] [Google Scholar]
- Steward O, Scoville SA. Cells of origin of entorhinal cortical afferents to the hippocampus and fascia dentata of the rat. J Comp Neurol. 1976;169:347–370. doi: 10.1002/cne.901690306. [DOI] [PubMed] [Google Scholar]
- Tamamaki N, Nojyo Y. Projection of the entorhinal layer II neurons in the rat as revealed by intracellular pressure-injection of neurobiotin. Hippocampus. 1993;3:471–480. doi: 10.1002/hipo.450030408. [DOI] [PubMed] [Google Scholar]
- Tauck DL, Nadler JV. Evidence of functional mossy fiber sprouting in hippocampal formation of kainic acid-treated rats. J Neurosci. 1985;5:1016–1022. doi: 10.1523/JNEUROSCI.05-04-01016.1985. [DOI] [PMC free article] [PubMed] [Google Scholar]
- Turski L, Cavalheiro EA, Calderazzo-Filho LS, Bortolotto ZA, Klockgether T, Ikonomidou C, Turski WA. Review: cholinergic mechanisms and epileptogenesis. The seizures induced by pilocarpine: a novel experimental model of intractable epilepsy. Synapse. 1989;3:154–171. doi: 10.1002/syn.890030207. [DOI] [PubMed] [Google Scholar]
- Vezzani A, Schwarzer C, Lothman EW, Williamson JM, Sperk G. Functional changes in somatostatin and neuropeptide Y containing neurons in the rat hippocampus in chronic models of limbic seizures. Epilepsy Res. 1996;26:267–279. doi: 10.1016/s0920-1211(96)00059-9. [DOI] [PubMed] [Google Scholar]
- Vezzani A, Ravizza T, Moneta D, Conti M, Borroni A, Rizzi M, Samanin R, Maj R. Brain-derived neurotrophic factor immunoreactivity in the limbic system of rats after acute seizures and during spontaneous convulsions: temporal evolution of changes as compared to neuropeptide Y. Neuroscience. 1999a;90:1445–1461. doi: 10.1016/s0306-4522(98)00553-3. [DOI] [PubMed] [Google Scholar]
- Vezzani A, Sperk G, Colmers WF. Neuropeptide Y: emerging evidence for a functional role in seizure modulation. Trends Neurosci. 1999b;22:25–30. doi: 10.1016/s0166-2236(98)01284-3. [DOI] [PubMed] [Google Scholar]
- Wang S, Scott BW, Wojtowicz JM. Heterogenous properties of dentate granule neurons in the adult rat. J Neurobiol. 2000;42:248–257. [PubMed] [Google Scholar]
- Wenzel HJ, Wooley CS, Robbins CA, Schwartzkroin PA. Kainic acid-induced mossy fiber sprouting and synapse formation in the dentate gyrus of rats. Hippocampus. 2000;10:244–260. doi: 10.1002/1098-1063(2000)10:3<244::AID-HIPO5>3.0.CO;2-7. [DOI] [PubMed] [Google Scholar]
- Woodson W, Nitecka L, Ben-Ari Y. Organization of the GABAergic system in the rat hippocampal formation: a quantitative immunocytochemical study. J Comp Neurol. 1989;280:254–271. doi: 10.1002/cne.902800207. [DOI] [PubMed] [Google Scholar]
- Wu JY, Cohen LB. Fast multisite optical measurements of membrane potential. In: Mason WT, editor. Fluorescent and luminescent probes for biological activity. London: Academic press; 1993. pp. 389–404. [Google Scholar]
- Wuarin JP, Dudek FE. Electrographic seizures and new recurrent excitatory circuits in the dentate gyrus of hippocampal slices from kainate-treated epileptic rats. J Neurosci. 1996;16:4438–4448. doi: 10.1523/JNEUROSCI.16-14-04438.1996. [DOI] [PMC free article] [PubMed] [Google Scholar]