

Abstract
Single-cell nanosurgery and the ability to manipulate nanometer-sized subcellular structures with optical tweezers has widespread applications in biology, but so far has been limited by difficulties in maintaining the functionality of the transported subcellular organelles. This difficulty arises because of the propensity of optical tweezers to photodamage the trapped object. To address this issue, this paper describes the use of a polarization-shaped optical vortex trap, which exerts less photodamage on the trapped particle than conventional optical tweezers, for carrying out single-cell nanosurgical procedures. This method is also anticipated to find broad use in the trapping of any nanoparticles that are adversely affected by high-intensity laser light.
Despite the small size of a mammalian cell, it is an extremely heterogeneous and compartmentalized structure. Proteins and small-molecule metabolites constantly traffic among these intracellular compartments, and it has become increasingly evident that biological specificity (e.g. between proteins) relies heavily on spatial and temporal segregation and compartmentalization of molecules in addition to chemical and molecular specificity 1, 2. Gaining information with regard to the spatial and temporal distribution and evolution of molecules within cells, therefore, is crucial to the construction of a quantitative model of cellular function. The ability to isolate selectively single subcellular compartments for chemical analysis or transplantation opens new venues for studying the spatial and temporal organization of the cell. For example, the reprogramming of the nucleus of somatic cells may be achieved via nuclear transfer 3, 4. This paper describes and compares the use of polarization-shaped vortex traps with a Gaussian optical tweezer for performing single-cell nanosurgery.
Single-beam optical gradient traps, or optical tweezers, have made significant impact on biophysical and biological research in the past two decades 5-11. Unfortunately, while optical tweezers offer exquisite sensitivity in its ability to position microparticles and to measure the forces exerted by biological motors12, it suffers from one important disadvantage: the trapped particle is localized at the laser focus where light intensity is the highest, often reaching 107 - 108 W/cm2. As a result, the laser light used to trap a particle also has a propensity to photobleach and photodamage the particle, especially when the particle is fragile and small (e.g. a subcellular organelle that is fluorescently labeled) for which high laser intensities are often required. To minimize radiation damage to the trapped biological particle, laser wavelengths between ∼800nm to ∼ 1100nm are usually used because of the low absorption cross section of water and biological molecules in this spectral range 6-8, 13-15. Nevertheless, at the high laser intensities required for trapping and translating subcellular organelles through the dense cellular microenvironment, photodamage via multiphoton processes is often inevitable. To minimize this drawback, we describe here the use of polarization-shaped optical vortex traps for the manipulation of particles and subcellular structures.
Optical vortices, or Laguerre-Gaussian (LG) beams, are laser light that has a helical phase distribution at its wavefront 16-19. Unlike the traditional Hermit-Gaussian beam, a LG beam has associated with it orbital angular momentum. Spawned by interests in the angular momentum present in LG beams, they have been fashioned into optical traps (vortex traps) for the rotation of microparticles 16, 20, 21. In addition to the presence of angular momentum, optical vortices are also characterized by the presence of a dark core. Because of the spiral phase distribution at the wavefront, the phase at the center of the beam is undefined and thus a singularity is formed where the light intensity has a zero value. This dark core takes on different appearances upon tight focusing through a high numerical aperture objective (Fig. 1), depending on the polarization state of the incident beam 22, 23. Here we take advantage of these polarization effects to fashion vortex traps for the trapping of particles of different sizes while minimizing photodamage to the trapped particles and subcellular organelles.
Figure 1.

Optical setup and intensity profiles of polarization-shaped vortex traps. (a) The 1064nm line of a Nd:YAG laser (TEM00) was directed through a computer generated hologram (CGH), after which the mode as isolated and sent into an oil immersion objective (100×; N.A. 1.3). The top circular inset shows a SEM image of the dislocation region in the CGH, which was fabricated in SU-8 patterned on glass. The lower inset shows the and modes formed after the CGH; the conversion efficiencies are shown below the image of each mode. (b-d) Experimentally measured image showing the profile of a right circularly polarized (b), left circularly polarized (c), and linearly polarized (d) beam; the intensity distributions were visualized by detecting the two-photon fluorescence of a trapped 3μm dye-doped bead (excitation maximum at 542nm). (e-g) are simulations showing the corresponding two-photon intensity distributions, which match well with our experimental measurements. (h-j) are intensity plots along the direction indicated by the lines drawn in (e-g), with the scale bar in h corresponding to 1064nm. Fluorescence images were obtained using a CCD camera. M = mirror; L = lens.
Polarization-shaped vortex traps
Figure 1a depicts our experimental setup (for detail, see Supplementary Fig. S1), in which a blazed computer generated hologram (CGH) was used to convert the TEM00 output of a Nd-YAG laser (1064nm) into an optical vortex beam 17, 18, 24, 25. We microfabricated the CGH by patterning the negative photoresist SU-8 onto glass, using photolithography (see Supplementary Fig. S2). Unlike conventional gelatin-based holograms 26 that have damage thresholds of ∼ 102 W/cm2 or spatial light modulators with damage thresholds of ∼3 W/cm2, our SU-8 based hologram was able to sustain much higher incident laser powers (> 104 W/cm2; tested at the limit of our laser power output), which is important when high trapping powers are required given the high diffractive loss through the CGH and the transmissive loss through the optics and filters downstream from the CGH.
Figure 1b-1j depicts the effects of laser polarization on the intensity distribution of a tightly focused (with a N.A. 1.3 objective) beam. The right circularly polarized produces a dark core in the center of the laser focus, whereas the dark core is largely absent in a vortex trap formed from left circularly polarized . To minimize photodamage to the trapped organelle, we take advantage of this dark core for the trapping of subcellular structures that are comparable to or larger than the core size (Fig. 2a). This depolarization effect caused by tight focusing also leads to the formation of two high-intensity side lobes for linearly polarized laser light. This intensity feature is smaller than the diffraction-limited focus of a conventional optical tweezer, and as such is able to generate more gradient force at a given laser power. We exploit these high-intensity lobes for the trapping of particles that are smaller than the core diameter of the vortex trap (Fig. 2a).
Figure 2.

Analysis of particle trapping position and fluorescence response. (a) Using trapping potentials derived from the intensity distributions, we calculated the trapping position of different size particles in a linearly polarized vortex trap. Y-axis denotes the displacement of the particle in units of wavelength from the center (position zero) of the trap. As the size of the particles increases, they transition from being trapped at the high-intensity lobes to being centered over the dark core. The hatched region is where we calculated and experimentally observed that the particle can be trapped either at the high-intensity lobes or occupy the dark core, depending on the trapping power we use and the shape and refractive index of the particle. The insets are experimental images showing the two-photon fluorescence recorded from two 100nm beads trapped at the two high-intensity lobes (left inset) and a 1μm bead (right inset) trapped at the center of a linearly-polarized vortex trap. (b) A plot of recorded photon count (ordinate) versus laser power (abscissa) for a single 2μm fluorescent bead (Excitation Max: 505nm; Emission Max: 515nm) held and excited in a conventional Gaussian optical tweezer at 1064nm. The inset shows a plot of the log of the photon count (ordinate) versus the log of the laser power (abscissa) for powers up to 300mW; here the slope of the line is 2.0±0.2. The slope increased to 2.9±0.1 when fitted with powers between 500mW and 750mW.
Trapping positions
As in optical trapping using a Gaussian beam, the particle will trap at the lowest potential energy region in the polarization-shaped vortex trap. The potential energy is lowest when the interaction energy, which is proportional to the photon flux integrated over the entire particle, is maximized. Figure 2a shows the location of the trapped particle in a linearly polarized vortex trap. For small particles (<450nm), this position corresponds to where the particle is situated within the ring of the vortex beam. As the particle increases in size, larger than the width of the ring or the width of the core (>650nm), the location of the potential minima shifts towards the center of the vortex beam. Particles in the size range of 450-650nm, in our optical system, can be stably trapped in multiple positions because there are multiple local minima in the potential energy.
Two and three photon excitation of trapped particles in optical tweezers
Figure 2b confirms that the predominant excitation mechanism (at 1064nm) in an optical tweezer at low to medium powers (< ∼ 300mW) is via two-photon absorption. Here we trapped a 2μm fluorescent bead in an optical tweezer and exposed the bead to varying laser powers (up to 750mW) and plotted the observed intensity as a function of laser power. The inset is a plot of the log of the laser power versus the log of the photon count (intensity), which shows a straight line with a slope of 2.0±0.2 (fitted with powers up to 300mW) that is indicative of a two-photon mechanism. It should be noted, however, that the slope increased to 2.3±0.2 when we included powers between 300mW and 650mW and to 2.9±0.1 when fitted with powers between 500mW and 750mW. At powers greater than 300mW, therefore, three-photon excitation and bleaching becomes increasingly important.
Comparisons between optical tweezers and polarization-shaped vortex traps
As a first approximation, the amount of photobleaching and damage is proportional to the excited-state population of the molecules, which is reflected in the amount of two-photon excited fluorescence. Figure 3 quantitatively measures the difference between the observed two-photon fluorescence and trapping force between a conventional optical tweezer (Gaussian trap) and polarization-shaped vortex traps. In addition to experimental measurements, we have also constructed theoretical models so that we can compare the results predicted by theory with our experimental values. As a test sample, we used fluorescent beads with diameters of 100nm, 500nm, 1μm, and 3μm. For the 100nm and 500nm beads we used a linearly polarized beam, and for 1μm and 3μm beads we used a right circularly polarized beam. Figure 3a-3h shows the difference in the observed two-photon fluorescence from beads in Gaussian (Fig. 3a-3d) and vortex traps (Fig. 3e-3h); for these experiments, trapping powers ranged from 40mW to 130mW (40mW for 3μm and 1μm beads; 65mW for 500nm beads; 130mw for 100nm beads). Figure 3i shows simulations that illustrate the highest-intensity region and thus the trapping position for sub 400nm beads in a Gaussian (top), linearly polarized (left), and right circularly polarized (right). In a highly focused system, non-centrosymmetric polarizations generate non-centosymmetric intensity patterns, such as the observed intensity lobes in Figure 1d & Figure 3i (bottom left profile). For large particles that trap at the core, we no longer rely on the intensity lobes for trapping. In this case, the intensity lobes would only induce greater photodamage on the trapped particle, so we used circular polarization, which is centrosymmetric and thereby gives an even intensity distribution in the ring of the focused vortex beam.
Figure 3.
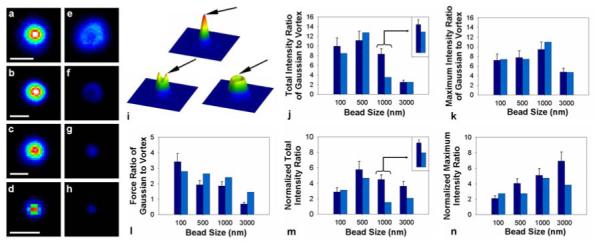
(a-h) Two-photon fluorescence images of trapped beads in Gaussian (a-d), right circularly polarized (e, f), and linearly polarized (g, h) vortex traps. The sizes of the beads are 3μm (a, e), 1μm (b, f), 0.5μm (c, g), and 0.1μm (d, h), respectively. The powers at the object plane were 40mW in (a, e), 40mW in (b, f), 65mW in (c, g) and 130mW in (d, h). Scale bar represents 1μm. The images are scaled to aid in display of the bead, which leads to a slight drop in resolution, mostly seen in the 100nm bead (d, h). (i) Simulation showing the 3D profiles formed after focusing through a NA 1.3 objective of the three types of traps we used (Top: Gaussian; Left: linearly polarized vortex; Right: right circularly polarized vortex); the arrow points to the location of the maximum intensity and where a sub 400nm particle would be trapped. For all experiments, we used linear polarization for 100nm and 500nm beads and right circularly polarized light for 1μm and 3μm beads. (j, k) show the ratio (Gaussian/Vortex) of experimentally measured (dark blue bar) and simulated (light blue bar) two-photon fluorescence from fluorescent beads of four different diameters (labeled on the x-axis); the same laser powers as in (a-h) were used. All simulations used a pure mode, except for the one shown in the inset, which used 88% , 10% of , and 2% of . (l) shows the ratio (Gaussian/Vortex) of the lateral trapping force obtained from experiments (dark blue bar) and simulations (light blue bar). The trapping powers were set to obtain an equal trapping force at the object plane for the different traps; these powers were, for the Gaussian and vortex respectively, 64mW & 220mW for 100nm, 6.0mW & 11.6 mW for 500nm, 5.0mW & 9.4mW for 1μm, and 8.9mW & 6.2mW for 3μm beads. The reported values were obtained by translating the bead at a 45° angle with respect to the side lobes. (m, n) shows the difference in the observed two-photon fluorescence after normalization to the differences in the trapping force between the different traps. Ratios of two-photon fluorescence were displayed using both total intensity (where intensity values recorded from all parts of the illuminated bead were used) and maximum intensity (where the intensity value from only the brightest pixel was used).
Figure 3j & 3k shows the difference in the observed two-photon fluorescence intensity from beads trapped in Gaussian and vortex traps; we chose beads of four different sizes (with diameters of 100nm, 500nm, 1μm, and 3μm) to study the dependence of photodamage on particle size. The dark blue bars are experimental measurements and the light blue bars are simulations. We displayed the difference in two-photon fluorescence both in total intensity (i.e. intensity from all parts of the illuminated bead) and in maximum intensity (i.e. intensity recorded from the brightest pixel). While total intensity is a good estimate of photodamage for particles much smaller than the trap because they are completely illuminated by the trap, it does not reflect photodamage to particles larger than the trapping spot (e.g. 1μm & 3μm beads) for which maximum intensity is a better indication. We note that the use of beads as a model to quantify photodamage only approximates the behavior of subcellular organelles in traps. Unlike beads, for example, molecules in organelles are free to rotate and diffuse into and out of the laser beam. Our experiments and simulations match well, except for the 1μm beads. This discrepancy is caused by the fact that experimentally our beam contains a small percentage of higher order LG modes, which slightly broadens the outer edge of the beam. The discrepancy was reduced significantly (inset) when we performed a mixed-mode simulation, which mixed the pure beam with 10% of and 2% of .
Using beads as a model system, we have also quantified the maximum trapping force between a Gaussian and the two polarization-shaped vortex traps (Fig. 3l). We measured the trapping force by equating it to the Stokes drag force, in which we gradually decreased the trapping power to the level that was just sufficient for the drag force to “knock” the particle out of the trap as the particle was translated at constant velocity. For the linearly polarized vortex trap, the trapping force was measured by translating the bead at a 45° angle with respect to the side lobes, because the intensity gradient is sharper across the width than along the length of the intensity ring. In general, the trapping force is less in the vortex trap because the laser energy is spatially more dispersed. An exception to this is when the particle is larger than the beam waist and axial trapping efficiency begins to influence the total trapping force 27. Figures 3m & 3n show the difference in two-photon fluorescence between the Gaussian and linear (100nm and 500nm beads) and Gaussian and right circularly polarized (1μm and 3μm beads) after normalizing to the difference in trapping force, because the ability to manipulate a trapped particle is dependent on the degree of photodamage inflicted at a given amount of force exerted on the particle. From these experiments, the photodamage normalized to the force is always less using polarization-shaped vortex trap than Gaussian trap (Fig. 3m, 3n). Because both the dependence of the trapping force on the steepness of the intensity gradient and two-photon photodamage are non-linear, polarization-shaped vortex traps should offer substantial advantages in the manipulation of fragile cellular structures. Assuming extra laser power is available, using a polarization-shaped vortex trap is always beneficial over a Gaussian trap.
Next, we studied the photobleaching of isolated mitochondria held by an optical tweezer and by a linearly polarized LG trap. Here we used the same laser power (power at object plane is 75mW) for both traps. Because the mitochondria were easily photobleached and were much less robust than beads, we were unable to hold onto the mitochondria for the long periods of time (tens of seconds) needed for force measurements. Figure 4a shows the result of this experiment, in which we compared the time course of bleaching of mitochondria (labeled with Mitotracker) trapped in an optical tweezer and in a vortex trap. To check for fluorescence from the mitochondria, we used a low level of visible light excitation (15μW after the objective at 488nm). The mitochondria trapped in the optical tweezer were rapidly bleached within the first few seconds, but the ones held by the vortex trap displayed a relatively stable fluorescent signal over this duration. The insets to the right of the plot show the fluorescence micrographs of the two representative mitochondria at 15 seconds (arrows) imaged under 488nm illumination. The ones held by the vortex trap exhibited strong fluorescence, but the ones trapped by the optical tweezer were no longer visible owing to photobleaching.
Figure 4.
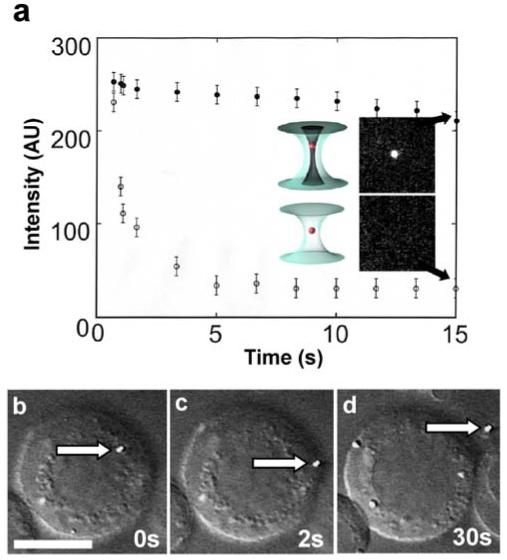
(a) A time plot that compares photobleaching of trapped mitochondria (stained with Mitotracker Green dye) in a conventional optical tweezer and in a linearly polarized vortex trap (laser power is 75mW at the object plane). To check for fluorescence, the trapped and stained mitochondria were illuminated periodically with 488nm excitation from an Ar+ laser; the fluorescence observed under 488nm excitation (ordinate) was plotted as a function of trapping time (abscissa). (○) Represents mitochondria trapped in the optical tweezer and (●) for mitochondria held in the vortex trap. The insets show fluorescence images (obtained using 488nm illumination) of mitochondria trapped for 15s (arrows) in the optical tweezer and in the vortex trap. (b-d) A sequence of images showing the removal of a fluorescent lysosome (stained with Lysotracker Green dye) from a B-lymphocyte. To cause the cell membrane to become more fluid, the lymphocyte was swelled by the addition of 25% (v/v) water in cell culture medium (RPMI 1640); the trapped lysosome (at 75mW trapping power at the object plane) was translated directly across the cell membrane and extracted from the cell. Scale bar = 10μm in (a).
Single-cell nanosurgery
While the cell nucleus has been transplanted between cells during cloning using micropipette technologies 28, 29, these methods are too crude for other subcellular structures. Furthermore, to identify unambiguously small subcellular organelles (which are often sub-micrometers in dimension), fluorescent tagging (e.g. with GFP) is often required. We have previously studied and characterized the survival of cells after nanosurgery with pulsed UV laser and conventional optical trapping 30. While the damage to the cell is mostly caused by the single UV laser pulse applied prior to trapping of the organelle, we found photobleaching and damage experienced by the trapped organelle is caused by the optical tweezer. This problem is minimized with the use of polarization-shaped vortex traps. A five-fold increase in the time-window for nanosurgery (e.g. from 2sec to 10sec), for example, will greatly facilitate the procedure and enhance the outcome.
Using polarization-shaped optical vortex traps, we have performed over one hundred organelle extractions. The details of the nanosurgical procedure are similar to that described in our previous paper 30, but here we focus on the photobleaching effect of the optical trap rather than on cellular recovery and survival. Figure 4b-4d shows a typical example, the isolation of a single lysosome labeled with Lysotracker (a lysosome specific dye stain)31 from within a B lymphocyte. Here, the lysosome was translated to the cell membrane in panel 4b, then through the membrane and outside of the cell in the two subsequent panels (4c & 4d). The lysosome translated easily through the membrane, which was made more fluid by swelling the cell with 25%(v/v) pure water to cell culture media. The fluorescent signal was maintained throughout the procedure, thus allowing unambiguous extraction of specific fluorescent subcellular organelles.
Conclusions and Outlook
The ability to manipulate optically submicron subcellular structures while minimizing photodamage has several practical applications. In particular, we are developing a droplet nanolab platform for single-organelle assays and chemical analysis32, 33, because many diseases are caused by organelle malfunction where a given cell can contain a heterogeneous population of healthy and defective organelles. To achieve single-organelle analysis, it requires the optical manipulation and encapsulation of the select organelle within a femtoliter-volume aqueous droplet 32. Here, it is pertinent the organelle remains functionally intact during optical manipulation so subsequent biological or chemical analysis reflects the true physiological state of the organelle.
Active manipulations of subcellular structures have so far been difficult, owing to the conflicting needs that often require the subcellular compartments to be fluorescently labeled for visualization and identification and the propensity of the conventional laser tweezer to photobleach such delicate biological samples in the trap. The use of polarization-shaped vortex traps alleviates this issue, but more importantly, this study points to a new strategy based on shaping intensity variations within the diffraction-limited laser focus to create the next generation of optical tweezers. This strategy benefits from the highly non-linear (fourth power for two-photon and fifth power for three-photon induced damage) dependence of photodamage on the sharpness of the intensity gradient. The availability of such tools offers unprecedented control in active nanoscopic manipulation, from subcellular structures to nanoparticles, such as metal colloids and quantum dots.
Supplementary Material
ACKNOWLEDGMENT
We thank Dr. David McGloin for helpful discussions. Support from the NIH (EB 005197 & GM 65293) and the Keck Foundation is gratefully acknowledged
REFERENCES
- 1.Heilmann I, Pidkowich MS, Girke T, Shanklin J. Proceedings of the National Academy of Sciences of the United States of America. 2004;101(28):10266–10271. doi: 10.1073/pnas.0402200101. [DOI] [PMC free article] [PubMed] [Google Scholar]
- 2.Tu BP, Kudlicki A, Rowicka M, McKnight SL. Science. 2005;310(5751):1152–1158. doi: 10.1126/science.1120499. [DOI] [PubMed] [Google Scholar]
- 3.Hochedlinger K, Jaenisch R. Nature. 2006;441(7097):1061–1067. doi: 10.1038/nature04955. [DOI] [PubMed] [Google Scholar]
- 4.Hochedlinger K, Rideout WM, Kyba M, Daley GQ, Blelloch R, Jaenisch R. Hematology Journal. 2004;5:S114–S117. doi: 10.1038/sj.thj.6200435. [DOI] [PubMed] [Google Scholar]
- 5.Ashkin A, Dziedzic JM, Bjorkholm JE, Chu S. Optics Letters. 1986;11(5):288–90. doi: 10.1364/ol.11.000288. [DOI] [PubMed] [Google Scholar]
- 6.Svoboda K, Block SM. Annual Review of Biophysical and Biomolecular Structure. 1994;23:247–285. doi: 10.1146/annurev.bb.23.060194.001335. [DOI] [PubMed] [Google Scholar]
- 7.Kuyper CL, Chiu DT. Applied Spectroscopy. 2002;56(11):300A–312A. [Google Scholar]
- 8.Grier DG. Nature (London, United Kingdom) 2003;424(6950):810–816. doi: 10.1038/nature01935. [DOI] [PubMed] [Google Scholar]
- 9.Ashkin A, Dziedzic JM, Yamane T. Nature. 1987;330(6150):769–771. doi: 10.1038/330769a0. [DOI] [PubMed] [Google Scholar]
- 10.Greulich KO, Pilarczyk G. Cellular and Molecular Biology. 1998;44(5):701–710. [PubMed] [Google Scholar]
- 11.Konig K. Histochemistry and Cell Biology. 2000;114(2):79–92. doi: 10.1007/s004180000179. [DOI] [PubMed] [Google Scholar]
- 12.Jaclyn MN, Elliot LB, Linda ZS, Barbara D, Michael WB. Journal of Biomedical Optics. 2006;11(4):044001. doi: 10.1117/1.2337559. [DOI] [PubMed] [Google Scholar]
- 13.Liu Y, Cheng DK, Sonek GJ, Berns MW, Chapman CF, Tromberg BJ. Biophysical Journal. 1995;68(5):2137–2144. doi: 10.1016/S0006-3495(95)80396-6. [DOI] [PMC free article] [PubMed] [Google Scholar]
- 14.Konig K, Liang H, Berns MW, Tromberg BJ. Nature. 1995;377(6544):20–21. doi: 10.1038/377020a0. [DOI] [PubMed] [Google Scholar]
- 15.Liu Y, Sonek GJ, Berns MW, Konig K, Tromberg BJ. Optics Letters. 1995;20(21):2246–2248. doi: 10.1364/ol.20.002246. [DOI] [PubMed] [Google Scholar]
- 16.Lee WM, Ahluwalia BPS, Yuan XC, Cheong WC, Dholakia K. Journal of Optics a-Pure and Applied Optics. 2005;7(1):1–6. [Google Scholar]
- 17.He H, Heckenberg NR, Rubinsztein-Dunlop H. Journal of Modern Optics. 1995;42(1):217–223. [Google Scholar]
- 18.Gahagan KT, Swartzlander GA., Jr. Journal of the Optical Society of America B: Optical Physics. 1998;15(2):524–534. [Google Scholar]
- 19.Curtis JE, Koss BA, Grier DG. Optics Communications. 2002;207(16):169–175. [Google Scholar]
- 20.Lee WM, Yuan XC, Dholakia K. Optics Communications. 2004;239(13):129–135. [Google Scholar]
- 21.Paterson L, MacDonald MP, Arlt J, Sibbett W, Bryant PE, Dholakia K. Science. 2001;292(5518):912–914. doi: 10.1126/science.1058591. [DOI] [PubMed] [Google Scholar]
- 22.Jia BH, Gan XS, Gu M. Optics Express. 2005;13(25):10360–10366. doi: 10.1364/opex.13.010360. [DOI] [PubMed] [Google Scholar]
- 23.Bokor N, Iketaki Y, Watanabe T, Fujii M. Optics Express. 2005;13(26):10440–10447. doi: 10.1364/opex.13.010440. [DOI] [PubMed] [Google Scholar]
- 24.Arlt J, Dholakia K, Allen L, Padgett MJ. Journal of Modern Optics. 1998;45(6):1231–1237. [Google Scholar]
- 25.Korda P, Spalding GC, Dufresne ER, Grier DG. Review of Scientific Instruments. 2002;73(4):1956–1957. [Google Scholar]
- 26.Robertson B, Godsalve C, Taghizadeh MR. Applied Optics. 1993;32(33):6587–6597. doi: 10.1364/AO.32.006587. [DOI] [PubMed] [Google Scholar]
- 27.Simpson NB, McGloin D, Dholakia K, Allen L, Padgett MJ. Journal of Modern Optics. 1998;45(9):1943–1949. [Google Scholar]
- 28.Hochedlinger K, Jaenisch R. New England Journal of Medicine. 2003;349(3):275–286. doi: 10.1056/NEJMra035397. [DOI] [PubMed] [Google Scholar]
- 29.Rideout WM, Eggan K, Jaenisch R. Science. 2001;293(5532):1093–1098. doi: 10.1126/science.1063206. [DOI] [PubMed] [Google Scholar]
- 30.Shelby JP, Edgar JS, Chiu DT. Photochemistry and Photobiology. 2005;81(4):994–1001. doi: 10.1562/2005-02-02-RA-431. [DOI] [PubMed] [Google Scholar]
- 31.Barasch J, Kiss B, Prince A, Saiman L, Gruenert D, Alawqati Q. Nature. 1991;352(6330):70–73. doi: 10.1038/352070a0. [DOI] [PubMed] [Google Scholar]
- 32.He M, Edgar JS, Jeffries GDM, Lorenz RM, Shelby JP, Chiu DT. Analytical Chemistry. 2005;77(6):1539–1544. doi: 10.1021/ac0480850. [DOI] [PubMed] [Google Scholar]
- 33.Lorenz RM, Edgar JS, Jeffries GDM, Chiu DT. Analytical Chemistry. 2006;78(18):6433–6439. doi: 10.1021/ac060748l. [DOI] [PubMed] [Google Scholar]
Associated Data
This section collects any data citations, data availability statements, or supplementary materials included in this article.