

Abstract
Motivation: Unraveling the transcriptional regulatory program mediated by transcription factors (TFs) is a fundamental objective of computational biology, yet still remains a challenge.
Method: Here, we present a new methodology that integrates microarray and TF binding data for unraveling transcriptional regulatory networks. The algorithm is based on a two-stage constrained matrix decomposition model. The model takes into account the non-linear structure in gene expression data, particularly in the TF-target gene interactions and the combinatorial nature of gene regulation by TFs. The gene expression profile is modeled as a linear weighted combination of the activity profiles of a set of TFs. The TF activity profiles are deduced from the expression levels of TF target genes, instead directly from TFs themselves. The TF-target gene relationships are derived from ChIP-chip and other TF binding data. The proposed algorithm can not only identify transcriptional modules, but also reveal regulatory programs of which TFs control which target genes in which specific ways (either activating or inhibiting).
Results: In comparison with other methods, our algorithm identifies biologically more meaningful transcriptional modules relating to specific TFs. We applied the new algorithm on yeast cell cycle and stress response data. While known transcriptional regulations were confirmed, novel TF-gene interactions were predicted and provide new insights into the regulatory mechanisms of the cell.
Contact: zhanmi@mail.nih.gov
Supplementary information: Supplementary data are available at Bioinformatics online.
1 INTRODUCTION
Genes are coordinately expressed under tight regulation by transcriptional factors to carry out complex and condition-specific biological functions in living cells. It is critical to develop computational approaches for deciphering transcriptional regulatory programs, in order to elucidate molecular mechanism of development or disease or identify biomarkers (Brunet et al., 2004; Hughes et al., 2000; Li and Zhan, 2006; Segal et al., 2004; Zhan, 2007). Microarray gene expression data have been extensively used for identifying transcriptional regulatory modules. Various computational methodologies have been introduced for those studies, including projection (e.g. principal component analysis, singular value decomposition, independent component analysis) (Alter et al., 2000; Lee and Batzoglou, 2003; Liebermeister, 2002), model-based approaches (e.g. network component analysis, probabilistic sparse matrix factorization) (Dueck et al., 2005; Liao et al., 2003) and conventional clustering (e.g. hierarchical clustering, self-organizing maps, K-means) (Eisen et al., 1998; Tamayo et al., 1999; Tavazoie et al., 1999). The projection methods decompose the original data into components that are constrained to be mutually either uncorrelated or statistically independent, and cluster genes into mutually non-exclusive modules based on their loading in the components. Since these methods do not cluster genes according to the pair-wise similarity, they can identify sets of coexpressed genes that are potentially co-regulated. Model-based approaches model microarray data as a linear mixture of latent variables that may correspond to specific biological sources. These methods usually incorporate prior knowledge on gene regulatory mechanisms as constraints for precisely estimating model's parameters. For example, the probabilistic sparse matrix factorization approach uses the ‘sparse’ constraint in the matrix decomposition to provide a combinatorial account of the gene expression in terms of a small set of factors. One challenge of such model-based approaches is the lack of sufficient data to estimate the parameters. Recent simulation studies suggest that transcriptional networks inferred from gene expression data alone can be considerably obscured by spurious interactions when the number of observations is small or the quality of the data is poor (Husmeier, 2003). Several approaches, including GRAM (Bar-Joseph et al., 2003), COGRIM (Chen et al., 2007) and ReMoDiscovery (Lemmens et al., 2006), have been developed to infer transcriptional regulatory networks by integrating gene expression data with transcription factor (TF) binding information. These approaches allow identification of more functionally coherent regulatory modules, in comparison with the analyses utilizing microarray data alone (Bernard and Hartemink, 2005; Joung et al., 2006; Kim et al., 2006; Yu and Li, 2005; Zhou et al., 2005).
We recently developed a two-stage matrix decomposition method that combine the characteristics of projection and model-based approaches for the discovery of transcriptional modules (Li et al., 2007). In the present study, we extend the two-stage decomposition method to incorporating TF binding data for unraveling TF-mediated regulatory programs. The new approach provides information of not only transcriptional modules, but also on which of the TFs control which target genes in which specific ways (either activating or inhibiting) in a regulatory program. Considering highly non-linear interactions between TFs and their target genes, we first adopt a non-linear independent component analysis (NICA) method to reduce the non-linear distortion in the data and decompose the data into independent latent components. Next, we develop a constrained probabilistic sparse matrix factorization (cPSMF) approach that models the expression of each gene across the independent latent components as a linear weighted combination of activity profiles of a small number of TFs. The model takes into account of the combinatorial and sparse nature of gene regulation by TFs. By incorporating TF-target gene relationships derived from ChIP-chip data into the probabilistic sparse matrix factorization, the cPSMF approach infers the network structure in a more accurate and robust manner. Finally, we fine-tune the transcriptional network by selecting target genes whose promoter regions contain a sequence that matches with the binding site of the corresponding TF. In comparison with other methods, our algorithm shows better performance in identifying functionally coherent transcriptional modules relating to specific TFs. We demonstrate the usefulness of the new method in a case study on yeast cell cycle and stress response data. While known transcriptional regulatory interactions were confirmed, novel TF-gene links were also predicted, providing new insights into the regulatory network of the cell.
2 METHODS
2.1 The two-stage constrained matrix decomposition model
In this proposed model, TF-mediated transcriptional regulatory programs are inferred based on integrated results from microarray, ChIP-chip and TF binding motif data. Suppose there is a microarray gene expression data matrix X∈ℜN×M with N genes and M samples and a configuration matrix C∈{0,1}N×Lobtained from ChIP–chip data with L TFs, where element Cil=1 represents gene i is regulated by TF l. We first take the NICA step to de-nonlinearize microarray data into independent latent components. The model can be written as (Jutten and Karhunen, 2004; Lappalainen and Honkela, 2000; Li et al., 2007):
| (1) |
where S∈ℜN×M′ denotes the independent latent source matrix and A∈ℜM′×M is the mixing matrix. M′ is the number of latent sources. N is a white Gaussian noise matrix. F(·) is a non-linear mixing function, which is modeled using a multilayer perceptron (MLP) network with one non-linear hidden layer (Haykin, 1999). S can be obtained from Equation (1) using the variational Bayesian learning (Lappalainen and Honkela, 2000) and the FastICA algorithm (Hyvarinen and Oja, 2000).
Next, we take the cPSMF stage to model the expression profiles of genes across the independent latent components as linear weighted combinations of L TF activity profiles
| (2) |
where Y∈ℜN×L is the weighting matrix, and Z∈ℜL×M′ is the matrix that contains activity profiles of L TFs across the independent latent components. For each TF, we obtain an activity profile from the centroid of the expression profiles of the target genes across the independent latent components. The target genes of each TF are chosen from the configuration matrix C, constructed from the ChIP-chip data. The Y matrix is inferred from Equation (2) by variational Bayesian learning (Dueck et al., 2005; Jordan et al., 1999) with constraints that
| (3) |
where · denotes an element-by-element product of C and Y, which means that the element Yil of Y can be non-zero only when Cil=1. C is pre-specified from ChIP-chip data and has a sparse property since any target gene can only be regulated by a small number of TF's biologically. A detail description of the NICA and cPSMF approaches can be found in the Supplementary Material.
The proposed algorithm is summarized as follows:
Input
Microarray data matrix X=[Xij], where the element Xij represents the expression level of gene i associated with the j−th sample, i=1,… ,N, j=1,…, M
Configuration matrix C=[Cil], where Cil=1 represents gene i is regulated by TF l, obtained from ChIP-chip data, i=1,…, N, l=1,…, L, L is the number of TFs.
Maximum number of effective TFs, K. K should be less or equal to L.
Output
The topology of transcriptional regulatory networks.
Algorithm
- De-nonlinearize X using the NICA approach.
- Find the non-linear principal components matrix S=SA from Equation (1) by variational Bayesian learning.
- Decompose S=SA by the linear FastICA algorithm to obtain linear independent components in S.
- Decompose S from Equation (2) using the cPSMF method.
- Construct Z as follows: For l=1,…, L cluster the expression profiles of target genes of TF l into two groups (activated or inhibited pattern) using K-means approach. Then choose the centroid profile with the larger variance as the activity profile of TF l.
- Initialize the element Yil in Y to an arbitrary value if Cil=1, else set the value of Yil to zero.
- Infer Y from Equation (2) by factorized variational inference with constraint Y=C·Y.
- Reconstruct transcriptional networks regulated by given TFs based on Y.
- For l=1,…, L and i=1,…, N, if Yil > α then gene i is positively regulated or activated by TF l. α is a predetermined weight cutoff.
- For l=1,…, L and i=1,…, N, if Yil <−α then gene i is negatively regulated or inhibited by TF l.
- Fine-tune gene transcriptional networks by selecting target genes whose promoter regions contain a sequence that matches with the binding site of the corresponding TF.
- For l=1,…, L and ∀ i : Yil≠0, compute the core similarity score Oil between the position−specific weight matrix of the TF l binding motif and the promoter sequence of the target gene i, using the MATCH software searching against the TRANSFAC database (http://www.biobase-international.com). Select the candidate target gene i regulated by the TF l if Oil≥β;β is a predetermined cutoff value.
2.2 Biological assessment and visualization of inferred regulatory networks
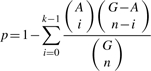
To assess biological relevance of inferred regulatory network, we examined whether the identified TF-regulated transcriptional modules accumulate in certain Gene Ontology (GO) categories by conducting two different analyses: over-representation analysis and gene set enrichment analysis. The over-representation analysis was used to detect if a GO term is enriched in a transcriptional network. In specific, the hypergeometric probability p that a GO term is significantly enriched in a network is calculated as:
 |
(4) |
where k is the number of genes in the group, G is the total number of genes, n is the number of genes in the module with a given GO term and A is the total number of genes with a given GO term.
The gene set enrichment analysis is based on the non-parametric test. When considering an arbitrary GO category, it evaluates if the genes in the identified transcriptional modules that belong to the category are uniformly distributed or accumulated in the list sorted by some specific criteria (Backes et al., 2007). Since both the over-representation analysis and the gene set enrichment analysis were applied to many GO categories, we further conducted the false discovery rate (FDR) correction, which provides strong control to have less false negatives at the cost of a few more false positives.
We took advantage of Cytoscape's versatile visualization environment (Shannon et al., 2003) to produce graphic representation of the resulting regulatory networks.
2.3 Experimental datasets
Two publicly available yeast microarray datasets were used for algorithm evaluation and case studies. The first was a cell cycle dataset, which was determined under the normal growth condition (Spellman et al., 1998). The second was a stress response dataset, determined under different experimental conditions such as temperature shocks, amino acid starvation, nitrogen source deletion and progression into stationary phase (Gasch et al., 2000). The normalization of the datasets was conducted by zero transformation (Gollub et al., 2006), and the missing data were filled using the KNNimpute approach (Troyanskaya et al., 2001).
The yeast ChIP-chip dataset used for the studies was obtained from a previous study (Harbison et al., 2004). The dataset contains 203 TFs, with all profiled in a rich medium and 84 profiled under multiple stress conditions. We used the TF-gene pairs that have P-values <0.05 to construct the configuration matrix C in our analysis.
The known TF-gene interaction data used in the studies were obtained from the yeast transcriptional regulatory network previously published (Herrgard et al., 2003; Milo et al., 2002). The yeast promoter sequences and TF binding motifs data were obtained from Harbison et al. (2004).
3 RESULTS AND DISCUSSION
3.1 Feature of the algorithm
The motivation of this work was to provide a mathematical framework for identifying condition-specific transcriptional regulatory networks by integrated analysis of microarray, ChIP-chip and TF binding motif data. An important feature of our method is the utilization of two-stage data decomposition (NICA+cPSMF). The NICA transformation captures the non-linear structure in the data and represents the data with independent latent components. Inspired by the fact that gene expression is regulated by a small set of TFs that act combinatorially, the cPSMF models the expression profile of each gene represented by the independent latent components as a linear combination of activity profiles of a small number of TFs. A configuration matrix (C matrix) is incorporated into the modeling as constraint for precisely estimating the influence of TFs. The configuration matrix, derived from ChIP-chip data, has a sparse property. That is, there are only a few non-zero elements in the matrix, as target genes can only be regulated by a small number of TF's. Through learning the parameters of the cPSMF model, the algorithm can infer activating and inhibitory regulatory relationships between TFs and their gene targets. The strength and direction of transcriptional regulation that a TF applies on its target genes are reflected by the weight of the TF presented in the Y matrix.
Most methods for inferring TF-regulated transcriptional modules are based on the assumption that there exists a correlation on the mRNA expression level between TFs and their target genes (Kim et al., 2006; Zhu et al., 2002). This assumption is however not always true, since the activation or inhibition of a target gene by a TF can be influenced by not only the mRNA expression of the TF and their targets, but also by post-transcriptional modification of the genes, as well as the concentration, post-translational modification and cellular localization of their protein products. Because of these, our algorithm uses the expression patterns of TF target genes, instead of TFs themselves, to deduce the activity profiles of TFs.
When applying our algorithm, we set the number of independent latent components equal to the number of experimental conditions for simplicity. For more accurate non-linear mapping, we set the number of hidden neurons in the MLP network as twice as the number of independent latent components. We also set K, the maximum number of effective TFs bound on target genes, equal to two in our algorithm. The choice of the parameters α (weight cutoff) and β (PWM matching score cutoff) is important for the structure of the inferred network. Since in general, ground-truth data are hardly available for condition-specific situation, we take a conserved approach in setting up the parameters in our case studies. We set weight cutoff α=0.05 and PWM matching score cutoff β=0.94. Similar conserved parameters are also adopted in other similar studies (Kim et al., 2006).
3.2 Comparison with other methods
To evaluate our algorithm, we compared its performance with those by other similar methods, including GRAM (Bar-Joseph et al., 2003), COGRIM (Chen et al., 2007) and ReMoDiscovery (Lemmens et al., 2006). The latter three methods can predict transcriptional modules that are coregulated by TFs through integrated analysis of microarray, ChIP-chip and TF motif data. GRAM is based on an iterative search, in which genes with common TF binding sites on the promoters are first identified using ChIP-chip data and the clustered gene sets are further refined by shared expression profiles. COGRIM is derived from a Bayesian hierarchical model, while ReMoDiscovery is a non-iterative approach. While our method and COGRIM can infer activating or inhibiting relationships between TFs and their target genes, GRAM and ReMoDiscovery can not predict such relationships.
We identified TF-mediated transcriptional modules using our method as well as the three other methods, based on the same set of data of microarray (from both cell cycle and stress response), ChIP-chip and TF binding motifs derived from the yeast (see Section 2.3). We chose 19 TFs that are involved in the cell cycle and stress response, and identified their target genes. We then examined the functional relevance of the target gene clusters based on the GO using over-representation analysis and gene set enrichment analysis. In the gene set enrichment analysis, the input set was sorted by the variance of the expression profile of the target genes. Table 1 shows the statistical enrichment of functional GO terms in the target gene clusters based on these two analysis approaches. The enrichment level was calculated by transforming the enrichment P-values after FDR correction to the negative log values and averaged over all functional modules for corrected P<0.05. If no functional modules are found for corrected P<0.05, the smallest value of corrected P is taken for calculating the enrichment level. As illustrated, our algorithm out-performs the other methods on the functional enrichment in the target gene clusters. The averaged enrichment level over all the 19 clusters in over-representation analysis was the highest by our algorithm (5.81), followed by ReMoDiscovery (5.40), COGRIM (5.22) and GRAM (4.96). The averaged enrichment level over all the 19 clusters in gene set enrichment analysis was also the highest by our algorithm (3.65), followed by COGRIM (3.42), GRAM (2.90) and ReMoDiscovery (2.64). This implies that our algorithm can identify more functionally coherent gene clusters relating to specific TFs. In terms of the number of target genes identified, the average gene number per cluster was the highest by our algorithm (91), followed by COGRIM (85), ReMoDiscovery (74) and GRAM (32). Interestingly, our algorithm identified more target genes that are annotated with known functions, indicating that our approach provides more functional information about transcriptional regulatory program. The better performance of our algorithm in comparison with others indicates that the mathematical framework we choose for modeling the transcriptional regulatory program is appropriable.
Table 1.
Comparison with other methods based on GO functional enrichment
| Gene seta | Over-representation analysis |
Gene set enrichment analysis |
||||||
|---|---|---|---|---|---|---|---|---|
| Our algorithm | GRAM | COGRIM | ReMoDis. | Our algorithm | GRAM | COGRIM | ReMoDis. | |
| ABF1 | 5.93 | 6.12 | 5.74 | 4.55 | 4.56 | 4.60 | 5.05 | 3.76 |
| ACE2 | 4.43 | 1.60 | 3.59 | 4.47 | 2.06 | 5.23 | 3.43 | 1.53 |
| FKH1 | 4.62 | 4.79 | 1.76 | 4.05 | 4.51 | 1.91 | 2.99 | 2.04 |
| FKH2 | 6.10 | 1.28 | 5.82 | 6.09 | 2.86 | 3.60 | 4.02 | 2.41 |
| GCN4 | 7.23 | 6.64 | 7.40 | 7.61 | 5.71 | 2.09 | 1.48 | 4.72 |
| LEU3 | 7.74 | 7.29 | 6.44 | 5.20 | 2.70 | 1.32 | 1.05 | 1.83 |
| MBP1 | 6.08 | 6.15 | 4.93 | 6.17 | 4.17 | 4.21 | 4.91 | 3.40 |
| MCM1 | 6.13 | 6.87 | 5.97 | 6.74 | 2.71 | 1.19 | 2.93 | 1.40 |
| NDD1 | 1.64 | 1.82 | 1.66 | 4.49 | 2.67 | 2.40 | 3.09 | 3.47 |
| RAP1 | 8.39 | 7.37 | 8.92 | 6.6 | 6.49 | 0.85 | 2.17 | 2.04 |
| REB1 | 5.52 | 5.03 | 5.53 | 5.10 | 4.13 | 5.09 | 4.92 | 3.46 |
| STB1 | 4.72 | 4.43 | 3.91 | 6.51 | 2.11 | 0.50 | 2.89 | 5.09 |
| SWI4 | 7.06 | 5.61 | 5.76 | 6.42 | 5.22 | 4.25 | 4.73 | 1.56 |
| SWI5 | 4.41 | 2.36 | 5.7 | 4.78 | 6.01 | 5.79 | 5.54 | 0.94 |
| SWI6 | 5.66 | 4.58 | 4.79 | 4.90 | 2.81 | 4.08 | 4.23 | 4.23 |
| HSF1 | 6.53 | 4.42 | 4.4 | 4.38 | 3.47 | 1.64 | 2.92 | 3.52 |
| MSN4 | 6.31 | 5.51 | 5.67 | 5.72 | 2.77 | 0.86 | 4.58 | 1.93 |
| SKN7 | 5.86 | 6.75 | 4.55 | 2.91 | 1.29 | 2.88 | 1.27 | 0.85 |
| YAP1 | 6.08 | 5.69 | 6.64 | 5.92 | 3.10 | 2.62 | 2.81 | 1.90 |
| Averaged over TFs | 5.81 | 4.96 | 5.22 | 5.40 | 3.65 | 2.90 | 3.42 | 2.64 |
The comparison is conducted based on two enrichment analysis methods: over-representation analysis and gene set enrichment analysis. The target gene sets of 19 TFs relating to cell cycle and stress response are evaluated. The GO functional enrichment levels of target genes identified by each method are shown. The enrichment level is calculated by transforming the enrichment P values after FDR correction to the negative log values and averaged over all functional modules for corrected P<0.05. If no functional modules are found for corrected P<0.05, the smallest value of corrected P is taken for calculating the enrichment level. aeach gene set is named by the TF that regulates the genes.
Nevertheless, challenges still remain for identifying TF-regulated transcriptional programs. There are limited ChIP-chip data available for such analysis. The identification of TF binding sites on the promoter sequences is often associated with high false positive or negative errors. Moreover, ChIP-chip data and gene expression profile data are often generated under different experimental conditions. It is not clear how this difference effects the identification of condition specific regulatory programs by integrated analysis of these data.
3.3 Case study: regulatory networks of the yeast
3.3.1 Cell cycle
We applied our algorithm to infer the transcriptional regulatory program of the cell cycle in the yeast under the rich medium growth condition. The analysis was based on the microarray data and TF binding information determined by ChIP-chip and promoter sequence analysis (see Section 2.3). From the total 203 TFs, we selected 32 TFs for the analysis according to their ranked activity profiles, which were sorted by the variance of the activity profiles of TFs. These TFs should be top cell cycle regulated TFs. Cheng and Li recently proposed a two-step method to identify the cell cycle regulated TFs by integrating microarray data with ChIP-chip data (Cheng and Li, 2008). We compared these 32 TFs with the putative cell cycle TFs identified by Cheng and Li's method, as well as the TFs identified by (Tsai et al., 2005). Among them, 15 are known cell cycle related factors from previous experiments and 8 are also suggested as putative cell cycle TFs by these studies (Cheng and Li, 2008; Tsai et al., 2005). Figure 1A shows the inferred regulatory network. The network contained 2017 TF-target interactions. Among these interactions, 160 are the known regulatory links (blue solid lines) from literature (Herrgard et al., 2003; Milo et al., 2002), while the others are new predictions. We found that the known cell cycle regulatory TFs FKH1, FKH2, MBP1, MCM1, NDD1, REB1, SKN7, SWI4, SWI5 and SWI6 were the predominant hubs in the network. The hub genes also included ABF1, GAT1, HSF1, MSN4, NRG1, PHD1, RAP1 and YAP1. Among them, ABF1, MSN4, NRG1, PHD1 and RAP1 are putative cell cycle TFs that previous studies have also suggested. For example, NRG1 was identified as a cell cycle regulated TF by (Cheng and Li, 2008). There were 76 target genes that were regulated by NRG1 in our inferred network, and these genes showed significant biological relevance (GO enrichment level 5.66). Similarly, PHD1, also previously predicted as an cell cycle regulated TF (Tsai et al., 2005), regulated 70 target genes, which were biologically significant (GO enrichment level 5.10). GAT1 was a major hub gene on the yeast transcriptional network and was regulated by cell cycle related TFs ACE2/SWI5 and FKH1/FKH2 in our network. These results are consistent to previous observations (Yu and Li, 2005). Besides showing TF-target interactions, our regulatory network further identifies activating and inhibitory relationships between TF and target genes. For example, SWI5 activated the expression of ASH1, while ASH1 repressed SWI5 (Fig. 1A). These findings are once again consistent to previous observations (Herrgard et al., 2003; Milo et al., 2002). The consistency of our findings from the inferred network with experimental data and predictions by others support the validity of our methods in inferring the regulatory networks.
Fig. 1.

Visualization of the transcriptional regulatory networks of the yeast inferred using our algorithm. TFs are represented by red squares and their target genes by small circles. Blue and gray lines indicate known and predicted regulatory interactions, respectively. (A) cell cycle, (B) stress response.
3.3.2 Stress response
The inference of this regulatory network using our algorithm was based on the stress response microarray data under heat shock from 25○C to 37○C, along with 203 TFs and their genomic binding sites determined by ChIP and promoter sequence analysis (see Section 2.3). Firstly, we chose top 32 active TFs according to their ranked activity profiles. These 32 TFs include all stress response related factors that are experimentally confirmed. Figure 1B shows the inferred network. Among the 1403 detected TF-target interactions in the network, 153 are the known regulatory links (blue solid lines) previously confirmed (Herrgard et al., 2003; Milo et al., 2002), while the others are novel predictions. Among the hub genes of the network, HSF1 was the most predominant, regulating 155 target genes. The other hub genes included CBF1 (115 targets), UME6 (115 targets), SKN7 (113 target genes), FKH1 (95 targets), STE12 (67 targets), MSN2 (48 targets), MSN4 (44 targets), PHD1 (43 targets), NRG1 (44 targets), YAP1 (29 targets) and CAD1 (8 targets). Six of the hub genes are particularly related to the stress response (HSF1, SKN7, MSN2, MSN4, YAP1 and CAD1) (Gasch et al., 2000). CBF1 and UME6 were also reportedly involving in stress response by previous studies (Sweet et al., 1997; Yu and Li, 2005). Interestingly, HSF1, FKH1, NRG1 and PHD1 were hub TFs on both stress response and cell cycle networks. The heat shock related TF HSF1, in particular, regulated 170 and 155 genes in the two networks, respectively, in which 136 target genes were common between the two networks. Reportedly, HSF1 is activated in G1 of the cell cycle under non-stress conditions and may play a role in the G1 regulation that does not involve the transcription of heat shock genes in the yeast (Bruce et al., 1999).
4 SUMMARY
In this study, we present a novel methodology for unraveling transcriptional regulatory networks by integrated analysis of microarray, ChIP-chip data and TF motif information. The method is based on a two-stage constrained matrix decomposition model. The new method offers several advantages over previously published algorithms: (1) it takes into account the non-linear structure existed in the data, particularly in the TF-target gene interactions; (2) the model considers the combinatorial nature of gene regulation by TFs; (3) it predicts not only TF-target interactions, but furthermore the activating or inhibitory relationships; (4) the model does not assume the correlation between TFs and their target genes on the mRNA expression. We demonstrated the usefulness of the new method on the discovery of condition-specific regulatory networks in the yeast. While known transcriptional regulations were confirmed, novel TF-target interactions were predicted and provide new insights into the regulatory mechanisms of the cell.
Supplementary Material
ACKNOWLEDGEMENTS
This study is supported by the Intramural Research Program, National Institute on Aging, NIH.
Conflict of Interest: none declared.
REFERENCES
- Alter O. Singular value decomposition for genome-wide expression data processing and modeling. Proc. Natl Acad. Sci. USA. 2000;97:10101–10106. doi: 10.1073/pnas.97.18.10101. [DOI] [PMC free article] [PubMed] [Google Scholar]
- Backes C, et al. GeneTrail–advanced gene set enrichment analysis. Nucleic Acids Res. 2007;35:W186–192. doi: 10.1093/nar/gkm323. [DOI] [PMC free article] [PubMed] [Google Scholar]
- Bar-Joseph Z, et al. Computational discovery of gene modules and regulatory networks. Nat. Biotechnol. 2003;21:1337–1342. doi: 10.1038/nbt890. [DOI] [PubMed] [Google Scholar]
- Bernard A, Hartemink AJ. Informative structure priors: joint learning of dynamic regulatory networks from multiple types of data. Pac. Symp. Biocomput. 2005:459–470. [PubMed] [Google Scholar]
- Bruce JL, et al. Activation of heat shock transcription factor 1 to a DNA binding form during the G(1)phase of the cell cycle. Cell Stress Chaperones. 1999;4:36–45. doi: 10.1054/csac.1999.0005. [DOI] [PMC free article] [PubMed] [Google Scholar]
- Brunet JP, et al. Metagenes and molecular pattern discovery using matrix factorization. Proc. Natl Acad. Sci. USA. 2004;101:4164–4169. doi: 10.1073/pnas.0308531101. [DOI] [PMC free article] [PubMed] [Google Scholar]
- Chen G, et al. Clustering of genes into regulons using integrated modeling-COGRIM. Genome Biol. 2007;8:R4. doi: 10.1186/gb-2007-8-1-r4. [DOI] [PMC free article] [PubMed] [Google Scholar]
- Cheng C, Li LM. Systematic identification of cell cycle regulated transcription factors from microarray time series data. BMC Genomics. 2008;9:116. doi: 10.1186/1471-2164-9-116. [DOI] [PMC free article] [PubMed] [Google Scholar]
- Dueck D, et al. Multi-way clustering of microarray data using probabilistic sparse matrix factorization. Bioinformatics. 2005;21(Suppl. 1):i144–i151. doi: 10.1093/bioinformatics/bti1041. [DOI] [PubMed] [Google Scholar]
- Eisen MB, et al. Cluster analysis and display of genome-wide expression patterns. Proc. Natl Acad. Sci. USA. 95:14863–14868. doi: 10.1073/pnas.95.25.14863. [DOI] [PMC free article] [PubMed] [Google Scholar]
- Gasch AP, et al. Genomic expression programs in the response of yeast cells to environmental changes. Mol. Biol. Cell. 2000;11:4241–4257. doi: 10.1091/mbc.11.12.4241. [DOI] [PMC free article] [PubMed] [Google Scholar]
- Gollub J, et al. The Stanford Microarray Database: a user's guide. Methods Mol. Biol. 2006;338:191–208. doi: 10.1385/1-59745-097-9:191. [DOI] [PubMed] [Google Scholar]
- Harbison CT, et al. Transcriptional regulatory code of a eukaryotic genome. Nature. 2004;431:99–104. doi: 10.1038/nature02800. [DOI] [PMC free article] [PubMed] [Google Scholar]
- Haykin S. Neural Networks: A Comprehensive Foundation. Upper Saddle River, NJ: Prentice Hall; 1999. [Google Scholar]
- Herrgard MJ, et al. Reconciling gene expression data with known genome-scale regulatory network structures. Genome Res. 2003;13:2423–2434. doi: 10.1101/gr.1330003. [DOI] [PMC free article] [PubMed] [Google Scholar]
- Hughes JD, et al. Computational identification of cis-regulatory elements associated with groups of functionally related genes in Saccharomyces cerevisiae. J. Mol. Biol. 2000;296:1205–1214. doi: 10.1006/jmbi.2000.3519. [DOI] [PubMed] [Google Scholar]
- Husmeier D. Sensitivity and specificity of inferring genetic regulatory interactions from microarray experiments with dynamic Bayesian networks. Bioinformatics. 2003;19:2271–2282. doi: 10.1093/bioinformatics/btg313. [DOI] [PubMed] [Google Scholar]
- Hyvarinen A, Oja E. Independent component analysis: algorithms and applications. Neural Netw. 2000;13:411–430. doi: 10.1016/s0893-6080(00)00026-5. [DOI] [PubMed] [Google Scholar]
- Jordan MI, et al. An introduction to variational methods for graphical models. In: Jordan MI, editor. Learning in Graphical Models. Cambridge: MIT Press; 1999. [Google Scholar]
- Joung JG, et al. Identification of regulatory modules by co-clustering latent variable models: stem cell differentiation. Bioinformatics. 2006;22:2005–2011. doi: 10.1093/bioinformatics/btl343. [DOI] [PubMed] [Google Scholar]
- Jutten C, Karhunen J. Advances in blind source separation (BSS) and independent component analysis (ICA) for nonlinear mixtures. Int. J. Neural Syst. 2004;14:267–292. doi: 10.1142/S012906570400208X. [DOI] [PubMed] [Google Scholar]
- Kim H, et al. Unraveling condition specific gene transcriptional regulatory networks in Saccharomyces cerevisiae. BMC Bioinformatics. 2006;7:165. doi: 10.1186/1471-2105-7-165. [DOI] [PMC free article] [PubMed] [Google Scholar]
- Lappalainen H, Honkela A. Bayesian nonlinear independent component analysis by multi-layer perceptrons. In: Girolami M, editor. Advances in Independent Component Analysis. Berlin: Springer-Verlag; 2000. pp. 93–121. [Google Scholar]
- Lee SI, Batzoglou S. Application of independent component analysis to microarrays. Genome Biol. 2003;4:R76. doi: 10.1186/gb-2003-4-11-r76. [DOI] [PMC free article] [PubMed] [Google Scholar]
- Lemmens K, et al. Inferring transcriptional modules from ChIP-chip, motif and microarray data. Genome Biol. 2006;7:R37. doi: 10.1186/gb-2006-7-5-r37. [DOI] [PMC free article] [PubMed] [Google Scholar]
- Li H, et al. The discovery of transcriptional modules by a two-stage matrix decomposition approach. Bioinformatics. 2007;23:473–479. doi: 10.1093/bioinformatics/btl640. [DOI] [PubMed] [Google Scholar]
- Li H, Zhan M. Systematic intervention of transcription for identifying network response to disease and cellular phenotypes. Bioinformatics. 2006;22:96–102. doi: 10.1093/bioinformatics/bti752. [DOI] [PubMed] [Google Scholar]
- Liao JC, et al. Network component analysis: reconstruction of regulatory signals in biological systems. Proc. Natl Acad. Sci. USA. 2003;100:15522–15527. doi: 10.1073/pnas.2136632100. [DOI] [PMC free article] [PubMed] [Google Scholar]
- Liebermeister W. Linear modes of gene expression determined by independent component analysis. Bioinformatics. 2002;18:51–60. doi: 10.1093/bioinformatics/18.1.51. [DOI] [PubMed] [Google Scholar]
- Milo R, et al. Network motifs: simple building blocks of complex networks. Science. 2002;298:824–827. doi: 10.1126/science.298.5594.824. [DOI] [PubMed] [Google Scholar]
- Segal E, et al. A module map showing conditional activity of expression modules in cancer. Nat. Genet. 2004;36:1090–1098. doi: 10.1038/ng1434. [DOI] [PubMed] [Google Scholar]
- Shannon P, et al. Cytoscape: a software environment for integrated models of biomolecular interaction networks. Genome Res. 2003;13:2498–2504. doi: 10.1101/gr.1239303. [DOI] [PMC free article] [PubMed] [Google Scholar]
- Spellman PT, et al. Comprehensive identification of cell cycle-regulated genes of the yeast Saccharomyces cerevisiae by microarray hybridization. Mol. Biol. Cell. 1998;9:3273–3297. doi: 10.1091/mbc.9.12.3273. [DOI] [PMC free article] [PubMed] [Google Scholar]
- Sweet DH, et al. Role of UME6 in transcriptional regulation of a DNA repair gene in Saccharomyces cerevisiae. Mol. Cell Biol. 1997;17:6223–6235. doi: 10.1128/mcb.17.11.6223. [DOI] [PMC free article] [PubMed] [Google Scholar]
- Tamayo P, et al. Interpreting patterns of gene expression with self-organizing maps: methods and application to hematopoietic differentiation. Proc. Natl Acad. Sci. USA. 1999;96:2907–2912. doi: 10.1073/pnas.96.6.2907. [DOI] [PMC free article] [PubMed] [Google Scholar]
- Tavazoie S, et al. Systematic determination of genetic network architecture. Nat. Genet. 1999;22:281–285. doi: 10.1038/10343. [DOI] [PubMed] [Google Scholar]
- Troyanskaya O, et al. Missing value estimation methods for DNA microarrays. Bioinformatics. 2001;17:520–525. doi: 10.1093/bioinformatics/17.6.520. [DOI] [PubMed] [Google Scholar]
- Tsai HK, et al. Statistical methods for identifying yeast cell cycle transcription factors. Proc. Natl Acad. Sci. USA. 2005;102:z13532–13537. doi: 10.1073/pnas.0505874102. [DOI] [PMC free article] [PubMed] [Google Scholar]
- Yu T, Li KC. Inference of transcriptional regulatory network by two-stage constrained space factor analysis. Bioinformatics. 2005;21:4033–4038. doi: 10.1093/bioinformatics/bti656. [DOI] [PubMed] [Google Scholar]
- Zhan M. Deciphering modular and dynamic behaviors of transcriptional networks. Genomic Med. 2007;1:19–28. doi: 10.1007/s11568-007-9004-7. [DOI] [PMC free article] [PubMed] [Google Scholar]
- Zhou XJ, et al. Functional annotation and network reconstruction through cross-platform integration of microarray data. Nat. Biotechnol. 2005;23:238–243. doi: 10.1038/nbt1058. [DOI] [PubMed] [Google Scholar]
- Zhu Z, et al. Computational identification of transcription factor binding sites via a transcription-factor-centric clustering (TFCC) algorithm. J. Mol. Biol. 2002;318:71–81. doi: 10.1016/S0022-2836(02)00026-8. [DOI] [PubMed] [Google Scholar]
Associated Data
This section collects any data citations, data availability statements, or supplementary materials included in this article.