Abstract
To gain insight into the mechanisms that underlie angiotensin II (ANG II)-induced cytoplasmic Ca2+ concentration ([Ca]cyt) oscillations in medullary pericytes, we expanded a prior model of ion fluxes. ANG II stimulation was simulated by doubling maximal inositol trisphosphate (IP3) production and imposing a 90% blockade of K+ channels. We investigated two configurations, one in which ryanodine receptors (RyR) and IP3 receptors (IP3R) occupy a common store and a second in which they reside on separate stores. Our results suggest that Ca2+ release from stores and import from the extracellular space are key determinants of oscillations because both raise [Ca] in subplasmalemmal spaces near RyR. When the Ca2+-induced Ca2+ release (CICR) threshold of RyR is exceeded, the ensuing Ca2+ release is limited by Ca2+ reuptake into stores and export across the plasmalemma. If sarco(endo)plasmic reticulum Ca2+-ATPase (SERCA) pumps do not remain saturated and sarcoplasmic reticulum Ca2+ stores are replenished, that phase is followed by a resumption of leak from internal stores that leads either to [Ca]cyt elevation below the CICR threshold (no oscillations) or to elevation above it (oscillations). Our model predicts that oscillations are more prone to occur when IP3R and RyR stores are separate because, in that case, Ca2+ released by RyR during CICR can enhance filling of adjacent IP3 stores to favor a high subsequent leak that generates further CICR events. Moreover, the existence or absence of oscillations depends on the set points of several parameters, so that biological variation might well explain the presence or absence of oscillations in individual pericytes.
Keywords: mathematical model, sarcoplasmic reticulum stores, ryanodine receptors, inositol trisphosphate receptors, medullary pericytes
descending vasa recta (DVR) arise from juxtamedullary efferent arterioles and provide the sole route through which blood flow reaches the renal medulla. DVR are surrounded by smooth remnants (pericytes) that react to vasoconstrictors and vasodilators to modulate luminal diameter (36). In a series of prior studies, we showed that angiotensin II (ANG II) stimulation of DVR pericytes induces cytoplasmic Ca2+ concentration ([Ca]cyt) elevation (36, 52, 56), activation of Ca2+-dependent Cl− channels (ClCa) (34–36), inhibition of K+ channels (9, 34), and depolarization. In addition, during voltage clamp experiments, a large fraction of pericytes responded to ANG II with spiking oscillations of inward Cl− current, synchronized to underlying [Ca]cyt oscillations (35, 52). The inward currents were inhibited by blockade of Cl− channels (niflumic acid), ryanodine receptor (RyR) stimulation (ryanodine, caffeine), or nonselective cation channel inhibition (SKF-96365) (52). Together, these observations suggested that initiation of [Ca]cyt elevation by inositol trisphosphate (IP3) generation, followed by repetitive cycles of Ca2+-induced Ca2+ release (CICR) and endoplasmic reticulum/sarcoplasmic reticulum (ER/SR) store refilling, underlies ANG II-induced pericyte oscillations.
The reasons that pericyte ANG II responses are sometimes monophasic and sometimes oscillatory remain unclear. Many events must participate in the genesis of oscillations, including openings and closings of various ion channels, IP3 receptor (IP3R)- and RyR-mediated release of ER/SR Ca2+, activity of ER/SR ATP-dependent Ca2+ [sarco(endo)plasmic reticulum Ca2+-ATPase (SERCA)] pumps, variation of compartmental ion concentrations, and Ca2+ buffering. To delineate those roles, we expanded on a previously formulated mathematical simulation of ion fluxes that is largely based on the dimensions and conductances of DVR pericytes (12, 13). The model accounts for plasma membrane (PM) and ER/SR pumps, exchangers and ion channels, cytosolic and store Ca2+ buffering, and the privileged exchange between the ER/SR and PM via subplasmalemmal microdomain spaces (7). We revised the model to account for ANG II stimulation of IP3 generation and variation of Ca2+ store configuration. Two possibilities are considered, one in which release of Ca2+ via RyR and IP3R occurs from a common space and a second in which RyR and IP3R reside on separate stores. The model predicts that oscillations are more prone to occur when IP3R and RyR stores are separate because, in that case, Ca2+ released by RyR during CICR enhances filling of adjacent IP3 stores to yield a high subsequent leak rate that generates repetitive CICR events. Filling of IP3R stores during RyR-induced CICR leads to the prediction that repetitive cycles of IP3R and RyR store filling and emptying occur out of phase.
MODEL EQUATIONS
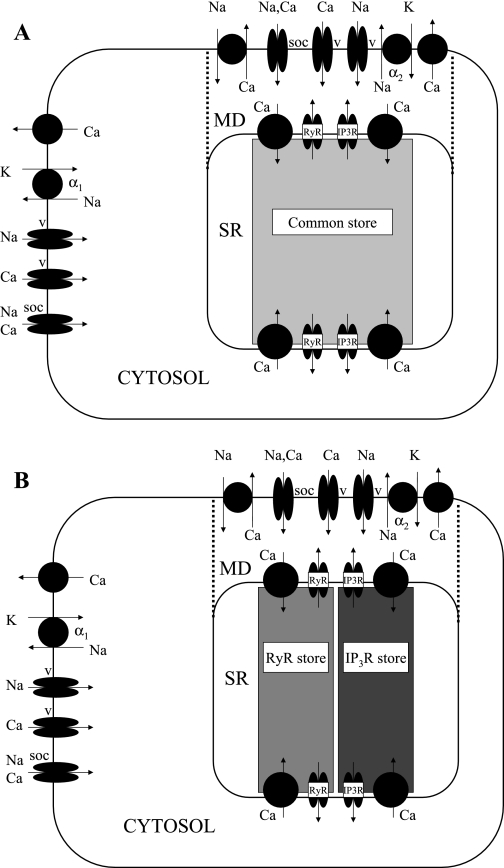
Throughout this study we compare two models: the common-store model assumes that RyR and IP3R share a common Ca2+ store, whereas the separate-store model posits the existence of two functionally distinct Ca2+ stores, the first expressing only IP3R and the second expressing only RyR. In the latter model, we assume that the two stores each communicate with both the cytosol and the microdomains; the SERCA pumps that refill each store at the cytosol-SR interface and the microdomain-SR interface are also distinguished. The model and its two hypotheses are illustrated in a schematic diagram of the cell in Fig. 1.
Fig. 1.
Schematic representation of the cell, with its 3 compartments: bulk cytosol (Cyt), microdomains (MD), and sarcoplasmic reticulum (SR). Not shown are KCa, Kir, KATP, and Kv channels and the chelating agents calmodulin and calsequestrin. A: common-store model. B: separate-store model.
The equations that describe ionic currents across SERCA pumps, RyR, IP3R, and store-operated channels (SOC), as well as those describing all Cl− currents, are summarized below. Other model equations are in the appendix. All of the Cl− transport equations are new additions to the model. Other ionic transport equations are identical to those employed in our previous study (12), except for the RyR open probability (Eqs. 4–6), the inward rectifier potassium (Kir) conductance (Eqs. A3–A5), and the voltage-operated sodium (VONa) inactivation variable (Eq. A28). Parameter values are given in Table 1 and resting concentrations in Table 2.
Table 1.
Ionic current parameters
| Parameter | Description | Value | Reference |
|---|---|---|---|
| ISERCA,max | Sarco(endo)plasmic reticulum Ca2+-ATPase (SERCA) maximum current | 200/100 pA | See text |
| Kmf | Ca2+-ATPase constant for cytosolic or microdomain Ca2+ | 310 nM† | 14 |
| Kmr | Ca2+-ATPase constant for SR Ca2+ | 1.7 mM | 41 |
| nH | SR Ca2+-ATPase Hill coefficient | 2† | 37 |
| νRyR | Ryanodine receptor (RyR) Ca2+ conductivity | 12 s−1† | This study |
| Ka | RyR constant | 0.3722 μM* | 47 |
| Kb | RyR constant | 0.6360 μM* | 47 |
| Kc | RyR constant | 0.0571 μM* | 47 |
| Kc− | RyR constant | 0.1 s−1* | 47 |
| νIP3R | IP3R Ca2+ conductivity | 10 s−1† | This study |
| νip3 | Rate constant for IP3 production | 1.85 s−1 | 12 |
| [IP3ref] | Reference IP3 concentration | 240 nM | 11 |
| α4 | Feedback constant for Ca2+ stimulation of IP3 production | 0.5 | 12 |
| k4 | Dissociation constant for Ca2+ stimulation of IP3 production | 1.1 μM | 11 |
| Ir | Rate constant for IP3 consumption | 1 s−1 | 11 |
| d1 | IP3 receptor dissociation constant | 0.13 μM | 11 |
| a4 | IP3 receptor binding constant | 0.2 μM−1·s−1 | 11 |
| d4 | IP3 receptor dissociation constant | 144.5 nM | 11 |
| a5 | IP3 receptor binding constant | 20 μM−1·s−1 | 11 |
| d5 | IP3 receptor dissociation constant | 82.34 nM | 11 |
| GCaSOC,max | Maximum Ca2+ SOC current conductance | 87 pS† | This study¶ |
| KSOC | ISOC SR Ca2+ constant | 100 μM | 12 |
| ΔCT | Chloride cotransport parameter | 87.8251 mV* | 22 |
| JNaCl,max | Maximum flux though Na+-Cl− cotransporter | 6.0 × 10⁻¹⁷ mol/s* | This study¶ |
| JKCl,max | Maximum flux though K+-Cl− cotransporter | 3.5 × 10⁻¹⁸ mol/s* | 22 |
| JNKCC,max | Maximum flux though Na+-K+-2Cl− cotransporter (NKCC) | 6.0 × 10⁻¹⁷ mol/s* | This study¶ |
| KNaNKCC | Na+ half-saturation constant for NKCC | 46 mM* | 43 |
| KKNKCC | K+ half-saturation constant for NKCC | 4 mM* | 43 |
| KCl,1NKCC | Cl− first half-saturation constant for NKCC | 78 mM* | 43 |
| KCl,2NKCC | Cl− second half-saturation constant for NKCC | 78 mM* | 43 |
| kon | Ca-Cl channel on-rate | 3 μM−1·s−1* | 24 |
| koff | Ca-Cl channel off-rate | 50 s−1* | 24 |
| α1 | Ca-Cl kinetic constant | 10 s−1* | 24 |
| α2 | Ca-Cl kinetic constant | 30 s−1* | 24 |
| α3 | Ca-Cl kinetic constant | 300 s−1* | 24 |
| β1, β2, β3 | Ca-Cl kinetic constants | 224 exp(−3.8 − 0.01Vmj) s−1* | 24 |
| GClCa,max | Ca-Cl channel maximum conductance | 12 nS* | 34 |
| GK,b | K+ background current conductance | 0.010 nS | 51 |
| GNa,b | Na+ background current conductance | 0.010 nS | 51 |
| GCa,b | Ca+ background current conductance | 0.012 nS | 51 |
| GCl,b | Cl− background current conductance | 0.010 nS* | This study |
| GKir,max | Inward rectifier conductance | 0.3 nS† | 8 |
| [K]ref | Reference K+ concentration | 5.4 mM | 51 |
| GKv,max | Maximum IK,v conductance | 9.8325 nS | 51 |
| GKATP,maxPATP | Maximum IK,ATP conductance at resting ATP concentration | 1.036 nS | 9 |
| nATP | IK,ATP constant | 0.463 | 9 |
| GKCa,max | Maximum IK,Ca conductance | 0.5 nS | 51 |
| τPF | Fast time constant for IK,Ca | 0.5 ms | 51 |
| τPS | Slow time constant for IK,Ca | 11.5 ms | 51 |
| INaK,α1,max | Maximum Na+/K+-ATPase α1-isoform current | 1.95 μA/μF† | This study¶ |
| INaK,α2,max | Maximum Na+/K+-ATPase α2-isoform current | 0.30 mA/μF† | This study¶ |
| Km,K | K+ half-saturation constant for Na+-K+-ATPase (both isoforms) | 1.5 mM | 12 |
| Km,Na,α1 | Na+ half-saturation constant for Na+-K+-ATPase α1-isoform | 12 mM | 12 |
| Km,Na,α2 | Na+ half-saturation constant for Na+-K+-ATPase α2-isoform | 22 mM | 12 |
| INaCa,max | Maximum Na+/Ca2+ exchange current | 14.13 μA/μF† | 41 |
| KmCai | Internal Ca2+ half-saturation constant for Na+/Ca2+ exchange | 3.59 μM | 41 |
| KmCao | External Ca2+ half-saturation constant for Na+/Ca2+ exchange | 1.3 mM | 41 |
| KmNai | Internal Na+ half-saturation constant for Na+/Ca2+ exchange | 12.29 mM | 41 |
| KmNao | External Na+ half-saturation constant for Na+/Ca2+ exchange | 87.5 mM | 41 |
| ksat | Na+/Ca2+ exchange saturation factor at negative potentials | 0.27 | 41 |
| γ | Constant for voltage dependence of Na+/Ca2+ exchange | 0.35 | 41 |
| KmCa,act | Constant for Na+/Ca2+ exchange | 0.125 μM† | 22 |
| GVONa,max | Maximum IVONa conductance | 2.86 nS | 54 |
| τm | IVONa activation time constant | 0.1 mS | 54 |
| τh | IVONa inactivation time constant | 1 mS | 54 |
| ICa,P,max | Maximum sarcolemmal Ca2+ pump current | 1 μA/μF† | This study¶ |
| Km,Ca,P | Half-saturation constant for sarcolemmal Ca2+ pump | 0.17 μM† | 15 |
| GCaL,max | Maximum ICa,L conductance | 1.4151 nS | 51 |
| [CM]tot | Total concentration of calmodulin binding sites available for Ca2+ binding in cytosol or microdomains | 0.1 mM† | 51 |
| kCMon | Ca2+ on-rate for calmodulin | 34 μM−1·s−1 | 41 |
| kCMoff | Ca2+ off-rate for calmodulin | 8.84 s−1† | Based on calmodulin dissociation constant (51) |
| [Bf]tot | Total concentration of other Ca2+-binding proteins in cytosol or microdomains | 0.4 mM† | 51 |
| kBfon | Ca2+ on-rate for other binding proteins | 100 μM−1·s−1 | 41 |
| kBfoff | Ca2+ off-rate for other binding proteins | 300 s−1† | Based on caltropin dissociation constant (29) |
| [Calseq]SRtot | Total concentration of calsequestrin sites available for Ca2+ binding in SR | 140 μM | 41 |
| kCalseqon | Ca2+ on-rate for calsequestrin | 100 μM−1·s−1 | 41 |
| kCalseqoff | Ca2+ off-rate for calsequestrin | 80,000 s−1† | Based on calsequestrin dissociation constant (48) |
Unless otherwise indicated, parameter values are identical to those of the original model (12). SR, sarcoplasmic reticulum; VONa, voltage-activated sodium.
Parameters were chosen so as to yield resting concentrations compatible with experimental observations.
New parameter;
revised parameter value.
Table 2.
Resting values
| Variable | Resting Value | Units |
|---|---|---|
| Vmcyt | −79 | mV |
| Vmmd | −79 | mV |
| [K]cyt | 144 | mM |
| [K]md | 144 | mM |
| [Na]cyt | 8.6 | mM |
| [Na]md | 15.9 | mM |
| [Cl]cyt | 27 | mM |
| [Cl]md | 24 | mM |
| [Ca]cyt | 107 | nM |
| [Ca]md | 153 | nM |
| [Ca]SR | 0.54 (common store) | mM |
| 0.52/0.56 (separate store)* |
cyt, Cytosol; md, microdomain.
First and second values correspond to the IP3R and RyR stores, respectively.
The concentrations of ion i (i = K+, Na+, Cl−, and Ca2+) in the cytosol, the microdomains, and the extracellular environment are denoted by [i]cyt, [i]md, and [i]out, respectively. In the common-store model, the SR Ca2+ store concentration is denoted by [Ca]SR; in the separate-store model, the Ca2+ concentration of the store expressing only IP3R and that of the store expressing only RyR are denoted by [Ca]IP3R-SR and [Ca]RyR-SR, respectively. We also distinguish between the transmembrane potential above the bulk cytosol (V ) and that over the microdomains (V
 ). The fraction of the cell membrane that lies directly above the cytosol (fcyt) is taken as 0.858 and that above the microdomains (fmd) as 0.142 (25).
The Nernst potential of ion i (valence zi) is calculated based on the concentration difference between the extracellular environment and the intracellular compartment j (j = cyt or md):
 |
(1) |
where R is the gas constant, T is the temperature, and F is the Faraday constant. The extracellular concentrations of K+, Na+, Cl−, and Ca2+ are taken as 5.4, 140, 110, and 2 mM, respectively.
SERCA Pump Current, ISERCA
We assume that the SERCA pumps are located at both the cytosol-SR interface and the microdomain-SR interface (Fig. 1). The uptake current from compartment j (j = cyt or md) into the SR Ca2+ stores is given by (39):
 |
(2) |
where Kmf and Kmr are saturation constants, and H is the Hill coefficient.
In the separate-store model, we distinguish between the pumps that refill the Ca2+ store expressing only IP3R and those that refill the Ca2+ store expressing only RyR. The term [Ca]SR in Eq. 2 is then replaced accordingly by [Ca]IP3R-SR or [Ca]RyR-SR.
As indicated by Eq. 2, the SERCA pumping direction can be reversed if [Ca]SR is large enough; that is, I < 0 if ([Ca]j/Kmf) < ([Ca]SR/Kmr). Backflux through the pump has been described in SR membrane vesicles and intact myocytes (40). Conversely, SERCA pumps can be saturated if [Ca]j is large enough; that is, I
 ≈ ISERCA,maxfj if ([Ca]j/Kmf) ≫ ([Ca]SR/Kmr).
The maximum current ISERCA,max is chosen as 200 pA in the common-store model (51) and as 100 pA each for IP3R-SERCA and RyR-SERCA in the separate-store model.
RyR Current, IRyR
The RyR model is that developed by Keiser and Levine, with parameters from the recent study of Ventura and Sneyd (47). The RyR-mediated release current into compartment j (j = cyt or md) is given by:
 |
(3) |
where νRyR is the Ca2+ conductivity of RyR, volSR is the SR volume (0.07 pl), and [Ca]SR equals [Ca]RyR-SR in the separate-store model. The open probability of RyR (P ) is calculated as:
 |
(4) |
 |
(5) |
 |
(6) |
where Ka, Kb, Kc, and K are constants and ω is the fraction of channels in the two open states and the dominant closed state.
IP3R Current, IIP3R
The IP3R model is that developed by De Young and Keiser (11). The IP3R-mediated release current in compartment j (j = cyt or md) is calculated as:
 |
(7) |
where νIP3R is the Ca2+ conductivity of IP3R, x110 is the fraction of receptors bound by one activating Ca2+ and one IP3 (calculated as described below), and [Ca]SR equals [Ca]IP3R-SR in the separate-store model. The concentration of IP3 in compartment j (j = cyt or md) is given by:
 |
(8) |
where νip3 is the maximum rate of IP3 production, Ir is the rate constant for IP3 consumption, [IP ] is a constant, and α4 determines the strength of the Ca2+ feedback on IP3 production.
The kinetic model for IP3R developed by De Young and Keiser (11) assumes that three equivalent and independent subunits are involved in conduction and that each subunit has one IP3 binding site (denoted as site 1) and two Ca2+ binding sites, one for activation (site 2) and the other for inhibition (site 3). The fraction of receptors in state S is denoted by x
 (ij equals 0 or 1), where the jth binding site is occupied if ij = 1. All three subunits must be in the state S110 (corresponding to the binding of 1 IP3 and 1 activating Ca2+) for the IP3R channel to be open. Assuming rapid equilibrium for IP3 binding, x
 = ([IP3]j/dk)x
 (where k = 1 if β = 0 and k = 3 if β = 1). In particular, the open probability of IP3R depends on the fraction of receptors in the S110 state, x
 = ([IP3]j/d1)
 . The conservation equations for the fractions
 at the SR-microdomain interface (j = md) or at the SR-cytosol interface (j = cyt) can be written as:
 |
(9) |
 |
(10) |
 |
(11) |
 |
(12) |
Store-Operated Channel Current, ISOC
The Ca2+ current through SOC into compartment j (j = cyt or md) is calculated as:
 |
(13) |
where [Ca]SR is taken as the average of [Ca]IP3R-SR and [Ca]RyR-SR in the separate-store model and GCaSOC,max is maximum Ca2+ SOC current conductance. The [Ca]SR dependence of ICa,SOC illustrates the fact that decreases in SR Ca2+ load stimulate SOC activity. The Goldman-Huxley-Katz current equation is used to relate the SOC Na+ and Ca2+ currents in compartment j:
 |
(14) |
The Ca+-to-Na+ SOC permeability ratio ( /P
/P ) is taken to be equal to 8 (10).
Chloride Currents
The Cl− transport pathways expressed by DVR pericytes have not been fully characterized. Following the approach of Hund and Rudy (22), we consider the following types of Cl− fluxes: the background Cl− current (ICl,b), the Ca2+-dependent Cl− current (ICl,Ca), and the Cl− fluxes through Na+-Cl− cotransporters (INaCl) and K+-Cl− cotransporters (IKCl). We also include the Cl− flux through Na+-K+-2Cl− cotransporters (INKCC), based on the model of Novotny and Jakobsson (32).
Cl− background current.
 |
(15) |
Cl− flux through Na+-Cl− cotransporters.
 |
(16) |
where ΔCT is a Cl− cotransport parameter.
Cl− flux through K+-Cl− cotransporters.
 |
(17) |
Cl− flux through Na+-K+-2Cl− cotransporters.
 |
(18) |
Cl− current through Ca2+-dependent channels.
Pallone and colleagues showed that DVR pericytes express a 16.8-pS Ca2+-dependent Cl− channel (55). The behavior of Ca2+-dependent Cl− channels is modeled with a kinetic scheme proposed by Kuruma and Hartzell (24). This model assumes the existence of four closed states (C0–C3) and three open states (O1–O3). The channel is able to open from each of the Ca2+-bound closed states (C1–C3); transitions between the three open states are forbidden. If y , y
, y , y
, y , and y
 denote the fraction of channels in states C0, C1, C2, and C3, respectively, and y
 , y
, y , and y
 denote the fraction of channels in states O1, O2, and O3, respectively, the model yields the following kinetic equations:
 |
(19) |
 |
(20) |
 |
(21) |
 |
(22) |
 |
(23) |
The channel opening rates (αk)k=1–3 are assumed to be Ca2+- and voltage independent and to increase with the number of Ca2+ ligands bound to the closed states. The channel closing rates (βk)k=1–3 are expressed as βk(V) = λβexp(V1 + V2·V ). The current through the Ca2+-activated Cl− channels above compartment j (j = cyt, md) is then given by:
 |
(24) |
RESULTS
IP3R- and RyR-Mediated Ca2+ Release
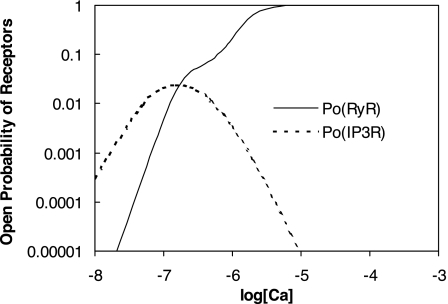
As described below, interaction between RyR- and IP3R-mediated Ca2+ release from the SR into the cytosol and microdomains plays a fundamental role in model predictions of calcium signaling. To illustrate and contrast the salient properties, we begin by plotting the open probability (Po) of RyR and IP3R at steady state, as a function of Ca2+ concentration. The open probability of IP3R was calculated assuming that [IP3] = 240 nM. As shown in Fig. 2, when [Ca] is ∼100 nM (i.e., under resting conditions), P is significantly lower than P
 (5 × 10⁻³ vs. 2 × 10⁻²). As [Ca] increases to ∼200 nM, P
 and P
and P rise with [Ca] at a similar rate. Beyond the 200 nM threshold, however, an important departure ensues: P
 decreases because IP3R is inhibited by high [Ca], whereas P
 increases rapidly to approach unity when [Ca] ∼ 10 μM. Consequently, in the cytosol, IRyR is generally negligible compared with IIP3R, while in the microdomains, where [Ca]md can reach very high levels, IRyR significantly surpasses IIP3R. As shown below, CICR via activation of RyR is a critical feature that accounts for oscillatory behavior. Because of the high [Ca] therein, CICR is readily triggered within microdomains but leads to asynchronous alteration of [Ca] in various compartments of the cell.
Fig. 2.
Open probability (Po) of ryanodine receptors (RyR) and inositol trisphosphate receptors (IP3R) at steady state as a function of calcium concentration ([Ca], in M). In these calculations, [IP3] is taken as 240 nM.
Effects of Elevating External KCl
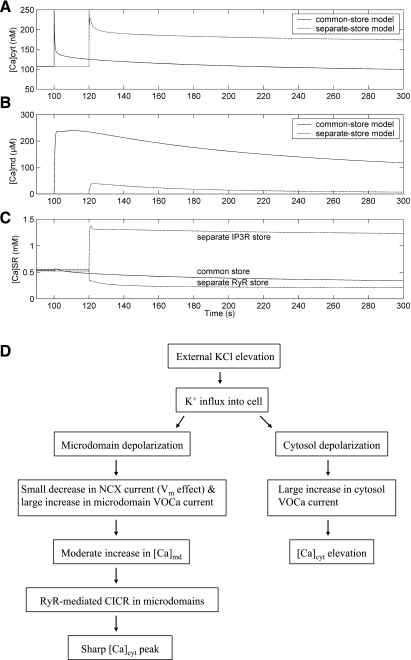
We first simulated the effects of elevating extracellular KCl concentration to 100 mM, akin to the common experimental maneuver of depolarizing the membrane without exposing the cell to specific ligands. As observed experimentally (56), the model predicts a [Ca]cyt increase after the step change (Fig. 3). The general motivation for this experimental maneuver is to test whether voltage-operated Ca2+ (VOCa) influx will arise. The consequences of raising external KCl concentration, however, are predicted to be more complex and dependent on the Ca2+ store configuration.
Fig. 3.
Effects of external KCl elevation on Ca2+ concentrations in cytosol ([Ca]cyt, A), microdomains ([Ca]md, B), and SR ([Ca]SR, C) as a function of time (in s). For clarity of presentation, [K]out is raised from 5.4 to 100 mM at t = 100 s for the common-store model and at t = 120 s for the separate-store model. D: signaling pathway after external KCl elevation.
The cascade of events is summarized in Fig. 3D. Membrane depolarization (from −79 to +3 mV above the cytosol) affects net Ca2+ entry in two ways. First, it gates opening of VOCa channels that mediate Ca2+ influx into cytoplasm and microdomains, favoring elevation of [Ca]cyt and [Ca]md. Second, it provides an additional contribution to the increase in [Ca]md by reducing driving forces that favor the export of Ca2+, in exchange for 3 Na+, by Na+/Ca2+ exchangers (NCX). When [Ca]md exceeds the threshold for stimulation of RyR-mediated CICR, an additional marked elevation of [Ca]md ensues, accounting for the ability of KCl to induce an early [Ca]cyt peak. Overall, KCl depolarization is predicted to raise [Ca]md into the micromolar range and saturate microdomain SERCA pumps. The large rise in [Ca]md that follows CICR eventually drives a sufficiently high rate of Ca2+ export via NCX to halt further rise of [Ca]md. In addition, partial membrane repolarization (following K+ efflux and increase in electrogenic Na+-K+-ATPase activity) reduces Ca2+ influx into the cell via VOCa channels, accounting for the subsequent fall of [Ca]cyt.
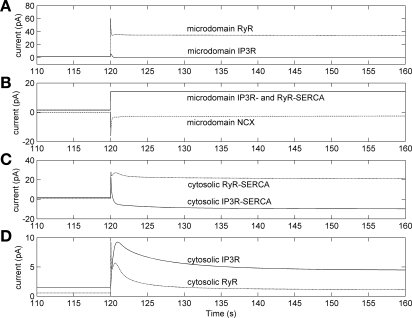
The critical difference between predictions based on common versus separate IP3R/RyR stores then becomes apparent. In the common-store model, on KCl depolarization SR Ca2+ remains depleted by CICR. As a consequence, SERCA pumps continue to transport Ca2+ from the cytosol into the SR at a high rate, causing [Ca]cyt to remain below the resting value that existed before external KCl elevation (Fig. 3A); a plateau [Ca]cyt elevation is not achieved. In contrast, the separate-store model yields a different prediction (Fig. 3B): the marked rise in [Ca]md, related to depletion of RyR stores during CICR, stimulates SERCA-driven Ca2+ uptake into the IP3R stores, where the Ca2+ content rises. Thus the Ca2+ contents of RyR and IP3R stores simultaneously fall and rise, respectively, in opposition (Fig. 3C). Stated simply, the high [Ca]md achieved during CICR greatly stimulate microdomain IP3R-SERCA pumps to load IP3R stores at the expense of RyR stores. In fact, the IP3R store Ca2+ is predicted to increase so much that the cytosolic IP3R-SERCA pump reverses direction, carrying Ca2+ into the cytosol to elevate [Ca]cyt (Fig. 4).
Fig. 4.
Effects of external KCl elevation on microdomain and cytosolic Ca2+ currents as a function of time (in s), using the separate-store model. At t = 120 s, [K]out is raised from 5.4 to 100 mM. A: IP3R current is low because of its inhibition by [Ca]md elevation while RyR current is large because of [Ca]md-mediated stimulation. B: [Ca]md elevation stimulates both IP3R store- and RyR store-sarco(endo)plasmic reticulum Ca2+-ATPase (SERCA) pumps facing the microdomains to the point that they become saturated. NCX, Na+/Ca2+ exchanger. C: the increase in IP3R-SR store Ca2+ leads to reversal of pumping by IP3R-SERCA that face the cytosol (negative values mean flux from the SR to the cytosol). The RyR-SERCA facing the cytosol take up Ca2+ from the cytosol into the RyR-SR store. D: the large increase in [Ca]SR-IP3R leads to elevation of Ca2+ current through those IP3R that face the cytosol, and the rise in [Ca]cyt stimulates elevation of current through the RyR that face the cytosol.
Effects of Exposure to ANG II: Common-Store Model
ANG II is a potent constrictor of microvessels. In particular, it rapidly contracts the DVR pericytes, on which many of the characteristics of this model are based (12, 13). The effects of ANG II binding to the AT1 receptor include IP3 generation, inhibition of several classes of K+ channels (20, 21, 30, 38), and elevation of [Ca]cyt. For simplicity, we simulated those effects as a 100% step increase in νip3, the maximum rate of IP3 production in Eq. 8, and 90% inhibition of all types of K+ channels.
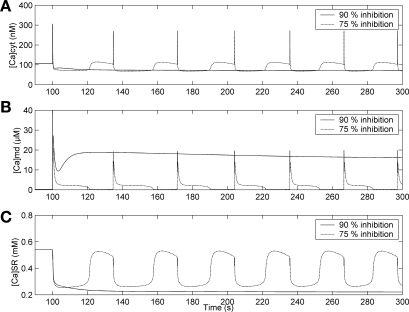
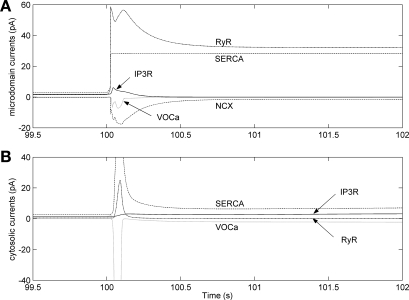
The predictions of the common-store model are shown in Fig. 5. The increase in IP3 stimulates IP3R-mediated Ca2+ release from the SR, while K+ channel inhibition results in membrane depolarization above both the cytosol and microdomains. The Ca2+ release combines with depolarization-induced gating of inward VOCa currents to raise [Ca]cyt and [Ca]md. In turn, the [Ca]md increase triggers RyR-mediated CICR in the microdomains to further raise [Ca]md. The large release of Ca2+ from RyR significantly depletes the common SR Ca2+ store and saturates microdomain SERCA pumps (Fig. 6). The subsequent increase in Ca2+ export via NCX limits the rise in [Ca]md, while increased pumping of Ca2+ into the SR partly repolarizes the membrane and lowers [Ca]cyt. As in the case of external KCl elevation, the SR Ca2+ stores remain depleted so that the rate of Ca2+ uptake from the cytosol remains elevated, reducing [Ca]cyt to ∼30% below pre-ANG II values (Fig. 5).
Fig. 5.
Effects of 90% and 75% K+ channel inhibition and 100% increase in IP3 production at t = 100 s on [Ca]cyt (A), [Ca]md (B), and [Ca]SR (C), with the common-store model.
Fig. 6.
Effects of 90% K+ channel inhibition and 100% increase in IP3 production at t = 100 s on microdomain (A) and cytosolic (B) Ca2+ currents, with the common-store model. The scale in B has been reduced for clarity; the cytosolic SERCA and voltage-operated Ca2+ (VOCa) currents peak at +73 and −103 pA, respectively.
Some investigators have observed that ANG II also raises the conductance of VOCa channels, denoted by GCa,L (33, 39). We therefore simulated the combined effects of 90% inhibition of K+ channels, 100% increase in IP3 production, and 100% increase in GCa,L at t = 100 s. The results (not shown) suggest that the qualitative effects on Ca2+ concentrations are similar, but the [Ca]cyt and [Ca]md peaks are higher because of the larger influx of Ca2+ via VOCa channels. In particular, [Ca]cyt increases up to ∼ 1,200 nM (vs. 310 nM without the step change in GCa,L; see Fig. 5) and stabilizes around 100 nM.
If, however, the extent of inhibition of K+ channels is less (i.e., ≤75% rather than 90%), a twofold increase in νip3 yields [Ca]cyt oscillations (Fig. 5). In that case, the accompanying membrane depolarization is smaller (29 mV lower than that which occurs with 90% inhibition), [Ca]md elevation following CICR is less, SERCA pumps do not saturate, and SR Ca2+ avoids continuous depletion. Once [Ca]md has dropped back to ∼100 nM and the stores are replenished, the ensuing slow, IP3R-mediated leak of Ca2+ from the SR into the microdomains gradually raises [Ca]md to the CICR threshold, triggering repetitive oscillations.
The generation of oscillations is also dependent on the extent of IP3 generation. For oscillations to occur, νip3 must increase by at least 100% or 85% if the degree of K+ channel inhibition (inhibK) is 75% or 50%, respectively. When VOCa conductance (GCa,L) is assumed to increase in conjunction with K+ channel inhibition, the CICR-induced [Ca]md peak is higher and the model fails to predict oscillations when inhibK = 75%. This prediction is insensitive to IP3 generation; it is unaltered even if νip3 increases by more than a factor of 5.
Effects of Exposure to ANG II: Separate-Store Model
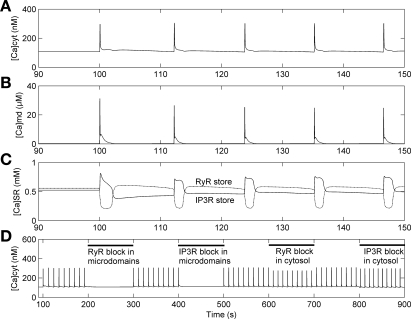
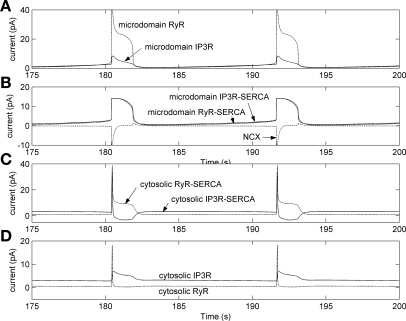
In contrast to the common-store model, the separate-store model predicts that [Ca]cyt oscillations can follow the combined effects of 90% K+ channel inhibition and 100% increase in IP3 production (Fig. 7). The underlying mechanisms can be dissected by simultaneously analyzing Ca2+ concentrations (Fig. 8) and Ca2+ currents (Fig. 9). As in the common-store model, the sudden increase in IP3 and depolarization-mediated VOCa activation raise both [Ca]cyt and [Ca]md, triggering RyR-mediated CICR in the microdomains. In contrast to the common-store model, however, when the RyR store is depleted by CICR the IP3R store fills because of stimulation of microdomain IP3R-SERCA pump activity by high [Ca]md (Fig. 9). The overall consequence is that a fraction of the Ca2+ released from the RyR-SR store is transferred through microdomains to the IP3R-SR store.
Fig. 7.
Effects of 90% K+ channel inhibition and 100% increase in IP3 production at t = 100 s on Ca2+ concentrations in cytosol (A), microdomains (B), and SR stores (C), with the separate-store model. The additional effects of IP3R and RyR block on [Ca]cyt are shown in D.
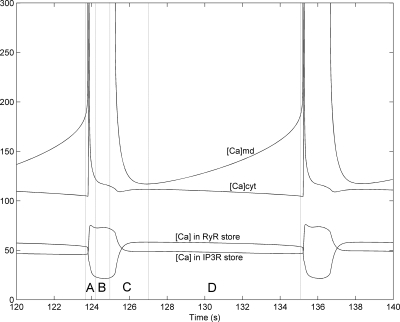
Fig. 8.
Effects of 90% K+ channel inhibition and 100% increase in IP3 production at t = 100 s on [Ca]cyt (nM), [Ca]md (nM), and [Ca]SR (×102 mM), with the separate-store model. Note that the [Ca]md peak is off-scale. Phase A: RyR-mediated Ca2+-induced Ca2+ release (CICR) in microdomains, sharp [Ca]md ascent. Subsequent depletion of RyR stores and filling up of IP3R stores. Rapid membrane depolarization and repolarization, [Ca]cyt peak. Phase B: activation of NCX current, sharp [Ca]md descent. Ca2+ content in RyR and IP3R stores reaches minima and maxima. Phase C: slower [Ca]md descent. Subsequent replenishment of RyR stores and depletion of IP3R stores as IRyRmd and IIP3Rmd-SERCA decrease. Phase D: slowly rising RyR- and IP3R-mediated Ca2+ release into microdomains, progressive [Ca]md increase. Stabilized Ca2+ concentration in cytosol and SR stores.
Fig. 9.
Effects of 90% K+ channel inhibition and 100% increase in IP3 production at t = 100 s on microdomain and cytosolic Ca2+ currents, with the separate-store model. A: microdomain RyR current rises up to 60 pA during CICR, whereas microdomain IP3R current remains low because its inhibition by [Ca]md elevation. B: CICR-mediated [Ca]md increase stimulates IP3R store- and RyR store-SERCA pumps facing the microdomains, as well as Ca2+ export from the microdomains via NCX (minimal value, −14 pA). C: immediately after CICR, the IP3R-SERCA and RyR-SERCA that face the cytosol both take up Ca2+ from the cytosol to replenish SR stores. Soon thereafter, the increase in IP3R-SR store Ca2+ leads to reversal of pumping by IP3R-SERCA that face the cytosol. D: cytosolic IP3R current rises and falls in conjunction with [Ca]SR-IP3R. Cytosolic RyR current is stimulated during the depolarization-induced rise in [Ca]cyt.
In concert with CICR, the sharp [Ca]md increase stimulates Ca2+ export from the microdomains via NCX. Both [Ca]md and [Ca]cyt then fall, favored by NCX activity and inhibition of VOCa by membrane repolarization, respectively. Thus, after CICR, the Ca2+ loads in the RyR and IP3R stores reach their respective minima and maxima and then reverse course. The reversal occurs because the RyR-SR store is eventually replenished by RyR-SERCA pumps that transport Ca2+ at a rate that exceeds RyR-mediated losses. Conversely, the IP3R store is depleted as the rate of Ca2+ uptake by the microdomain IP3R-SERCA pumps declines with decreasing [Ca]md.
In the next phase, Ca2+ concentrations in the cytosol and the SR tend to stabilize while RyR- and IP3R-mediated Ca2+ leak into microdomains slowly rises. Because of the leak, [Ca]md increases progressively, until it reaches the threshold needed to generate a repeat cycle of CICR (Fig. 8).
As expected, oscillations vanish after elimination of either IP3R-mediated or RyR-mediated Ca2+ release into the microdomains (Fig. 7D). In contrast, block of cytosolic IP3R or cytosolic RyR reduces the magnitude of oscillations but does not affect their frequency (Fig. 7D). These results indicate that, together, IP3 and CICR events in the microdomains control the appearance of Ca2+ oscillations in the entire cell.
As a baseline, we assumed that store-operated cation channel activity is regulated by the average of Ca2+ concentrations in the IP3 and RyR storage pools. If SOC activity were controlled by [Ca]IP3R-SR alone, which is lower than the average SR Ca2+ concentration during oscillations (Fig. 8), Ca2+ influx via SOC channels would increase along with the frequency of oscillations (0.11 vs. 0.09 Hz). Conversely, if SOC channels were controlled by [Ca]RyR-SR, the frequency of oscillations would decrease to 0.05 Hz. There would be no significant effect on the amplitude of oscillations in either case.
Role of IP3R and RyR in ANG II-Mediated Oscillations
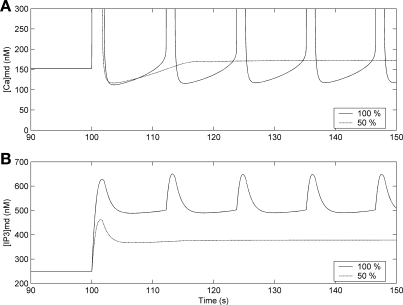
A comparison between the common-store and separate-store models suggests that the key to generation of oscillations after the initial IP3-mediated stimulation is 1) an increase in [Ca]md that is sufficient to reach the CICR threshold and 2) sufficient reloading of SR Ca2+ stores following CICR-induced [Ca]md elevation. In the single-pool model, SR Ca2+ stores are predicted to remain depleted by the first CICR event if membrane depolarization is too large. This does not occur in the dual-pool model, however, because as one type of store is depleted the other is replenished. In both models, the upward drift of [Ca]md requires sufficient [IP3]md elevation to release IP3R-SR store Ca2+ into the microdomains. Consistent with that interpretation, the separate-store model predicts that oscillations would not occur if IP3 production following ANG II rose by 50% instead of 100% (Fig. 10A) because the upward drift of [Ca]md would be too small to trigger CICR anew. More specifically, the model predicts that the ANG II-mediated increase in IP3 production must be ≥70% to generate [Ca]cyt oscillations. When VOCa conductance (GCa,L) is assumed to increase in conjunction with 90% K+ channel inhibition, that threshold is lower: if GCa,L increases by a factor of 2, ANG II-mediated increase in IP3 production must be >40% to generate [Ca]cyt oscillations. Note that because of the feedback activation by [Ca] on [IP3] production (see parameter α4 in Eq. 8), [IP3] is predicted to oscillate in tandem with [Ca] (Fig. 10B).
Fig. 10.
Effects of 90% K+ channel inhibition and either 100% or 50% increase in IP3 production at t = 100 s on microdomain Ca2+ (A) and IP3 (B) concentrations, with the separate-store model. Note that the [Ca]md peak is off-scale.
The following predictions also underscore the deterministic roles of IP3, IP3R, and RyR: in both models, a twofold increase in IP3 production is sufficient to generate [Ca]cyt oscillations in the absence of K+ channel inhibition (results not shown). In contrast, isolated 90% inhibition of K+ channels (i.e., without the 100% increase in IP3 production) at t = 100 s does not induce oscillations, because the resulting membrane depolarization does not raise [Ca]md sufficiently to trigger CICR in the microdomains. In addition, assuming that ANG II raises IP3 production by 100% and inhibits K+ channels by 90%, predicted oscillations with the separate-store model vanish if νIP3R, the Ca2+ conductivity of IP3R (Eq. 7), is decreased from its baseline level of 10 s−1 to below 9 s−1. Oscillations also vanish if νRyR, the Ca2+ conductivity of RyR (Eq. 3), is decreased from 12 to <10 s−1.
Role of Ca2+ Influx and SERCA Uptake in ANG II-Mediated Oscillations
In this section and the one that follows, we focus on the separate-store model, which predicts [Ca]cyt oscillations more readily than the common-store model. The qualitative effects of the parameters examined below on oscillations are similar for both models.
The rates of Ca2+ uptake into the cell and SR also play key roles in the genesis of Ca2+ oscillations. If the overall conductance of SOC to both Na+ and Ca2+ is lowered by 15% or more, simulations suggest that the presumed effects of ANG II (a 2-fold increase in IP3 production and 90% K+ channel inhibition) do not elicit [Ca]cyt oscillations. Similarly, if the background Ca2+ conductance (GCa,b, see Eq. A1) is reduced by 25% or more, oscillations are eliminated. This is because [Ca]md rises too slowly after the first CICR event to reach the threshold needed to initiate sequential CICR. Thus, along with RyR and IP3R leak (see above), Ca2+ influx into the cell must contribute to the upward drift of [Ca]md toward the CICR threshold.
SERCA uptake of Ca2+ from microdomains to stores also governs the rate and extent of rise of [Ca]md after the first CICR event. A 10% increase in the maximum SERCA current abolishes [Ca]cyt oscillations, because the rate of Ca2+ uptake from the microdomains into the SR is too large for [Ca]md to rise to the CICR threshold. Likewise, a 10% increase in the rate of Ca2+ export from the cell (10% increase in ICaP,max, Eq. A33) prevents a sufficient rise in [Ca]md and abolishes oscillations.
Main Determinants of Oscillation Frequency and Amplitude
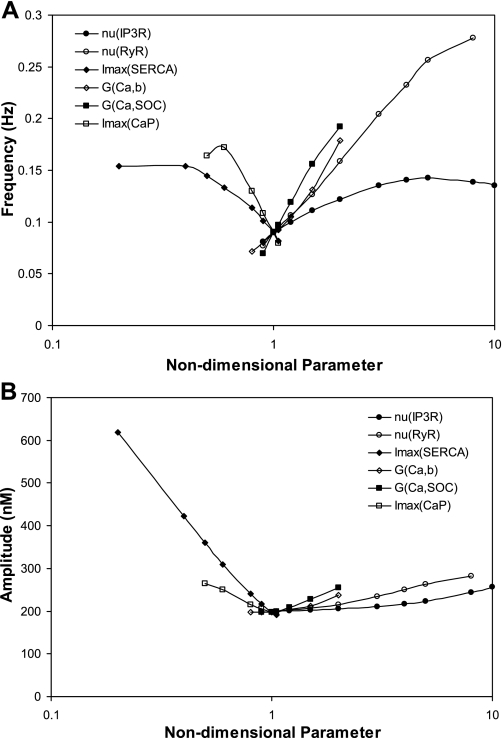
We next investigated the effects of changes in IP3R and RyR conductivity on the frequency and amplitude of oscillations elicited by a twofold increase in IP3 production and 90% K+ channel inhibition, using the separate-store model. As illustrated in Fig. 11, oscillations are maintained over a large range of νIP3R values (i.e., >1 order of magnitude), whereas νRyR, GCa,b, GCaSOC,max, ISERCA,max, and ICaP,max must be confined to narrower ranges. The model predicts that νRyR has the largest effects on frequency (Fig. 11A), meaning that the Ca2+ conductivity of RyR predominantly controls the interval between sequential CICR events. Conversely, the amplitude of oscillations depends primarily on the maximum SERCA current (Fig. 11B), that is, the rate at which Ca2+ is pumped back into the SR.
Fig. 11.
Effects of parameter variations on the frequency (A) and amplitude (B) of oscillations induced by 90% K+ channel inhibition and 100% increase in IP3 production. Parameters are given relative to their baseline value. Results are obtained for the separate-store configuration. Oscillations persist when Ca2+ conductivity of IP3R (νIP3R) equals up to 18 times its baseline value.
Our results also suggest that oscillation frequency and amplitude generally increase with increasing rates of Ca2+ entry into the microdomains and cytosol (i.e., with increasing νIP3R, νRyR, GCa,b, or GCaSOC,max) and decrease with increasing rates of Ca2+ uptake into the SR or export out of the cell (i.e., with increasing ISERCA,max or ICaP,max).
Comparison with Experimental Data
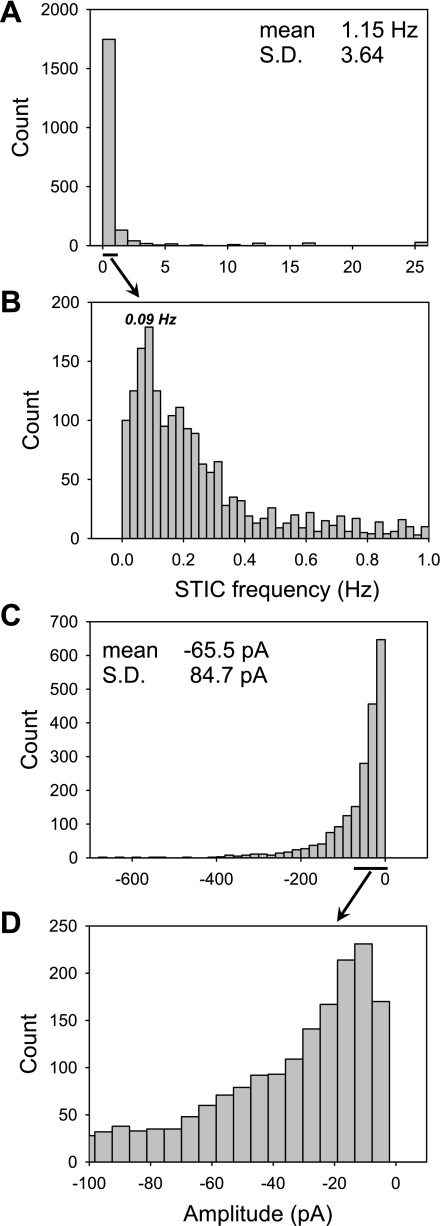
The frequency of oscillations predicted in the baseline case with the separate-store model is 0.09 Hz (Fig. 7), in good agreement with the dominant frequency measured in DVR pericytes exposed to ANG II during voltage clamp (52). Although the average frequency reported in that study was 1.15 ± 3.3 Hz (mean ± SD), the majority of values were near 0.09 Hz. These data are reproduced in Fig. 12A, along with an expanded histogram (Fig. 12B) to show that the average frequency was skewed by a few, very high values. Frequencies on the order of 0.1 Hz have also been measured in other vascular smooth muscle cells stimulated by ANG II (2, 19). In contrast, the predicted frequency with the common-store model (when K+ channel inhibition is low enough that oscillations do occur) ranges from 0.03 Hz (if inhibK = 75%) to 0.04 Hz (if inhibK = 0%).
Fig. 12.
A and B: frequency histograms of 2,062 spontaneous transient inward currents (STICs) recorded in 73 cells exposed to 10 nM ANG II (52). Most values are well below 1 Hz. The reason that the mean is 1.15 Hz is that a few frequencies are as high as 25, so that SD is very large and the mean is skewed away from the predominant frequency, near 0.09 Hz. C and D: amplitude histograms of the same data from Ref. 52. The predominant amplitude was near −10 pA, but the mean is much larger because of rare cells that exhibited large currents.
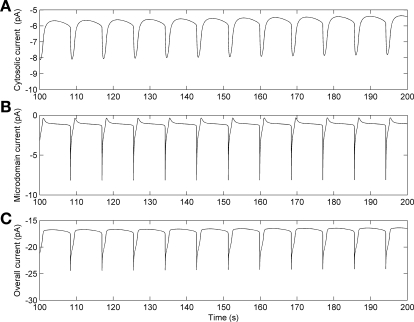
Model predictions of membrane current in cells exposed to ANG II during voltage clamp were also compared with measurements in pericytes (52). With the separate-store model, the predicted frequency of the membrane current is 0.12 Hz (Fig. 13), which is close to the most common value of 0.09 Hz illustrated in the expanded frequency histogram (Fig. 12, A and B). The predicted amplitude of the spontaneous transient inward current (STIC), on the order of −10 pA, is substantially lower than the mean value reported in pericytes (52). Again, expansion of the associated histogram reveals that the most common STIC amplitude measured in the pericytes was, in fact, close to the predictions of this model (Fig. 12, C and D). In contrast, the common-store model did not yield any oscillations during voltage clamp, a prediction that is insensitive to the degree of K+ channel inhibition.
Fig. 13.
Predicted membrane current during voltage clamp at −80 mV and exposure to angiotensin II (ANG II), with the separate-store model. We assume that exposure to ANG II results in 90% K+ channel inhibition and 100% increase in IP3 production. A: current above cytosol. B: current above microdomains. C: overall current, calculated as the sum of the currents crossing the cytosol and the microdomains, and the leak current (taken as −8 pA, assuming a 10-GΩ seal).
We also simulated the effects of 100 nM ouabain on ANG II-stimulated pericytes. The inhibition of ouabain-sensitive Na+-K+-ATPase isoforms, as well as the effects on IP3 production and on IP3R conductance, were modeled as in our previous study (13). The separate-store model predicts that 100 nM ouabain raises the oscillation frequency slightly, from 0.09 to 0.13 Hz, and has a <10% effect on amplitude. Experimentally, the effects of ouabain on ANG II-associated oscillations were similarly negligible (52). The common-store model predicts that ouabain abolishes oscillations. Experimentally, nanomolar ouabain did not abolish oscillations (unpublished data).
DISCUSSION
Growing evidence favors the notion that the architecture of ER/SR stores is complex and varies with cell type. Studies of Ca2+ release in mesenteric myocytes (6) and astrocytes (18) favor the existence of subplasmalemmal microdomains that are populated by ouabain-sensitive Na+-K+-ATPase, NCX, and SOC to facilitate localized signaling and routes for refilling of ER/SR stores (7). Controversy also surrounds the possibility that the spatial locations of RyR and IP3R on the SR stores are variable. Blaustein and colleagues (6) showed that cyclopiazonic acid and serotonin release Ca2+ from a RyR-insensitive store in mesenteric myocytes. Similar observations in astrocytes also favor independence of stores occupied by RyR and IP3R Ca2+ release channels (17). More complex configurations may also exist, in which a common store that expresses both IP3R and RyR resides alongside a store dominated by IP3R (3) or RyR (14). Regional variation along the microcirculation may occur. Studies in pulmonary arterial myocytes favor coincidence of IP3R and RyR stores in resistance but not conduit vessels (46).
Investigations into the nature of the cross talk between IP3R and RyR have yielded similarly varied results. In particular, controversy surrounds the ability of agonist-induced Ca2+ release via IP3R to stimulate adjacent CICR via RyR or IP3R as a mechanism to propagate intracellular Ca2+ waves or generate oscillations (27, 50, 53). Together, these observations lead to the conclusion that the varied complexity of ER/SR architecture, transporter expression, and interactions tailors cellular responses to various inputs such as mechanical stimulation, neural activity, or ligand binding to G protein-coupled receptors (5).
To gain insight into the complex relationships between cellular responses, we expanded a previously formulated model (12, 13) to simulate ANG II stimulation. Apart from inclusion of explicit equations to account for Cl− conductance, a new feature that yields possible insight into the genesis of oscillations concerns putative interactions between RyR and IP3R and separation of the stores on which they reside. We simulated the effects of ANG II by raising the maximum rate of IP3 production (νip3 in Eq. 8) by 100% and assuming 90% blockade of all K+ channels. Those inputs are based on experimental measurements obtained in DVR pericytes and other cells. ANG II has been found to inhibit several types of K+ channels in pericytes (9, 34) and other cells: KATP (20), KCa (30), Kir (38), and Kv (21). With respect to IP3 generation, ANG II stimulated IP3 production in cultured rat aortic cells about twofold (see Fig. 1 in Ref. 1).
In recent studies we showed that ANG II stimulation of DVR pericytes leads to oscillations of [Ca]cyt and synchronous variations of membrane potential (35) or Cl− currents in voltage-clamped pericytes (52). Those oscillations occurred in only about half of the pericytes; the changes in the remaining half were characterized by monophasic elevations of [Ca]cyt and Cl− conductance. Our model points to a possible role for the spatial arrangement of ER/SR stores as a determinant of oscillations; we compared two configurations, a common-store model (Fig. 1A) and a separate-store model (Fig. 1B) in which RyR and IP3R release Ca2+ from different stores. The model predicts that oscillations are more prone to occur in the separate-store case because of cross talk between stores via their respective IP3R or RyR: as one type of store is depleted the other is replenished, thereby sustaining Ca2+ release into the microdomains as a cyclic phenomenon punctuated by periodic CICR events (Figs. 7–10).
More specifically, our results suggest that two key determinants of [Ca]cyt oscillations are 1) release of Ca2+ from stores and 2) entry of Ca2+ from the extracellular space, both of which raise [Ca] in the vicinity of RyR. If the rise exceeds the threshold for CICR by RyR, a burst of CICR occurs that is followed by SERCA-mediated reuptake into stores and export across the plasmalemma by Na+/Ca2+ exchange and Ca2+-ATPase activity. If those events have reduced intracellular Ca2+ near RyR to a low level, the release phase begins again as a trickle of leak current from the internal stores. Either stabilization of intracellular Ca2+ is achieved (no oscillations) or it reaches CICR levels to generate another burst of RyR-mediated Ca2+ release (oscillations). The model readily predicts oscillations when IP3R and RyR channels are on separate SR stores that face a common cytoplasmic domain because Ca2+ released by RyR stores during CICR can “overfill” the adjacent IP3 stores to favor a high subsequent leak rate that subsequently triggers the RyR-mediated CICR of the next oscillation. As might be expected from that scenario, the magnitude of IP3 generation that favors the leak from IP3R stores is another key determinant of oscillations.
Other predictions of the model also favor separation of RyR and IP3R stores. In medullary pericytes, KCl elevation causes a sustained increase in [Ca]cyt (56), as expected from the separate-store model, whereas a transient increase, without a stable plateau, is predicted by the common-store model (Fig. 3). As described above, the calculated frequency of oscillations is closer to experimental values in pericytes (52) with the separate-store model. Abolition of oscillations by ouabain, predicted only for the common-store model, does not occur experimentally. The predicted mechanisms underlying oscillations are also consistent with a number of prior experimental findings: blockade of Ca2+ influx with SKF-96365 (a nonselective cation channel inhibitor expected to interfere with SOC activity) and exposure to ryanodine or to caffeine inhibited oscillations (52).
This study also underscores two key aspects of SERCA pump function. One is the importance of SERCA saturation: if SERCA currents were able to increase in parallel with RyR and IP3R currents, they would prevent a sufficient rise of [Ca]md to elicit repetitive CICR. The other is SERCA pump reversal. Backflux through SERCA pumps has been described by several investigators (23, 28, 40, 44). Our model predicts that backflux through cytosolic SERCA associated with the IP3R-SR stores occurs after KCl elevation, allowing for sustained elevation of [Ca]cyt.
Many permutations of configurations, IP3R and RyR isoform variations, spatial distributions, and PM-ER/SR-cytosolic interactions, are conceptually possible and, moreover, likely to exist in living cells (3, 5, 14, 17, 18, 27, 45, 46, 50). As such, we recognize that the predictions of this model represent a limited exploration, guided largely by measurements obtained from DVR pericytes. This model has been successful in simulating microdomain-dependent ouabain interactions (13) and now yields realistic simulations of pericyte [Ca]cyt responses to agonist (ANG II) stimulation (36, 52, 56) and KCl depolarization (36, 56) when IP3R and RyR stores are separated. Other authors have investigated the minimal model requirements for generation of oscillations and concluded that RyR participation is not a requisite feature (4, 16). Moreover, because of the activation and inhibition achieved through binding of Ca2+ ions to IP3R, oscillations of IP3 concentration may not be needed (16, 49).
This model has not been constructed to explore the minimal configurations needed to generate oscillations but instead was devised to account for a current state of knowledge that represents a particular cell type. It simulates the expressions of classes of anion and cation channels, Na+-K+-ATPase, Ca2+-ATPase, RyR, and IP3R at interfaces (PM-microdomain-ER/SR, PM-cytosol-ER/SR) as well as realistic compartmental volumes and Ca2+ buffering. As such, numerical integration rather than “closed” solution of the governing differential equations is required. It is satisfying that oscillations, observed in vivo, readily emerge as a prediction of the effort. One benefit of the complexity of this model is that modes of operation can be explored to define ranges over which observed behaviors, such as oscillations, are predicted. As shown in Fig. 11, the existence or absence of oscillations is a natural consequence of modifying the “set points” of key parameters. Similar variations in biological systems seem likely to exist and may well explain the varied presence of oscillations in ANG II-stimulated pericytes (52).
GRANTS
This work was supported by National Institutes of Health Grants DK-53775 (A. Edwards), DK-42495, HL-78870, and DK-67621 (T. L. Pallone).
APPENDIX
Ionic Currents
The convention adopted in this study is that exit of positive charge from the cell is a positive current. Conversely, exit of negative charge is a negative current. Unless otherwise noted, current equations are taken from the model developed by Yang et al. (51) for vascular smooth muscle cells.
Background currents for K+, Na+, Cl−, and Ca2+.
The background current of ion i in compartment j (j = cyt or md) is calculated as:
 |
(A1) |
Inward rectifier potassium current, IK,ir.
The current flowing across Kir channels is expressed as (26):
 |
(A2) |
 |
(A3) |
 |
(A4) |
 |
(A5) |
where the parameters were obtained by fitting DVR pericyte data (8). The expression for the Kir conductance has been revised to obtain better agreement with the data.
Delayed rectifier potassium current, IK,v.
The current flowing across Kv channels lying above compartment j is calculated as:
 |
(A6) |
 |
(A7) |
 |
(A8) |
 |
(A9) |
 |
(A10) |
 |
(A11) |
 |
(A12) |
where P1 and P2 denote the two exponential components of the channel activation process and τP1 and τP2 denote the respective time constants (in ms). The parameter P̄Kv, which is voltage dependent, represents the steady-state value of P1 and P2.
ATP-activated potassium current, IK,ATP.
The current flowing across KATP channels is modeled as (42):
 |
(A13) |
where PATP is the fraction of KATP channels available at a given ATP concentration; we assume that the intracellular ATP concentration remains fixed, so that the product GKATP,maxPATP is a constant.
Calcium-activated potassium current, IK,Ca.
The current flowing across Ca2+-activated K+ channels is calculated as:
 |
(A14) |
 |
(A15) |
 |
(A16) |
 |
(A17) |
 |
(A18) |
 |
(A19) |
where PF and PS denote the fast and slow components of the channel activation process, respectively, and τPF and τPS denote the respective time constants. The steady-state open probability of the channel is given by P̄KCa.
Na+-K+-ATPase pump current, INaK.
As described previously (12), our model posits that the α1-isoform of the Na+-K+-ATPase pump is expressed only in the PM above the bulk cytosol, whereas the α2-isoform is confined to the membrane region that is above the microdomains. The respective currents are determined as (26):
 |
(A20) |
 |
(A21) |
 |
(A22) |
 |
(A23) |
Na+/Ca2+ exchanger current, INaCa.
We assume that all Na+/Ca2+ exchangers (NCX) are preferentially localized in the microdomains (6, 31). The microdomain NCX current is given by (22):
 |
(A24) |
 |
(A25) |
 |
(A26) |
 |
(A27) |
 |
Voltage-activated sodium current, IVONa.
The current flowing through voltage-activated Na+ channels is calculated based on DVR pericyte data (54):
 |
(A28) |
 |
(A29) |
 |
(A30) |
 |
(A31) |
 |
(A32) |
where mVONa and hVONa are the activation and inactivation components (with steady-state values m̄ and h̄, respectively) and τm and τh are the associated time constants. The current is taken to be proportional to the first power of hVONa instead of the third power (12), so as to obtain better agreement with the experimental data (54).
Calcium pump current, ICa,P.
The current through plasmalemmal Ca2+ pumps is expressed as:
 |
(A33) |
Voltage-dependent Ca2+ current, ICa,L.
The current flowing across voltage-activated Ca2+ channels is calculated as:
 |
(A34) |
 |
(A35) |
 |
(A36) |
 |
(A37) |
 |
(A38) |
 |
(A39) |
 |
(A40) |
 |
(A41) |
where dL is the activation variable, fL and fF are inactivation variables, and τd and τf are the time constants for activation and inactivation (in ms), respectively; d̄L and f̄F denote the steady-state values of dL and fF.
Calcium Buffers
We account for the chelation of Ca2+ by calmodulin and other Ca2+-binding proteins in the cytosol and the microdomains and by calsequestrin in the SR. Let [CM] denote the total concentration of calmodulin sites available for Ca2+ binding in compartment j (j = cyt or md), and [CM·Ca]j the concentration of calcium-bound calmodulin sites in that compartment. Similarly, let [Bf]
 denote the total concentration of other Ca2+-binding proteins in compartment j and [Bf·Ca]j the concentration of the calcium-bound sites of these other buffering elements. Assuming that calcium buffering can be described as first-order dynamic processes (51), we have:
 |
(A42) |
 |
(A43) |
Finally, the buffering of calcium by calsequestrin in the SR is modeled as:
 |
(A44) |
where [Calseq] denotes the total concentration of calsequestrin sites available for Ca2+ binding in the SR and [Calseq·Ca]SR the concentration of Ca2+-bound calsequestrin sites in that compartment. In the separate-store model, we distinguish between the Ca2+ binding sites in the SR stores expressing only IP3R and those in the SR stores expressing only RyR; [Ca]SR in Eq. A44 is replaced accordingly by [Ca]IP3R-SR or [Ca]RyR-SR.
Electrodiffusive Flux from Microdomain to Cytosol
The electrodiffusive flux of ion i (valence zi) is defined such that Ji,diff yields a positive current into the cytosol when cations flow down their electrochemical gradient from microdomains to cytosol (12):
 |
(A45) |
 |
(A46) |
 |
(A47) |
where A is the cross-sectional area at the interface between the microdomains and the cytosol (taken as 0.776 μm2), Di is the diffusivity of ion i, L is the distance from the center of the microdomains to that of the cytosol (taken as 0.5 μm), and h is a hindrance factor, which lumps together steric and charge-related effects (taken as 1 × 10⁻³). As described previously (12), the whole cell diffusivity of calcium is taken as 0.3 × 10⁻⁵ cm2/s, and the sodium-to-calcium and potassium-to-calcium diffusivity ratios are assumed to be equal to 1.33/0.79 and 1.96/0.79, i.e., the ratios of the diffusivities in dilute solution.
Time Variations in Internal Concentrations
The concentrations of K+, Na+, Cl−, and Ca2+ as a function of time are determined by integrating the following differential equations:
 |
(A48) |
 |
(A49) |
 |
(A50) |
 |
(A51) |
 |
(A52) |
 |
(A53) |
 |
(A54) |
 |
(A55) |
In the common-store model:
 |
(A56) |
In the separate-store model:
 |
(A57) |
 |
(A58) |
where volcyt (0.5 pl), volcyt,Ca (0.35 pl), and volmd (0.003 pl) denote the total volume of the cytosol, the volume of the cytosol that is available to Ca2+, and the volume of the microdomains, respectively.
Time Variations in Membrane Potential
The net sum of the currents flowing out of the bulk cytosol is given by:
 |
(A59) |
The net sum of the currents flowing out of the microdomains is given by:
 |
(A60) |
The time dependence of V and V
and V is given by:
 |
(A61) |
 |
(A62) |
where Cm is the membrane capacitance (1.21 × 10⁻⁵ μF). Neglected in Eqs. A61 and A62 is the movement of ions other than Ca2+ across the SR. Given the lack of experimental data, we cannot currently account for all the pathways (pumps, channels, and transporters) by which charge flows into and out of the SR.
The costs of publication of this article were defrayed in part by the payment of page charges. The article must therefore be hereby marked “advertisement” in accordance with 18 U.S.C. Section 1734 solely to indicate this fact.
REFERENCES
- 1.Alexander R, Brock T, Gimbrone MJ, Rittenhouse S. Angiotensin increases inositol trisphosphate and calcium in vascular smooth muscle. Hypertension 7: 447–451, 1985. [PubMed] [Google Scholar]
- 2.Asada Y, Yamazawa T, Hirose K, Takasaka T, Iino M. Dynamic Ca2+ signalling in rat arterial smooth muscle cells under the control of local renin-angiotensin system. J Physiol 521: 497–505, 1999. [DOI] [PMC free article] [PubMed] [Google Scholar]
- 3.Barry VA, Cheek TR. A caffeine- and ryanodine-sensitive intracellular Ca2+ store can act as a Ca2+ source and a Ca2+ sink in PC12 cells. Biochem J 300: 589–597, 1994. [DOI] [PMC free article] [PubMed] [Google Scholar]
- 4.Berridge MJ Inositol trisphosphate and calcium oscillations. Biochem Soc Symp 74: 1–7, 2007. [DOI] [PubMed] [Google Scholar]
- 5.Berridge MJ, Lipp P, Bootman M. The versatility and universality of calcium signalling. Nat Rev Mol Cell Biol 1: 11–21, 2000. [DOI] [PubMed] [Google Scholar]
- 6.Blaustein MP, Golovina V, Song H, Choate J, Lencesova L, Robinson S, Wier W. Organization of Ca2+ stores in vascular smooth muscle: functional implications. Novartis Found Symp 246: 125–141, 2002. [PubMed] [Google Scholar]
- 7.Blaustein MP, Zhang J, Chen L, Hamilton BP. How does salt retention raise blood pressure? Am J Physiol Regul Integr Comp Physiol 290: R514–R523, 2006. [DOI] [PubMed] [Google Scholar]
- 8.Cao C, Goo JH, Lee-Kwon W, Pallone TL. Vasa recta pericytes express a strong inward rectifier K+ conductance. Am J Physiol Regul Integr Comp Physiol 290: R1601–R1607, 2006. [DOI] [PubMed] [Google Scholar]
- 9.Cao C, Lee-Kwon W, Silldorff EP, Pallone TL. KATP channel conductance of descending vasa recta pericytes. Am J Physiol Renal Physiol 289: F1235–F1245, 2005. [DOI] [PubMed] [Google Scholar]
- 10.Clapham DE TRP channels as cellular sensors. Nature 426: 517–524, 2003. [DOI] [PubMed] [Google Scholar]
- 11.De Young G, Keiser J. A single-pool inositol 1,4,5-trisphosphate-receptor-based model for agonist-stimulated oscillations in Ca2+ concentrations. Proc Natl Acad Sci USA 89: 9895–9899, 1992. [DOI] [PMC free article] [PubMed] [Google Scholar]
- 12.Edwards A, Pallone TL. Modification of cytosolic calcium signaling by subplasmalemmal microdomains. Am J Physiol Renal Physiol 292: F1827–F1845, 2007. [DOI] [PubMed] [Google Scholar]
- 13.Edwards A, Pallone TL. Ouabain modulation of cellular calcium stores and signaling. Am J Physiol Renal Physiol 293: F1518–F1532, 2007. [DOI] [PubMed] [Google Scholar]
- 14.Flynn ER, Bradley KN, Muir TC, McCarron JG. Functionally separate intracellular Ca2+ stores in smooth muscle. J Biol Chem 276: 36411–36418, 2001. [DOI] [PubMed] [Google Scholar]
- 15.Furukawa K, Nakamura H. Characterization of the (Ca2+-Mg2+) ATPase purified by calmodulin-affinity chromatography from bovine aortic smooth muscle. J Biochem (Tokyo) 96: 1343–1350, 1984. [DOI] [PubMed] [Google Scholar]
- 16.Goldbetter A, Dupont G, Berridge MJ. Minimal model for signal-induced Ca2+ oscillations and for their frequency encoding through protein phosphorylation. Proc Natl Acad Sci USA 87: 1461–1465, 1990. [DOI] [PMC free article] [PubMed] [Google Scholar]
- 17.Golovina VA, Blaustein MP. Spatially and functionally distinct Ca2+ stores in sarcoplasmic and endoplasmic reticulum. Science 275: 1643–1648, 1997. [DOI] [PubMed] [Google Scholar]
- 18.Golovina VA, Blaustein MP. Unloading and refilling of two classes of spatially resolved endoplasmic reticulum Ca2+ stores in astrocytes. Glia 31: 15–28, 2000. [DOI] [PubMed] [Google Scholar]
- 19.Guibert C, Marthan R, Savineau JP. Angiotensin II-induced Ca2+-oscillations in vascular myocytes from the rat pulmonary artery. Am J Physiol Lung Cell Mol Physiol 270: L637–L642, 1996. [DOI] [PubMed] [Google Scholar]
- 20.Hayabuchi Y, Davies NW, Standen NB. Angiotensin II inhibits rat arterial KATP channels by inhibiting steady-state protein kinase A activity and activating protein kinase Ce. J Physiol 530: 193–205, 2001. [DOI] [PMC free article] [PubMed] [Google Scholar]
- 21.Hayabuchi Y, Standen NB, Davies NW. Angiotensin II inhibits and alters kinetics of voltage-gated K+ channels of rat arterial smooth muscle. Am J Physiol Heart Circ Physiol 281: H2480–H2489, 2001. [DOI] [PubMed] [Google Scholar]
- 22.Hund T, Rudy Y. Rate dependence and regulation of action potential and calcium transient in a canine cardiac ventricular cell model. Circulation 110: 3168–3174, 2004. [DOI] [PMC free article] [PubMed] [Google Scholar]
- 23.Inesi G, Zhang Z, Lewis D. Cooperative setting for long-range linkage of Ca2+ binding and ATP synthesis in the Ca2+ ATPase. Biophys J 83: 2327–2332, 2002. [DOI] [PMC free article] [PubMed] [Google Scholar]
- 24.Kuruma A, Hartzell HC. Bimodal control of a Ca2+-activated Cl− channel by different Ca2+ signals. J Gen Physiol 115: 59–80, 2000. [DOI] [PMC free article] [PubMed] [Google Scholar]
- 25.Lee CH, Kuo KH, Dai J, Leo JM, Seow CY, Breemen CV. Calyculin-A disrupts subplasmalemmal junction and recurring Ca2+ waves in vascular smooth muscle. Cell Calcium 37: 9–16, 2005. [DOI] [PubMed] [Google Scholar]
- 26.Luo C, Rudy Y. A dynamic model of the cardiac ventricular action potential. I. Simulations of ionic currents and concentration changes. Circ Res 74: 1071–1096, 1994. [DOI] [PubMed] [Google Scholar]
- 27.MacMillan D, Chalmers S, Muir TC, McCarron JG. IP3-mediated Ca2+ increases do not involve the ryanodine receptor, but ryanodine receptor antagonists reduce IP3-mediated Ca2+ increases in guinea-pig colonic smooth muscle cells. J Physiol 569: 533–544, 2005. [DOI] [PMC free article] [PubMed] [Google Scholar]
- 28.Makinose M, Hasselbach W. ATP synthesis by the reverse of the sarcoplasmic calcium pump. FEBS Lett 12: 271–272, 1971. [DOI] [PubMed] [Google Scholar]
- 29.Mani RS, Kay CM. Isolation and characterization of a novel molecular weight 11000 calcium-binding protein from smooth muscle. Biochemistry 29: 1398–1404, 1990. [DOI] [PubMed] [Google Scholar]
- 30.Minami K, Hirata Y, Tokumura A, Nakaya Y, Fukuzawa K. Protein kinase C-independent inhibition of the Ca2+-activated K+ channel by angiotensin II and endothelin-1. Biochem Pharmacol 49: 1051–1056, 1995. [DOI] [PubMed] [Google Scholar]
- 31.Moore EDW, Etter EF, Philipson KD, Carrington W, Fogarty KE, Lifshitz LM, Fay FS. Coupling of the Na+/Ca2+ exchanger, Na+/K+ pump and sarcoplasmic reticulum in smooth muscle. Nature 365: 657–660, 1993. [DOI] [PubMed] [Google Scholar]
- 32.Novotny JA, Jakobsson E. Computational studies of ion-water flux coupling in the airway epithelium. I. Construction of model. Am J Physiol Cell Physiol 270: C1751–C1763, 1996. [DOI] [PubMed] [Google Scholar]
- 33.Ohya Y, Sperelakis N. Involvement of a GTP-binding protein in stimulating action of angiotensin II on calcium channels in vascular smooth muscle cells. Circ Res 68: 763–771, 1991. [DOI] [PubMed] [Google Scholar]
- 34.Pallone TL, Cao C, Zhang Z. Inhibition of K+ conductance in descending vasa recta pericytes by ANG II. Am J Physiol Renal Physiol 287: F1213–F1222, 2004. [DOI] [PubMed] [Google Scholar]
- 35.Pallone TL, Huang JMC. Control of descending vasa recta pericyte membrane potential by angiotensin II. Am J Physiol Renal Physiol 282: F1064–F1074, 2002. [DOI] [PubMed] [Google Scholar]
- 36.Pallone TL, Zhang Z, Rhinehart K. Physiology of the renal medullary microcirculation. Am J Physiol Renal Physiol 284: F253–F266, 2003. [DOI] [PubMed] [Google Scholar]
- 37.Pande J, Grover AK. Plasma membrane calcium pumps in smooth muscle: from fictional molecules to novel inhibitors. Can J Physiol Pharmacol 83: 743–754, 2005. [DOI] [PubMed] [Google Scholar]
- 38.Park WS, Kim N, Youm JB, Warda M, Ko JH, Kim SJ, Earm YE, Han J. Angiotensin II inhibits inward rectifier K+ channels in rabbit coronary arterial smooth muscle cells through protein kinase Cα. Biochem Biophys Res Commun 341: 728–735, 2006. [DOI] [PubMed] [Google Scholar]
- 39.Seki T, Yokoshiki H, Sunugawa M, Nakamura M, Sperelakis N. Angiotensin II stimulation of Ca2+-channel current in vascular smooth muscle cells is inhibited by lavendustin-A and LY-294002. Pflügers Arch 437: 317–323, 1999. [DOI] [PubMed] [Google Scholar]
- 40.Shannon TR, Ginsburg KS, Bers DM. Reverse mode of the sarcoplasmic reticulum calcium pump and load-dependent cytosolic calcium decline in voltage-clamped cardiac ventricular myocytes. Biophys J 78: 322–333, 2000. [DOI] [PMC free article] [PubMed] [Google Scholar]
- 41.Shannon TR, Wang F, Puglisi J, Weber C, Bers DM. A mathematical treatment of integrated Ca dynamics within the ventricular myocyte. Biophys J 87: 3351–3371, 2004. [DOI] [PMC free article] [PubMed] [Google Scholar]
- 42.Shaw RM, Rudy Y. Electrophysiologic effects of acute myocardial ischemia: a theoretical study of altered cell excitability and action potential duration. Cardiovasc Res 35: 256–272, 1997. [DOI] [PubMed] [Google Scholar]
- 43.Smith J, Smith L. Na+/K+/Cl− cotransport in cultured vascular smooth muscle cells: stimulation by angiotensin II and calcium ionophores, inhibition by cyclic AMP and calmodulin antagonists. J Membr Biol 99: 51–63, 1987. [DOI] [PubMed] [Google Scholar]
- 44.Takenaka H, Adler P, Katz A. Calcium fluxes across the membrane of sarcoplasmic reticulum vesicles. J Biol Chem 257: 12649–12656, 1982. [PubMed] [Google Scholar]
- 45.Thayer SA, Perney TM, Miller RJ. Regulation of calcium homeostasis in sensory neurons by bradykinin. J Neurosci 8: 4089–4097, 1988. [DOI] [PMC free article] [PubMed] [Google Scholar]
- 46.Urena J, Smani T, Lopez-Barneo J. Differential functional properties of Ca2+ stores in pulmonary arterial conduit and resistance myocytes. Cell Calcium 36: 525–534, 2004. [DOI] [PubMed] [Google Scholar]
- 47.Ventura A, Sneyd J. Calcium oscillations and waves generated by multiple release mechanisms in pancreatic acinar cells. Bull Math Biol 68: 2205–2231, 2006. [DOI] [PubMed] [Google Scholar]
- 48.Volpe P, Martini A, Furlan S, Meldolesi J. Calsequestrin is a component of smooth muscles: the skeletal- and cardiac-muscle isoforms are both present, although in highly variable amounts and ratios. Biochem J 301: 465–469, 1994. [DOI] [PMC free article] [PubMed] [Google Scholar]
- 49.Wakui M, Potter BVL, Petersen OH. Pulsatile intracellular calcium release does not depend on fluctuations in inositol trisphosphate concentration. Nature 339: 317–320, 1989. [DOI] [PubMed] [Google Scholar]
- 50.Wray S, Burdyga T, Noble K. Calcium signalling in smooth muscle. Cell Calcium 38: 397–407, 2005. [DOI] [PubMed] [Google Scholar]
- 51.Yang J, Clark JW Jr, Bryan RM, Robertson C. The myogenic response in isolated rat cerebrovascular arteries: smooth muscle cell model. Med Eng Phys 25: 691–709, 2003. [DOI] [PubMed] [Google Scholar]
- 52.Zhang Q, Cao C, Zhang Z, Wier WG, Edwards A, Pallone TL. Membrane current oscillations in descending vasa recta pericytes. Am J Physiol Renal Physiol 294: F656–F666, 2008. [DOI] [PMC free article] [PubMed] [Google Scholar]
- 53.Zhang WM, Yip KP, Lin MJ, Shimoda LA, Li WH, Sham JSK. ET-1 activates Ca2+ sparks in PASMC: local Ca2+ signaling between inositol trisphosphate and ryanodine receptors. Am J Physiol Lung Cell Mol Physiol 285: L680–L690, 2003. [DOI] [PubMed] [Google Scholar]
- 54.Zhang Z, Cao C, Lee-Kwon W, Pallone TL. Descending vasa recta pericytes express voltage operated Na+ conductance in the rat. J Physiol 567: 445–457, 2005. [DOI] [PMC free article] [PubMed] [Google Scholar]
- 55.Zhang Z, Huang JMC, Turner MR, Rhinehart KL, Pallone TL. Role of chloride in constriction of descending vasa recta by angiotensin II. Am J Physiol Regul Integr Comp Physiol 280: R1878–R1886, 2001. [DOI] [PubMed] [Google Scholar]
- 56.Zhang Z, Rhinehart K, Pallone TL. Membrane potential controls calcium entry into descending vasa recta pericytes. Am J Physiol Regul Integr Comp Physiol 283: R949–R957, 2002. [DOI] [PubMed] [Google Scholar]


