

Abstract
Magnetic resonance imaging (MRI) was used to spatially resolve the structure, water diffusion, and copper transport of a phototrophic biofilm and its fate. MRI was able to resolve considerable structural heterogeneity, ranging from classical laminations ∼500 μm thick to structures with no apparent ordering. Pulsed-field gradient (PFG) analysis spatially resolved water diffusion coefficients which exhibited relatively little or no attenuation (diffusion coefficients ranged from 1.7 × 10⁻⁹ m2 s−1 to 2.2 × 10⁻⁹ m2 s−1). The biofilm was then reacted with a 10-mg liter−1 Cu2+ solution, and transverse-parameter maps were used to spatially and temporally map copper immobilization within the biofilm. Significantly, a calibration protocol similar to that used in biomedical research successfully quantified copper concentrations throughout the biofilm. Variations in Cu concentrations were controlled by the biofilm structure. Copper immobilization was most rapid (∼5 mg Cu liter−1 h−1) over the first 20 to 30 h and then much slower for the remaining 60 h of the experiment. The transport of metal within the biofilm is controlled by both diffusion and immobilization. This was explored using a Bartlett and Gardner model which examined both diffusion and adsorption through a hypothetical film exhibiting properties similar to those of the phototrophic biofilm. Higher adsorption constants (K) resulted in longer lag times until the onset of immobilization at depth but higher actual adsorption rates. MRI and reaction transport models are versatile tools which can significantly improve our understanding of heavy metal immobilization in naturally occurring biofilms.
The biofilm is an exceptionally common mode of life for bacteria in natural, clinical, and engineered environments. These microbial “cities” range in thickness from a few cells to several centimeters and display a complex three-dimensional architecture which exhibits both structural and compositional heterogeneity (10, 22, 23).
Mass transfer rates within biofilms are controlled by diffusive and advective processes. Where interconnected pore spaces and channels exist within the biofilm, advection can play an important role in contaminant or nutrient mass transfer. In the cell clusters between channels or in biofilms where channels are absent, molecular diffusion becomes the dominant mass transfer mechanism (4, 21). Although the key transport medium within a biofilm is water, the molecular diffusion of a molecule through a biofilm is commonly slower than it is in free water due to the lower permeability of the biofilm and the tortuous nature of any pathways. Consequently, the diffusion of nutrients (or indeed contaminants) can be the rate-limiting step in biofilm performance and can lead to steep chemical and redox gradients through the community (4, 6, 9, 17, 23). For that reason, direct measurements of biofilm diffusion properties are highly desirable when modeling biofilm function (3, 40). Biofilms, however, are complex structures which exhibit a high degree of structural and compositional heterogeneity. Consequently, mass transfer rates can also display a high degree of heterogeneity. Protocols which can map these heterogeneities throughout the biofilm aid the effective modeling of biofilm operation (3, 40).
Quantifying the transport and determining the fate of heavy metals in aqueous systems are integral to understanding, predicting, and preventing heavy metal contamination in the natural environment. Bacteria have tremendous potential to influence the transport and fate of metals through the complexation of metals to the bacterial surface and via metabolic processes (18, 19, 32). The ability of bacteria to absorb large quantities of metal ions to their surfaces results from the abundance of ionizable carboxyl and phosphoryl groups within the cell wall, which behave as metal-reactive ligands (19, 28, 42). Furthermore, bacterial metabolism can dramatically impact metal mobility, either via direct metabolic oxidation or reduction of the metal or via mobilization or immobilization of sister phases, which results in heavy metal release or capture (18, 26). The ubiquitous nature of bacteria in almost any natural environment where there is sufficient water for their survival ensures that they are key players in the cycling of heavy metals.
In biofilms, mass transport must play a key role in controlling the rate of metal sequestration. That is, metal ions must diffuse (and advect) through the matrix of cells and extracellular polymers; the rate at which this occurs mediates the rate at which the biofilm immobilizes that metal. This contrasts with planktonic systems, which are not subjected to the diffusion limitation experienced by biofilms and thus may exhibit more-rapid reaction kinetics. Thus, quantifying both the mass transport and the immobilization of a metal is essential to our understanding of biofilm metal sequestration. To date, metal uptake in biofilms has been quantified from bulk measurements, commonly of the total metal retained within the biofilm (see, e.g., references 15 and 27). Although informative, these studies do not reveal the spatially resolved and cross-correlatable information on metal immobilization, diffusivity, and biofilm structure required to fully understand the mass transfer and fate of metal in biofilms. Significantly, magnetic resonance imaging (MRI) has the potential to do this.
MRI has been widely applied to the study of both porous media and mass transport phenomena. The ability to study structure, diffusion, flow, molecular dynamics, and chemical reactions noninvasively has been widely utilized in fields such as medicine (38), separation science, food science, physical science (7), rheology (24), and chemical engineering (14). Its particular suitability to the study of porous media has led to its application to biofilm research. For example, pulsed-field gradient (PFG)-nuclear magnetic resonance (NMR) has been used to determine water diffusion rates in biofilms (20, 39), while the molecule-specific sensitivity of NMR has enabled researchers to map depth-dependent metabolite profiles (25). Heavy metal precipitation has also been imaged temporally and spatially in bioreactors containing polyurethane-immobilized biofilms (30, 31). MRI is a particularly suitable technique for biofilm research, as it is a noninvasive approach which allows analysis in vivo, in situ, and in three dimensions.
The key aim of this study was to investigate the ability of MRI to characterize the transport and fate of heavy metal in a natural biofilm, thus demonstrating its potential for probing biofilm-metal interactions in natural systems. This initial study utilized a 1-cm-thick phototrophic biofilm from an Icelandic hot spring as a “model” biofilm. This biofilm was considered ideal for the current study because it is structurally complex, enabling us to investigate the ability of MRI to map and correlate the diffusivity in, heavy metal uptake in, and structure of a complex biofilm system. Copper was chosen as an ideal metal for study because it is a common heavy metal pollutant and because it is sufficiently paramagnetic to be readily detectable by 1H-MRI.
In this study, we utilize MRI to shed light on biofilm heavy metal immobilization by quantifying the structure, diffusivity, and copper transport of a biofilm and its fate in three dimensions and in real time. This is the first study combining biofilm structure, diffusivity, and metal immobilization. This study also for the first time applies a calibration protocol which directly quantifies metal concentrations inside a biofilm.
MATERIALS AND METHODS
Biofilm.
The natural biofilm used in this study was a 1-cm-thick phototrophic biofilm, collected in September 2005 from the southwestern discharge channel of the Strokkur Geyser, Geysir hot spring system, southern Iceland (latitude +64o18′40″, longitude −20o18′10″).
Flow system.
The biofilm was positioned in a 1.5-cm-diameter plastic reaction cell by fixing it into a bed of agar (Fig. 1). The biofilm was positioned in the agar so that the lower portion was surrounded by agar, reflecting the fact that in the natural environment the lower portion is laterally continuous, connecting to other biofilms; only the upper portion stands free in the spring water. The reaction cell containing the biofilm was then positioned in the center of the magnet. The reaction cell remained in position inside the magnet for the 60-h duration of the experiment. The reaction cell containing the biofilm was first connected via silicon tubing to an 18 MΩ water supply and slowly washed with ultrapure water. The system was then connected to a 4-liter reservoir of a 10-mg liter−1 Cu2+ solution prepared using CuSO4·5H2O. A peristaltic pump was used to pump the solution through the reactor tube at a rate of 0.7 ml/min. The Cu solution eluent was pumped back into the reservoir.
FIG. 1.

(A) Reaction cell with the biofilm held in place by agar. MRI measurements were of 14 contiguous slices, perpendicular to flow. (B) For each slice, 64 T2-weighted images are acquired with increasing echo time. (C) For each pixel, the decay of the MRI signal can be fitted to an exponential function, giving a T2 value. Taking the T2 values for each pixel yields a T2 parameter map. The approximate scale (height) of a biofilm is 1 cm. Relative dimensions are not exact.
MRI.
The basic principles of 1H-based MRI (the type of MRI used in this study) are as follows. The hydrogen nucleus possesses both a magnetic moment and spin-angular momentum, commonly referred to as a nuclear “spin.” There is a slight tendency for these nuclear spins to align with the direction of an applied magnetic field, B0, thus creating a net magnetization in the sample. Also, the nuclear spins precess about the axis of the applied magnetic field, B0, at a frequency of γB0, where γ is the magnetogyric ratio. The spins can be manipulated by the application of electromagnetic radiation that matches this precession frequency (i.e., radio frequency [RF]). Following excitation by this RF pulse, the spins return to equilibrium; this process is called relaxation. T2 relaxation, the transverse-relaxation time of hydrogen nuclei within water molecules, describes the process whereby spins lose phase coherence, and T1 (longitudinal) relaxation describes the process whereby the net magnetization returns to equilibrium. Imaging is achieved by application of linear magnetic field gradients across the sample, causing spins at different spatial positions to experience slightly different magnetic fields and hence to precess at different frequencies, thus labeling their spatial positions. This enables the T2 (or T1) relaxation at each position to be mapped. In simple terms, T2 relaxation is detected by the RF coil which surrounds the sample (in this study, it is the same coil as that which emits the original RF pulse). The resolution of the image is dependent on the diameter of this RF coil, with smaller coils resulting in higher-resolution images. Very small diameter coils (e.g., 4 mm) can achieve a resolution of a few 10s of micrometers.
The MRI experiments were performed on a Bruker Avance BioSpec system, using a 30-cm-bore, 7T superconducting magnet (Bruker BioSpec, Karlsruhe, Germany). A Bruker microimaging gradient insert (model BG-6) and 100-A gradient amplifiers provide strong linear magnetic field gradient pulses of up to 1,000 mT/m, thus allowing the system to adapt to perform microimaging experiments. A Bruker 35-mm-diameter birdcage RF volume resonator was used to excite and detect the 1H signal.
MR imaging was used to measure T2. The T2 value at different biofilm locations is influenced by a number of factors, including composition, water content, and concentration of paramagnetic ions. Thus, T2 values can be very revealing of biofilm properties.
It is important to distinguish between T2-weighted images and the T2 parameter maps that are described in this paper. First, T2-weighted images were measured at 64 echo times (Fig. 1). These highlight only T2 image contrast and were used for basic structural imaging of the biofilm. From these, T2 parameter maps were calculated (Fig. 1). In the T2 parameter maps, the image intensity is the actual T2 value. These parameter maps were used to obtain quantitative images of copper concentration.
Acquisition of T2-weighted images.
T2-weighted images were obtained using a multislice, multispin echo, two-dimensional imaging sequence; 64 consecutive spin echoes were acquired with an echo time of 6.8 ms and a recovery time of 7 s, providing, per slice, 64 T2-weighted images at increasing echo times (Fig. 1). Images were obtained for 14 adjacent slices across the sample, with a slice thickness of 1 mm. The field of view was 26 by 26 mm, using an imaging matrix of 130 by 130 pixels, giving an in-plane resolution of 200 by 200 μm. Two signal averages were taken, giving a total imaging time of 30 min.
Calculation of T2 parameter maps.
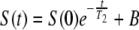
T2 parameter maps were calculated from the series of 64 T2-weighted images for each slice (Fig. 1B and C) by fitting the signal decay for each individual pixel to an exponential function,
 |
(1) |
where S(t) is the MRI signal at time t, S(0) is the MRI signal at time zero, B is a baseline offset parameter, and T2 is the decay constant for the transverse relaxation of the MRI signal back to equilibrium. It was found that all the signal decay curves were well fitted by such a single exponential function. The presence of paramagnetic metals, such as copper, cause a reduction in T2. Consequently, construction of T2 parameter maps during copper uptake can be used to reveal the location and relative concentration of copper.
Calibration of copper concentrations from T2 parameter maps.
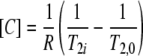
Significantly, this qualitative assessment can be calibrated to gain quantitative values for copper concentrations throughout the biofilm. The effect of paramagnetic ions, such as Cu2+, on the relaxation times of pure water was first considered theoretically by Bloembergen (5) with the equation
 |
(2) |
where T2,0 is the relaxation time in the absence of ions, T2i is the relaxation time in the presence of ions, [C] denotes the concentration of the copper ions, and R is the relaxivity constant of the ions. R describes how the concentration of paramagnetic ions changes the T2 relaxation time. In the current study, T2i and T2,0 are known variables, as they are taken directly from T2 parameter maps. R, however, is unknown and must be separately determined to enable the calculation of [C]. In similar human MRI studies where the concentration of gadolinium (Gd) paramagnetic contrast agents were measured, it has been common practice to assume that R is independent of tissue environment and simply to use a value for R derived from water standards. Recent work, however, by Stanisz and Henkelman (36) found that the R of Gd in bioporous media is dependent on the solids content of the bioporous media, with R increasing approximately linearly as solids content increases. As the value of R used in equation 2 impacts directly the accuracy of the calculated [C], the effect of solids content on copper relaxivity was investigated. Several types of media with different solids contents (i.e., water, agar, bacterial pellet, agar-bacterium composite, and agar-cyanobacterium composite [the preparation is described below]) were prepared at several known copper concentrations (ranging from 0 to 4,000 mg liter−1). For each type of medium, plots of (1/T2i − 1/T2,0) versus copper concentration were made, and R was determined from a least square fit to the data (equation 2). This enables the use of a value for R related to the solids content of the biofilm, thus giving a more accurate measurement of copper concentration. During the 60-h experiment, the flow system and biofilm had a slight positional movement, which, without correction, would have increased the error in calculating copper concentrations in the biofilm with equation 2. This was corrected for by registration of the T2i maps onto the reference T2,0 map (41).
Standards for the determination of impact of solids content on R.
A series of copper standards were made in six different suspension media of different solids contents (i.e., water, agar, bacterial pellet, bacterium-agar composite [two types], and cyanobacterium-agar composite). Each standard was prepared with a range of copper concentrations to confirm that, for each solids content, R remained consistent for a wide range of copper concentrations. Standards containing 1 ml water with Cu were prepared with 18 MΩ water and CuSO4·5H2O. Standards containing 1 ml agar with Cu were prepared with 1% agar. These standards were prepared to final copper concentrations of 0, 10, 50, 100, 250, 500, 750, 1,000, 1,500, 2,000, 3,000, and 4,000 mg copper liter−1. Bacterial-pellet standards were prepared with Bacillus subtilis (strain NR1129, supplied by Nicola Stanley-Wall, University of Dundee) grown to late exponential phase at 23°C and 110 rpm in tryptic soy broth. Cells were washed four times in ultrapure water by centrifugation, and 0.5-ml aliquots of the bacterial pellet were then resuspended in 50-ml polypropylene centrifuge tubes containing 50 ml of a 0-, 0.1-, 0.5-, 1-, 2.5-, 5-, 7.5-, 10-, 20-, or 30-mg liter−1 Cu solution and incubated for 1 hour. These were then neutralized to pH 7 with NaOH, incubated overnight, and centrifuged to create bacterial pellets, and the waste solution was removed. The amount of copper immobilized in each bacterial pellet was determined by analyzing filtered (pore size, 0.2 μm) waste solution by atomic adsorption spectroscopy (AAS). Bacterial pellets were then carefully transferred into 0.75-ml Eppendorf tubes and centrifuged at 10,000 rpm (6,700 × g) to recompress the pellet. This approach generated bacterial-pellet standards of between 0 and 2,800 mg liter−1. The fourth and fifth standard types consisted of bacterium-Cu pellets prepared as before but this time mixed with agar at agar/bacterium ratios of 50:50 and 60:30, generating composite bacterium-agar-Cu standards. A final set of agar-microbe-Cu standards were prepared with the cyanobacterium Anaebaena sp. (strain PT01; isolated from the El Tatio hot spring system, northern Chile, and maintained in the culture collection of V. Phoenix). The percentages of the solids contents of all standards and of the biofilm (after experimentation) were determined by weighing the mixtures before and after drying to a constant weight at 60°C.
PFG analysis.
In simple terms, the PFG experiment involves the application of two pulses of magnetic field gradients. The first pulse labels the initial positions of spins in the sample; this is then followed by a delay or observation time, during which the spins move due to molecular diffusion. The second pulse then labels the final positions of the spins in the sample. The resulting MRI signal thus contains ensemble information on the initial and final positions of all spins within the sample, thus allowing for a direct measurement of the diffusion coefficient.
Water diffusion parameter maps were measured by MRI using a diffusion-weighted, stimulated-echo imaging sequence, using the following parameters: an observation time of 15 ms, a gradient pulse duration of 1.2 ms, and diffusion-encoding b values of 33.7 and 234.4 s/mm2. Diffusion maps were collected immediately prior to the injection of copper into the system. We used the same spatial-imaging parameters and spatial location as described above for measuring the T2 parameter map.
Light microscopy.
Following MRI analysis, the biofilm was sectioned into ∼2-mm slices with a sterile scalpel and fixed in a solution of 2.5% glutaraldehyde with 0.05 M HEPES, pH 7, for 24 h. Tissue was then dehydrated through graded ethanol concentrations (70%, 90%, and 100% ethanol [four times], 24 h each time), imbedded in LR White (hard) resin, and sectioned on an ultramicrotome. Thin sections were viewed on a Zeiss Axioplan microscope with a Nikon DN100 digital camera.
Bulk copper analysis by AAS.
After reaction with copper, two sections of the biofilm were retained and measured to determine volume. These were then placed in 0.5 ml concentrated HCl, disaggregated, and incubated at room temperature for 24 h to dissolve the immobilized copper. This material was then spun down to pellet the organic material, and the eluent was transferred to 10 ml ultrapure water and analyzed for Cu by AAS.
Modeling of coupled diffusion-adsorption within a model biofilm.
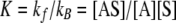
The coupled diffusion-adsorption process has been considered previously for thin films by Bartlett and Gardner (1). Adsorption of the adsorbate, A (e.g., Cu2+), onto a binding site, S, can be described with the following simple reversible reaction:
 |
(3) |
with the equilibrium constant (referred to herein as the adsorption constant), K, equal to
 |
(4) |
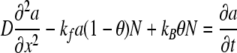
where kf and kB are the forward and backward rate constants. By assuming no interaction between adsorbed molecules, the adsorption process can be described by the Langmuir isotherm. For the one-dimensional case, taking x as the distance into a film of thickness L, t as time, and θ as the fraction of sites occupied (at a specified distance and time), the diffusion reaction equation for adsorbate A is given by
 |
(5) |
where D is the diffusion coefficient, N is the concentration of the binding sites within the film, a is the concentration of diffusing species A (at a specified distance and time) within the film, and a∞ is the constant concentration maintained at the top boundary of the film. Consideration of the kinetics at the reaction sites gives
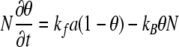 |
(6) |
Equations 5 and 6 are coupled nonlinear partial differential equations that do not have an exact analytical solution. However, Bartlett and Gardner (1) found that the problem could be divided into six cases and presented the approximate analytical solutions for each case. They introduced the following dimensionless parameters: χ is x/L, τ is Dt/L2, γ is a/a∞, κ is kfNL2/D, λ is Ka∞, and η is KN, giving the following coupled nonlinear partial differential equations:
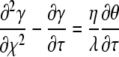 |
(7) |
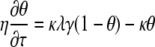 |
(8) |
For a film with slow diffusion, where equilibrium is maintained between the diffusing species and the reactive sites and a large amount of absorbate is absorbed by the sites (Bartlett and Gardner's case 6 [1]), the solution involves a moving boundary, with position χ*,
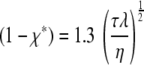 |
(9) |
The absorbate concentrations, on each side of the moving boundary, are given by γ1 and γ2,
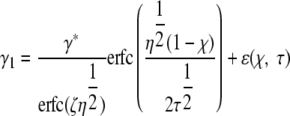 |
(10) |
 |
(11) |
and the surface coverage is given by
 |
(12) |
To take account of the finite thickness of the film with an impermeable barrier, a correction term, ɛ, is applied.
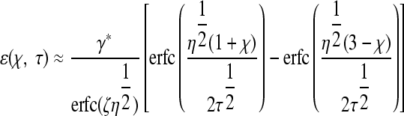 |
(13) |
Based on results from MRI analysis, variables representative of the phototrophic biofilm were put into the model. Details of these variables are provided in Results and Discussion but are also summarized here for clarity. For this example, a best-case scenario with the highest relative diffusion coefficient (Dr) (1.0) and pore volume fraction (Φ) (0.9) was chosen, generating a relative effective diffusivity (Deff) of 0.9 (see Results and equations 15 and 16 for details). Quickenden and Xu (33) reported the diffusion coefficient for Cu2+ in an infinitely dilute solution at 25°C to be 7.8 × 10⁻¹⁰ m2 s−1. Multiplying this value by Deff generates an actual effective diffusion coefficient (D) of 7.0 × 10⁻¹⁰ m2 s−1. The concentration of Cu2+ in the overlying fluid (a∞) was set at 1.57 × 10⁻⁴ M (i.e., 10 mg liter−1). The total concentration of reactive ligands, N, was determined as the sum of metal-complexed sites (AS) and uncomplexed sites (S) at maximum adsorption capacity. For this, AS was taken to be the average maximum adsorption concentration of the biofilm, 9.45 × 10⁻⁴ M (60 mg liter−1 [see Results]), while S was calculated using equation 4, with A equal to a∞. Models were run using a range of adsorption constants (K), from 2 × 10⁴ to 1.5 × 10⁵. These values were chosen to span previously reported K values for bacterial Cu2+ adsorption onto the main binding site below circum-neutral pH (these K values typically range from 2 × 10⁴ to 6 × 10⁴ [13, 29, 42]; the higher K of 1.5 × 10⁵ is included for comparative purposes). Above this pH, an additional binding site can be required to explain adsorption phenomena. For the purposes of the model, we assume that the system remained below circum-neutral pH because (i) the 4-liter reaction solution was at pH 5.5, (ii) the experiment was performed in darkness (thus not generating hydroxyl ions via photosynthesis), and (iii) the system had been purged with ultrapure water prior to copper injection (removing high-pH solutions).
RESULTS
MRI of a biofilm structure.
Prior to the injection of copper solution, T2-weighted images were collected for 14 consecutive slices through the biofilm. For each slice, 64 images were acquired, each with a longer echo time and greater T2 weighting. This allowed selection of the echo time (T2 weighting) which best revealed structural detail. Figure 2, which shows the 14 slices at an echo time of 101 ms, reveals the considerable structural complexity of the biofilm. Particularly striking is the layered substructure apparent in many of the slices (exemplified in Fig. 2J but also present in Fig. 2B, C, G, and H). These layers are commonly curved (convex side up) into a coniform architecture. Laminations were approximately 500 μm in thickness. Where laminations are not present, the biofilm exhibits a complex internal structure which has no apparent systematic pattern (Fig. 2A, D, E, F, K, and L). In slices E to H, the biofilm appears to be composed of two adjacent structures. This is most clearly defined in slices G and H, which exhibit a well-defined, narrow, central divide separating the two sections. The fact that this septum is dark (i.e., exhibits a low T2 value) indicates that the divide is composed of dense, low-water-content material and is not filled with water. The two adjacent structures merge, eventually forming one continuous structure in Fig. 2J. The brightest regions exhibit the same T2 value as water, indicating that these features are large, water-filled channels or pores (exemplified in Fig. 2B, D, E, and F). These features, however, are quite rare. Conversely, dark regions of low T2 relaxation are common in all slices and are particularly abundant at the base and sometimes the sides of the biofilm. These regions of very low T2 relaxation must result either from the presence of very high density organic matter (which is due to the fact that its lower water content reduces T2) or from the presence of mineral particulates (which reduce T2 either by reducing water content or by introducing paramagnetic atoms into the system). Simple visual inspection of the biofilm reveals that the very low T2 regions at the base of the biofilm are due to a high concentration of mineral particulates.
FIG. 2.

T2-weighted MR image at echo 14 and an echo time of 101 ms showing 12 sequential slices (A to L) through the natural biofilm. Slices are 1 mm thick. Filled arrows indicate examples of water-filled channels or pores. Open arrows indicate the biofilm septum. Scale bar = 1 cm.
Light microscopy of thin sections and unprocessed biofilm revealed that the biofilm was dominated by the filamentous cyanobacterium Phormidium sp. throughout. Within the biofilm, the main structural heterogeneities result from variations in the packing density of this organism (Fig. 3).
FIG. 3.

Light micrographs of thin biofilm sections showing zones of high-density (a) and low-density (b) filament packing. Scale, 50 μm.
Biofilm water diffusion coefficients.
For the same 14 slices through the biofilm, diffusion parameter images were taken using PFG-MRI. These successfully mapped water diffusion coefficients throughout the biofilm (Fig. 4). Water diffusion coefficients varied between 1.7 × 10⁻⁹ and 2.2 × 10⁻⁹ m2 s−1, although they commonly varied between 1.9 × 10⁻⁹ and 2.2 × 10⁻⁹ m2 s−1 (Fig. 4C). Under experimental conditions, the diffusion coefficient for the self-diffusion of pure water was 2.2 × 10⁻⁹ m2 s−1. Notably, water diffusion coefficients did not appear to be significantly influenced by biofilm structure.
FIG. 4.

Examples of a water diffusion map and profiles. (A) MR slice showing the biofilm structure (the area taken from the slice shown in Fig. 2J). (B) Corresponding relative water diffusion coefficient map. The differences in contrast reflect differences in water diffusion coefficients. (C) Profile of actual water diffusion coefficients along the transect shown in panels A and B. Overall, little variation in the water diffusion coefficient was observed. The scale of the line of transects in panels A and B is 7.5 mm long.
Calibration of copper immobilization images.
Analysis of the impact of solids content on copper relaxivity, R, shows that R increases linearly with solids content (Fig. 5). A linear least squares fit to the data in Fig. 1 gives
 |
(14) |
where S is the percent solids content of the media. The solids content of the biofilm was determined to be 9.8%, and this value was put into equation 14, generating an R value of 0.0295 s−1 mg−1 liter−1. This R value was used in equation 2, enabling calculation of the copper concentration from the T2 parameter maps.
FIG. 5.

Impact of solids content on copper Cu relaxivity. Media used were water (U), agar (V), agar-cyanobacteria (W), 30:60 bacteria-agar (X), 50:50 bacteria-agar (Y), and the bacterial pellet (Z). Standard deviations were relatively small, indicating that, at each solids density, R remained consistent for a wide range of copper concentrations. Larger deviations in the 30:60 and 50:50 bacterium-agar media are probably due to the greater technical difficulty in the preparation of the standards.
Dynamic Cu immobilization within the biofilm.
The biofilm was then challenged with a 10-mg/liter Cu2+ solution for 60 h, and the MRI was used to quantitatively image the Cu concentration within the biofilm. Figure 6 depicts a series of maps showing copper concentrations throughout a biofilm slice (the same slice as in Fig. 2J) after 6, 12, 18, 24, and 60 h of reaction with copper. It should be noted here that during the 60-h reaction with the copper solution, the very top 2 mm of the biofilm exhibited significant positional shift that could not be overcome by registration of the T2i maps onto the reference T2,0 map. This prevented a reliable calculation of the copper concentration in this very top zone; hence, we do not show results for the top 2 mm. Copper immobilization was most rapid over the first 24 h and then increased very slowly for the remainder of the experiment. This is shown by the notable brightening of the images from 6 to 24 h (Fig. 6A through D), followed by a smaller increase in brightness between 24 and 60 h (Fig. 6D to E). The rate and amount of copper immobilization were heterogeneous throughout the biofilm. For example, after the first 6 h, some regions, in particular the lower central portion of the biofilm, had failed to accumulate any copper, while other areas displayed significant copper uptake (Fig. 6A). Where the biofilm exhibited a layered structure, the copper was immobilized into alternating layers of high and low copper concentrations, which reflected this structure.
FIG. 6.

Quantitative copper concentration maps revealing copper immobilization in the biofilm after 6, 12, 18, 24, and 60 h (A, B, C, D and E, respectively). Brighter regions are regions of greater copper concentration. The grayscale indicates the copper concentrations (mg liter−1). Scale (dashed line in panel E), 7.5 mm.
Copper immobilization reached a maximum of ∼90 mg Cu per liter of biofilm (Fig. 7A) (note that all copper concentrations in the biofilm are reported as mg Cu per liter volume of biofilm). A 10- to 30-mg liter−1 difference in copper concentration occurred between the alternating layers of high and low copper concentrations (Fig. 7A). Copper uptake profiles confirmed that Cu immobilization was most rapid over the initial ∼20 to 30 h, with an uptake rate of ∼5 mg liter−1 h−1 at its most rapid (Fig. 7A and B). In general, Cu immobilization rates over this initial period were slower with increasing depth into the biofilm. Cu immobilization rates then notably slowed for the later part (h 30 to 60) of the experiment (with rates commonly around 0.3 mg liter−1 h−1). One exception to this was the uptake rate at 7.5 mm, which did not notably slow during this later period.
FIG. 7.

(A) Calibrated copper concentrations at 0 to 60 h along the transect shown by the white line in Fig. 6E. (B) Cu concentration-versus-time plot for depths (depths are shown in mm) along the transect shown in panel A. For consistency, all plots in panel B were selected from depths which exhibited peaks in panel A.
Significantly, the accuracy of the MRI Cu calibration was strongly supported by AAS analysis of the acid-digested biofilm material. AAS analysis recorded that the biofilm exhibited a bulk copper concentration of 59.5 and 63.6 mg liter−1 Cu from the two samples analyzed. Similarly, the bulk average copper density in the biofilm determined by MRI was 60 mg liter−1.
A Bartlett-Gardner model was used to explore diffusion adsorption phenomena in a hypothetical film with properties similar to those of the phototrophic biofilm studied here. Depth-dependent concentration-time plots generated using this model are shown in Fig. 8. For an adsorption constant of 2 × 10⁴, initial adsorption rate decreases with depth and there is a short lag time until the onset of Cu adsorption deeper within the film (Fig. 8). At increasing values of K, the lag time until onset of adsorption increases, and the initial absorption rate also increases. At the highest K value (1.5 × 10⁵), the onset of the adsorption lag time now dominates the uptake profile (Fig. 8).
FIG. 8.

Bartlett-Gardner model showing rates of copper adsorption at different depths in a hypothetical film with the same adsorption capacity and diffusivity as the phototrophic biofilms. (A) K = 2 × 10⁴; (B) K = 5 × 10⁴; (C) K = 1.5 × 10⁵.
DISCUSSION
MRI was very successful in revealing complex structural heterogeneity within the natural biofilm. Within the ∼1-cm3 biofilm volume, considerable variations in structure ranging from a highly ordered coniform layering to complex structures with no apparent organization were observed. Layered structures are a common feature of phototrophic biofilms (8, 34), resulting from differing cellular densities, orientations, and taxa. Large variations in taxonomic composition within phototrophic biofilms commonly result in distinct bands differentiated by marked color differences. However, simple visual inspection revealed that the biofilm was very light green throughout and, except for a distinct 1-mm dark green layer at the very top of the biofilm, only very faint structural features, such as coniform laminations, could be observed. Light microscopy of thin sections and unprocessed biofilm revealed that the main structural heterogeneities resulted from variations in the packing densities of the cyanobacterium Phormidium sp., which dominated the biofilm.
Normal visual and light microscopy also confirmed that the very dark areas around the base of the biofilm and in the divide between the two sections (Fig. 2) contained high concentrations of mineral material. The base is a mix of mineral and microbial components, where microbes grew among the mineral particulates much like in a stromatolite. Eventually, however, biofilm growth would have exceeded the mineral accumulation rate, leading to the growth of the rest of the biofilm with minimal mineral acquisition.
Some water-filled pores are observed in Fig. 2. These are, however, rare and appear to be individual entities (i.e., pore spaces rather than connected channels). Evidently, the biofilm lacks significant interconnected large-scale channels which would act as major nutrient and gas transport pathways under flow conditions. Although channels could exist below image resolution, the rarity of channels was further corroborated by light microscopy of thin sections. Consequently, diffusive transport processes must dominate within this biofilm.
Evaluation of water diffusivity is pertinent because water is the key medium in which other essential compounds, such as nutrients and waste, are dissolved. Studies which record diffusion coefficients for water along with other molecules in biofilms show an exceptionally close relationship between the diffusivity of water and the diffusion coefficients of the other measured molecules (2, 11, 12, 39), indicating that water diffusivity can be used to estimate the diffusion of other essential compounds (2, 40). PFG analysis offers a rapid technique for evaluating water diffusion. This approach, however, has traditionally reported only bulk average diffusion coefficients for the entire biofilm and thus does not reveal spatial-diffusion heterogeneities resulting from biofilm complexity. In response to this, Wieland et al. (40) advanced the PFG approach to spatially map water diffusion coefficients through a phototrophic biofilm. We utilize the same approach here. In the current study, water diffusion coefficients showed little or no attenuation throughout the biofilm, with water diffusion coefficients most commonly being between the unattenuated value 2.2 × 10⁻⁹ m−2 s−1 (Dr = 1.0) and 1.9 × 10⁻⁹ m−2 s−1 (Dr = 0.86), although they dropped as low as 1.7 × 10⁻⁹ m−2 s−1 (Dr = 0.77) (the relative diffusion coefficient, Dr, is the diffusion coefficient normalized to the unattenuated diffusion coefficient in free water). Notably, there appears to be relatively little diffusion heterogeneity, considering the structural complexity of the biofilm. PFG analysis determined that values for Dr for the phototrophic biofilm studied by Wieland et al. (40) varied between ∼0.4 and 0.9 and thus showed zones with higher diffusion attenuation and greater diffusion heterogeneity than those of the phototrophic biofilm studied here. The two key factors which control diffusivity are the packing density of cells and extracellular polymeric substances (EPS); an increase in the volume fraction of these components causes a decrease in the diffusion coefficient (2). Cellular and EPS material reduce diffusivity by acting as solid obstructions which increase the tortuosity of the diffusive path length. In this study, however, the volume fraction of cellular and EPS material was evidently sufficient to cause only limited diffusion attenuation. Compared to the cell volume fraction, the EPS volume fraction is considered to have a greater impact on diffusion rates (2, 16). Staining of thin sections with 1% toluidine blue-1% borax revealed an abundance of EPS material filling the spaces between bacteria and forming the matrix of the biofilm. Cellular volume fraction varied from almost 0 to approximately 30%; the biofilm is dominated by an extracellular matrix (∼70 to 100%) (determined by area analysis of thin sections using ImageJ software). Despite its relative abundance, the EPS in this case failed to cause notable water diffusion attenuation. EPS and cellular material also affect mass transport processes by reducing the pore volume available for diffusion. Thus, the amount of a substance transported is controlled by both its rate of diffusion and the volume available for it to diffuse through. Considering the fact that the pore volume fraction generates the value Deff,
 |
(15) |
where Φ is the pore volume fraction and Deff is the relative effective diffusivity. Void fraction can be estimated from the dry density of the biofilm using the equation
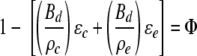 |
(16) |
where Bd is the biofilm dry mass per hydrated volume of biofilm, ρc and ρe are cellular and EPS dry densities (per hydrated volume), respectively, and ɛc and ɛe are volume fractions of cells and EPS, respectively. Estimations of the void fraction typically apply values for ρc and ρe of ∼0.35 g cm−3 and 1.0 g cm−3, respectively (37). Considering these parameters, the measured values for Bd of 0.1 g cm−3 and for ɛc and ɛe of 0 to 0.3 and 0.7 to 1.0, respectively, generate pore fractions between 0.84 and 0.9. While an estimate, this does suggest a relatively high pore fraction, resulting in only a small difference between Dr and Deff. Applying pore fraction values to equation 15 generates values for Deff between 0.9 and 0.65. Although values of Deff for some biofilm types can be as small as 0.07 (37), the Deff values recorded here are consistent with those for phototrophic biofilms (35, 40).
In this study, MRI was successful in resolving copper immobilization throughout a phototrophic biofilm. Moreover, the application of a density-corrected calibration protocol enabled direct quantification of copper concentrations both temporally and spatially. Significantly, the copper concentration obtained from this calibration was supported by AAS analysis of biofilm digests. The biofilm immobilized an average of 60 mg Cu liter−1, with peaks of up to 90 mg liter−1, and Cu immobilization rates were most rapid over the first 20 to 30 h. In central, deeper zones of the biofilm, a lag time of ∼6 h occurred before the onset of copper immobilization. The copper immobilization rates observed within the biofilm are, in part, mediated by diffusion rates, which influence the rate of supply of Cu2+ throughout the biofilm. However, the transport of copper in the biofilm is controlled not only by diffusive processes but also by immobilization. As Cu2+ ions migrate through the film, some are immobilized, while others are free to diffuse further until they too are sequestered. The ratio of ions sequestered to those allowed to diffuse further is dependent on the immobilization constant (broadly speaking, the magnitude of the driving force behind immobilization). This could be the saturation index under supersaturated conditions (where precipitation may be the key immobilization mechanism) or the adsorption constant under undersaturated conditions (where adsorption onto cellular and EPS ligands is the key immobilization mechanism). Analysis of diffusion and copper immobilization not only enables quantification of these processes in real biofilms but also enables input of these parameters into reaction transport models for exploration of these phenomena further. To explore the adsorption scenario, a Bartlett and Gardner model which explicitly incorporates both diffusion and the reversible adsorption described by a one-site Langmuir isotherm (equations 3 to 13) (1) was used. The longer lag times until the onset of immobilization and the higher adsorption rates observed at higher K values (Fig. 8) reflect stronger adsorption by metal binding sites. That is, at higher K values, more of the copper ions are instantly adsorbed and further diffusion into the film is inhibited until these sites become close to saturated. At lower K values, more Cu2+ can diffuse through a given depth without being bound, leading to shorter lag times and lower initial adsorption rates.
Although this model is a simplified, homogeneous, one-dimensional version of a complex phototrophic biofilm, comparisons can be drawn between the model and the raw data. The rates of immobilization in the 2 × 10⁴ model are, broadly speaking, similar to those exhibited by the biofilm (compare Fig. 7B and 8A). The three models and the biofilm exhibit lag times until the onset of immobilization (although the lag times in the biofilm are shorter and, due to the time intervals of the experiment, apparent much deeper than in the models) (compare Fig. 7A and B and 8). There is also an approximate decrease in the initial rate of immobilization with depth in the biofilm (illustrated idealistically in the models, particularly the 2 × 10⁴ model). It is notable that the adsorption rate at 7.5 mm did not notably slow during the experiment; this may be due to a much higher adsorption capacity at this location. In short, despite its complexity, key characteristics of combined adsorption-diffusion phenomena can be observed in the phototrophic biofilm.
Although we cannot rule out the possibility of precipitation as an immobilization mechanism here, if precipitation (driven by high pH) were the key immobilization mechanism, one would expect the metal to be rapidly and irreversibly immobilized upon entering the film. This process would bear greater similarity to systems with exceptionally high K values. Thus, in these systems, one would expect concentration-time curves dominated by lag times with similar uptake rates at each depth. In this regard, we tentatively suggest here that copper immobilization in the biofilm is most consistent with immobilization by adsorption. In planktonic systems, metal ion adsorption reaches equilibrium in less (often considerably less) than an hour. Based on the results (both model results and raw data) of this study, one must expect considerably longer equilibration times in biofilms.
In this study, the experiments were performed in darkness and the biofilm was therefore not photosynthesizing. The obvious next step, then, is to examine the impact of photosynthesis (which raises the pH within the biofilm) on copper immobilization.
In this study we have shown that MRI is a valuable tool for quantifying (paramagnetic) heavy metal transport and determining the fate of heavy metals in naturally occurring biofilms. Significantly, copper concentrations can be directly calibrated using a solids-content-corrected calibration protocol. The ability of MRI to resolve both biofilm structure and diffusion coefficients enables the impact of these parameters on heavy metal transport and fate to be determined, thus revealing new insights into heavy metal-biofilm interactions in natural systems. Although in this study we focused upon Cu2+, numerous other metals are sufficiently paramagnetic to be detected by MRI, including Ni2+, Cr3+, Co2+, Ti2+, Nd3+, Th4+, Fe3+, Fe2+, and Mn2+. Therefore, MRI has the potential to examine the transport and fate of a wide variety of potentially toxic (or indeed beneficial) metals in naturally occurring biofilms.
Footnotes
Published ahead of print on 13 June 2008.
REFERENCES
- 1.Bartlett, P. N., and J. W. Gardner. 1996. Diffusion and binding of molecules to sites within homogeneous thin films. Philos. Trans. R. Soc. London A 354:35-57. [Google Scholar]
- 2.Beuling, E. E., D. van Dusschoten, P. Lens, J. C. van den Heuvel, H. Van As, and S. P. P. Ottengraf. 1998. Characterization of the diffusive properties of biofilms using pulsed field gradient-nuclear magnetic resonance. Biotechnol. Bioeng. 60:283-291. [DOI] [PubMed] [Google Scholar]
- 3.Beyenal, H., and Z. Lewandowski. 2002. Internal and external mass transfer in biofilms grown at various flow velocities. Biotechnol. Prog. 18:55-61. [DOI] [PubMed] [Google Scholar]
- 4.Bishop, P. L. 2003. The effect of biofilm heterogeneity on metabolic process, p. 125-146. In S. Wuertz, P. Bishop, and P. Wilderer (ed.), Biofilms in wastewater treatment: an interdisciplinary approach. IWA Publishing, London, United Kingdom.
- 5.Bloembergen, N. 1957. Proton relaxation times in paramagnetic solutions. J. Chem. Phys. 27:572-573. [Google Scholar]
- 6.Buffiere, P., J. P. Steyer, C. Fonade, and R. Moletta. 1995. Comprehensive modeling of methanogenic biofilms in fluidized-bed systems—mass-transfer limitations and multisubstrate aspects. Biotechnol. Bioeng. 48:725-736. [DOI] [PubMed] [Google Scholar]
- 7.Callaghan, P. T. 1993. Principles of nuclear magnetic resonance microscopy. Oxford University Press, Oxford, United Kingdom.
- 8.Casillas-Martinez, L., M. L. Gonzalez, Z. Fuentes-Figueroa, C. M. Castro, D. Nieves-Mendez, C. Hernandez, W. Ramirez, R. E. Sytsma, J. Perez-Jimenez, and P. T. Visscher. 2005. Community structure, geochemical characteristics and mineralogy of a hypersaline microbial mat, Cabo Rojo, PR. Geomicrobiol. J. 22:269-281. [Google Scholar]
- 9.Damgaard, L. R., L. P. Nielsen, and N. P. Revsbech. 2001. Methane microprofiles in a sewage biofilm determined with a microscale biosensor. Water Res. 35:1379-1386. [DOI] [PubMed] [Google Scholar]
- 10.Des Marias, D. J. 1995. The biogeochemistry of hypersaline microbial mats. Adv. Microb. Ecol. 14:251-274. [DOI] [PubMed] [Google Scholar]
- 11.Dibdin, G. H. 1981. Diffusion of sugars and carboxylic-acids through human dental plaque in vitro. Arch. Oral Biol. 26:515-523. [DOI] [PubMed] [Google Scholar]
- 12.Dibdin, G. H. 1993. Effect of the bathing fluid on measurements of diffusion in dental plaque. Arch. Oral Biol. 38:251-254. [DOI] [PubMed] [Google Scholar]
- 13.Fein, J. B., C. J. Daughney, N. Yee, and T. A. Davis. 1997. A chemical equilibrium model for metal adsorption onto bacterial surfaces. Geochim. Cosmochim. Acta 61:3319-3328. [Google Scholar]
- 14.Gladden, L. F. 2003. Magnetic resonance: ongoing and future role in chemical engineering research. AIChE J. 49:2-9. [Google Scholar]
- 15.Hill, W. R., A. T. Bednarek, and I. L. Larsen. 2000. Cadmium sorption and toxicity in autotrophic biofilms. Can. J. Fish. Aquat. Sci. 57:530-537. [Google Scholar]
- 16.Hinson, R. K., and W. M. Kocher. 1996. Model for effective diffusivities in aerobic biofilms. J. Environ. Eng. 122:1023-1030. [Google Scholar]
- 17.Horn, H., and D. C. Hempel. 1997. Substrate utilization and mass transfer in an autotrophic biofilm system: experimental results and numerical simulation. Biotechnol. Bioeng. 53:363-371. [DOI] [PubMed] [Google Scholar]
- 18.Islam, F. S., A. G. Gault, C. Boothman, D. A. Polya, J. M. Charnock, D. Chatterjee, and J. R. Lloyd. 2004. Role of metal-reducing bacteria in arsenic release from Bengal Delta sediments. Nature 430:68-71. [DOI] [PubMed] [Google Scholar]
- 19.Johnson, K. J., J. E. S. Szymanowski, D. Borrok, T. Q. Huynh, and J. B. Fein. 2007. Proton and metal adsorption onto bacterial consortia: stability constants for metal-bacterial surface complexes. Chem. Geol. 239:13-26. [Google Scholar]
- 20.Lens, P., F. Vergeldt, G. Lettinga, and H. Van As. 1999. H-1 NMR characterisation of the diffusional properties of methanogenic granular sludge. Water Sci. Technol. 39:187-194. [Google Scholar]
- 21.Lewandowski, Z., and H. Beyenal. 2003. Mass transport in heterogeneous biofilms, p. 147-177. In S. Wuertz, P. Bishop, and P. Wilderer (ed.), Biofilms in wastewater treatment: an interdisciplinary approach. IWA Publishing, London, United Kingdom.
- 22.Lewandowski, Z., P. Stoodley, and S. Altobelli. 1995. Experimental and conceptual studies on mass-transport in biofilms. Water Sci. Technol. 31:153-162. [Google Scholar]
- 23.Ley, R. E., J. K. Harris, J. Wilcox, J. R. Spear, S. R. Miller, B. M. Bebout, J. A. Maresca, D. A. Bryant, M. L. Sogin, and N. R. Pace. 2006. Unexpected diversity and complexity of the Guerrero Negro hypersaline microbial mat. Appl. Environ. Microbiol. 72:3685-3695. [DOI] [PMC free article] [PubMed] [Google Scholar]
- 24.Lopez-Gonzalez, M. R., W. M. Holmes, and P. T. Callaghan. 2006. Rheo-NMR phenomena of wormlike micelles. Soft Matter 2:855-869. [DOI] [PubMed] [Google Scholar]
- 25.Majors, P. D., J. S. McLean, J. K. Fredrickson, and R. A. Wind. 2005. NMR methods for in-situ biofilm metabolism studies: spatial and temporal resolved measurements. Water Sci. Technol. 52:7-12. [DOI] [PubMed] [Google Scholar]
- 26.Mitchell, A. C., and F. G. Ferris. 2005. The coprecipitation of Sr into calcite precipitates induced by bacterial ureolysis in artificial groundwater: temperature and kinetic dependence. Geochim. Cosmochim. Acta 69:4199-4210. [Google Scholar]
- 27.Morris, J. M., A. M. Farag, D. A. Nimick, and J. S. Meyer. 2006. Light-mediated Zn uptake in photosynthetic biofilm. Hydrobiologia 571:361-371. [Google Scholar]
- 28.Ngwenya, B. T. 2007. Enhanced adsorption of zinc is associated with aging and lysis of bacterial cells in batch incubations. Chemosphere 67:1982-1992. [DOI] [PubMed] [Google Scholar]
- 29.Ngwenya, B. T., I. W. Sutherland, and L. Kennedy. 2003. Comparison of the acid-base behaviour and metal adsorption characteristics of a gram-negative bacterium with other strains. Appl. Geochem. 18:527-538. [Google Scholar]
- 30.Nott, K. P., F. P. Heese, M. Paterson-Beedle, L. E. Macaskie, and L. D. Hall. 2005. Visualization of the function of a biofilm reactor by magnetic resonance imaging. Can. J. Chem. Eng. 83:68-72. [Google Scholar]
- 31.Nott, K. P., M. Paterson-Beedle, L. E. Macaskie, and L. D. Hall. 2001. Visualisation of metal deposition in biofilm reactors by three-dimensional magnetic resonance imaging (MRI). Biotechnol. Lett. 23:1749-1757. [Google Scholar]
- 32.Ortiz-Bernad, I., R. T. Anderson, H. A. Vrionis, and D. R. Lovley. 2004. Vanadium respiration by Geobacter metallireducens: novel strategy for in situ removal of vanadium from groundwater. Appl. Environ. Microbiol. 70:3091-3095. [DOI] [PMC free article] [PubMed] [Google Scholar]
- 33.Quickenden, T. I., and Q. Z. Xu. 1996. Toward a reliable value for the diffusion coefficient of cupric ion in aqueous solution. J. Electrochem. Soc. 143:1248-1253. [Google Scholar]
- 34.Ramsing, N. B., M. J. Ferris, and D. M. Ward. 2000. Highly ordered vertical structure of Synechococcus populations within the one-millimeter-thick photic zone of a hot spring cyanobacterial mat. Appl. Environ. Microbiol. 66:1038-1049. [DOI] [PMC free article] [PubMed] [Google Scholar]
- 35.Revsbech, N. P. 1989. Diffusion characteristics of microbial communities determined by use of oxygen microsensors. J. Microbiol. Methods 9:111-122. [Google Scholar]
- 36.Stanisz, G. J., and R. M. Henkelman. 2000. Gd-DTPA relaxivity depends on macromolecular content. Magn. Reson. Med. 44:665-667. [DOI] [PubMed] [Google Scholar]
- 37.Stewart, P. S. 1998. A review of experimental measurements of effective diffusive permeabilities and effective diffusion coefficients in biofilms. Biotechnol. Bioeng. 59:261-272. [DOI] [PubMed] [Google Scholar]
- 38.Tofts, P. Quantitative MRI of the brain. John Wiley, Oxford, United Kingdom.
- 39.Vogt, M., H. C. Flemming, and W. S. Veeman. 2000. Diffusion in Pseudomonas aeruginosa biofilms: a pulsed field gradient NMR study. J. Biotechnol. 77:137-146. [DOI] [PubMed] [Google Scholar]
- 40.Wieland, A., D. de Beer, L. R. Damgaard, and M. Kuhl. 2001. Fine-scale measurement of diffusivity in a microbial mat with nuclear magnetic resonance imaging. Limnol. Oceanogr. 46:248-259. [Google Scholar]
- 41.Woods, R. P., J. C. Mazziotta, and S. R. Cherry. 1993. Mri-Pet registration with automated algorithm. J. Comput. Assist. Tomogr. 17:536-546. [DOI] [PubMed] [Google Scholar]
- 42.Yee, N., L. G. Benning, V. R. Phoenix, and F. G. Ferris. 2004. Characterization of metal-cyanobacteria sorption reactions: a combined macroscopic and infrared spectroscopic investigation. Environ. Sci. Technol. 38:775-782. [DOI] [PubMed] [Google Scholar]