

Abstract
Tuberculous infections caused by mycobacteria, especially tuberculosis of humans and cattle, are important both clinically and economically. Human populations can be vaccinated with Mycobacterium bovis bacille Calmette-Guérin (BCG), and control measures for cattle involving vaccination are now being actively considered. However, diagnostic tests based on tuberculin cannot distinguish between genuine infection and vaccination with BCG. Therefore, identification of differential diagnostic antigens capable of making this distinction is required, and until now sequence-based approaches have been predominant. Here we explored the link between antigenicity and mRNA expression level, as well as the possibility that we may be able to detect differential antigens by analyzing quantified global transcriptional profiles. We generated a list of 14 candidate antigens that are highly expressed in Mycobacterium tuberculosis and M. bovis under a variety of growth conditions. These candidates were screened in M. bovis-infected and naïve cattle for the ability to stimulate a gamma interferon (IFN-γ) response. We identified one antigen, Rv3615c, which stimulated IFN-γ responses in a significant proportion of M. bovis-infected cattle (11 of 30 cattle [37%] [P < 0.01]) but not in naïve or BCG-vaccinated animals. Importantly, the same antigen stimulated IFN-γ responses in a significant proportion of infected cattle that did not respond to the well-characterized mycobacterial antigens ESAT-6 and CFP-10. Therefore, use of the Rv3615c epitope in combination with previously described differential tests based on ESAT-6 and CFP-10 has the potential to significantly increase diagnostic sensitivity without reducing specificity in BCG-vaccinated populations.
Mycobacterium tuberculosis and Mycobacterium bovis are important pathogens of humans and animals. M. tuberculosis is thought to have infected one-third of the world's human population, causing 10 million cases of disease per year and resulting in 2 million deaths (7). M. bovis is the causative agent of bovine tuberculosis (BTB), which is a significant economic burden to the agricultural industries of various countries, including the United Kingdom (13; http://www.defra.gov.uk/animalh/tb/stats/expenditure.htm).
Current methods of control for these mycobacterial infections in human and cattle populations center on diagnosis using an intradermal skin test with a purified protein derivative (PPD) (tuberculin) harvested from mycobacterial cultures. In humans, this is combined with vaccination using the live attenuated strain M. bovis bacille Calmette-Guérin (BCG) and chemotherapy. BTB control measures in Great Britain and other European countries consist of a “test and slaughter” strategy, where a positive result in a routine skin test, the single intradermal comparative tuberculin test, leads to mandatory slaughter. Vaccination of both humans and cattle with BCG sensitizes individuals to tuberculin, thereby interfering with diagnosis. Vaccination approaches for cattle involving BCG are now being actively considered, and therefore it is critical that more discriminatory diagnostic reagents, in the form of differential antigens (DIVA) that differentiate infected animals from vaccinated animals, be developed to aid in the control of both human tuberculosis and BTB.
The identification of new subunit vaccine candidates or diagnostic markers for numerous infectious diseases has been greatly enhanced by the development of various postgenomic approaches (4, 5, 8, 17, 26). These approaches have largely involved sequence-based analyses of the pathogens' genomes. In contrast, here we took an approach that focused on the transcriptional activity of genes to identify potential antigens. We previously described a microarray analysis method that quantifies levels of gene expression on a genome-wide scale (22). While analyzing a population of gene products that were consistently expressed at high levels under a variety of culture conditions (which we called the abundant invariome), we observed that it included many significant mycobacterial antigens, including ESAT-6 and CFP-10. While it is perhaps intuitive that a highly expressed protein is more likely to be antigenic, this hypothesis has not been studied comprehensively. Shi et al. have demonstrated that the expression levels of mycobacterial antigens during early and late stages of infection are consistent with the levels of the responses against the antigens during infection (20). Furthermore, an association between expression level and immunogenicity was reported recently with the observation that the number of CD4+ T cells responsive to a known mycobacterial antigen is closely related to the level of transcription of its gene (18). Here we studied the problem from the opposite perspective, asking whether the products of highly expressed genes are good antigens.
In this study we assessed 14 previously untested members of the abundant invariome to determine their potential as immunogens and diagnostic markers of infection using M. bovis-infected cattle. We identified one antigen that not only discriminates between infected and vaccinated cattle but also, importantly, shows a marked response in infected cattle that do not respond to the classic mycobacterial antigens ESAT-6 and CFP-10. We suggest that this antigen has the potential to enhance diagnosis by increasing the sensitivity of previously described differential diagnostic tests based on ESAT-6 and CFP-10.
MATERIALS AND METHODS
Selection of candidate antigens.
mRNA levels were quantified as described previously (22) using microarray data for M. tuberculosis and M. bovis. Array analyses were performed with M. tuberculosis grown in aerobic and low-oxygen chemostats, as well as in batch culture and macrophages. M. bovis was grown in aerobic chemostats and batch culture. All bacterial culture, RNA extraction, labeling, and microarray procedures have been described previously (1, 22). Fully annotated microarray data have been deposited in BμG@Sbase (accession no. E-BUGS-60; http://bugs.sgul.ac.uk/E-BUGS-60) and also ArrayExpress (accession no. E-BUGS-60).
Candidate antigens were first selected based on their consistent high levels of expression. To do this, we first defined abundant invariomes of M. tuberculosis and M. bovis. This was done by selecting genes consistently among the top 15% of the most abundant mRNA transcripts across all conditions for either M. tuberculosis (178 genes) or M. bovis (386 genes) for which appropriate microarray data were available. There were 133 genes common to both organisms' abundant invariomes. Candidates were further selected based on a level of amino acid homology in M. tuberculosis and M. bovis of 98% or higher. We also examined the amino acid sequence homology for a further five species of Mycobacterium, as well as the closely related organisms Corynebacterium glutamicum and Nocardia farcinica, paying special attention to the similarity to proteins of Mycobacterium avium (see Table 2), as PPD from this species is used in the single intradermal comparative tuberculin test. With two exceptions, Rv1211c and Rv3477, we chose candidates that had limited homology to proteins in these other organisms in the hope of reducing cross-reactivity with mycobacteria encountered elsewhere. We initially selected 21 candidates, including 5 that were highly expressed (i.e., consistently in the top 15% of transcripts) in M. tuberculosis, 5 that were highly expressed in M. bovis, and 11 that were highly expressed in both species. Of these 21 candidates, 4 had been tested previously and 3 were rejected as being too long for peptide-based assays. This left a total of 14 candidates that were screened using 20-mer overlapping peptides (Table 1).
TABLE 2.
Candidate antigensa
| M. tuberculosis H37Rv designation | M. bovis designation | % Amino acid sequence identity to M. tuberculosis H37Rv
|
High-expression conditionsb | Functionc | |||
|---|---|---|---|---|---|---|---|
| M. tuberculosis | M. bovis | M. avium | M. bovis BCG Pasteur | ||||
| Rv1211 | Mb1243 | 100 | 100 | 70 | 100 | Mtb | CHP |
| Rv1222 | Mb1254 | 100 | 100 | 23 | 100 | Mb | CHP |
| Rv1398c | Mb1433c | 100 | 100 | 100 | Mtb+Mb | CHP | |
| Rv2081c | Mb2107c | 100 | 100 | 13 | 74 | Mb | Possible TP |
| Rv2876 | Mb2901 | 100 | 99 | 6 | 98 | Mb | Possible conserved TP |
| Rv3271c | Mb3299c | 100 | 100 | 100 | Mtb | Probable conserved IMP | |
| Rv3407 | Mb3441 | 100 | 100 | 100 | Mtb | CHP | |
| Rv3477 | Mb3504 | 100 | 98 | 47 | 99 | Mtb+Mb | PE family protein (PE31) |
| Rv3613c | Mb3643c | 100 | 100 | 100 | Mtb | HP | |
| Rv3614c | Mb3644c | 100 | 100 | 100 | Mtb+Mb | CHP | |
| Rv3615c | Mb3645c | 100 | 100 | 100 | Mtb+Mb | CHP | |
| Rv3633 | Mb3657 | 100 | 100 | 28 | 100 | Mb | CHP |
| Rv3750c | Mb3776c | 100 | 100 | 100 | Mtb | Possible excisionase | |
| Rv3866 | Mb3896 | 100 | 100 | 13 | 100 | Mb | CHP |
The 14 candidates were screened for stimulation of an IFN-γ response in M. bovis-infected cattle. Both the M. tuberculosis H37Rv and M. bovis AF2122/97 designations are indicated. The levels of amino acid homology of the M. tuberculosis protein to homologues in M. bovis and seven closely related species are indicated.
The antigens were expressed in either four M. tuberculosis conditions (Mtb), two M. bovis conditions (Mb), or all six conditions (Mtb+Mb).
CHP, conserved hypothetical protein; HP, hypothetical protein; IMP, integral membrane protein; TP, transmembrane protein.
TABLE 1.
Antigens of the mycobacterial abundant invariomea
| Rv no. | Designation | Avg mRNA concn (ppm) | SD (ppm) | Reference |
|---|---|---|---|---|
| Rv0288 | CFP-7 | 781 | 286 | 23 |
| Rv0440 | GROEL-2 | 4,438 | 2,385 | 21 |
| Rv1174c | MPT8.4 | 1,165 | 424 | 6 |
| Rv1886c | FBPB/AG85B | 1,464 | 1,168 | 12 |
| Rv1987 | Rv1987 | 495 | 136 | 4 |
| Rv1980c | MPT64 | 1,316 | 629 | 11 |
| Rv3418c | GROES | 5,189 | 2,593 | 2 |
| Rv3616c | Rv3616c | 2,619 | 1,457 | 15 |
| Rv3874 | CFP-10 | 5,414 | 3,950 | 24 |
| Rv3875 | ESAT-6 | 2,472 | 1,229 | 3 |
mRNA levels are expressed in parts per million and are averages of the expression levels for six growth conditions for both M. tuberculosis and M. bovis. For comparison, for M. tuberculosis growing aerobically in chemostats the expression levels ranged from 17 to 13,634 ppm, with a median of 133 ppm; the 85th percentile boundary in this data set was 359 ppm.
Cattle.
Ten uninfected control animals were obtained from herds in four yearly testing parishes with no history of BTB breakdown in the past 4 years, and they were tested for the absence of an in vitro gamma interferon (IFN-γ) response to avian tuberculin PPD (PPD-A) and bovine tuberculin PPD (PPD-B). A further 20 animals from similar BTB-free herds were vaccinated around 6 months prior to sampling with 106 CFU of BCG Danish strain 1331 (Statens Serum Institut, Copenhagen, Denmark) according to the manufacturer's instructions (reconstituted in Sautons medium, 1 ml injected subcutaneously). All BCG-vaccinated animals exhibited strong in vitro IFN-γ responses to PPD-B but not ESAT-6 or CFP-10.
Blood samples were also obtained from 30 naturally infected, tuberculin skin test-positive reactors in herds known to have BTB. All animals were additionally screened for an in vitro IFN-γ response to PPD-B, and the presence or absence of a response to ESAT-6 and CFP-10 was recorded. These animals were housed at the Veterinary Laboratories Agency at the time of blood sampling. Infection was confirmed by necropsy and/or M. bovis culture.
All procedures involving animals were carried out under a project license granted by the Great Britain Home Office under Animals (Scientific Procedures) Act 1984. The project was approved by the local Veterinary Laboratories Agency Animal Ethics Committee prior to submission to the Home Office.
Production and preparation of antigens and peptides.
PPD-B and PPD-A were supplied by the Tuberculin Production Unit at the Veterinary Laboratories Agency, Weybridge, Surrey, United Kingdom, and were used to stimulate whole blood at a concentration of 10 μg ml−1. Staphylococcal enterotoxin B was included as a positive control at a concentration of 1 μg ml−1.
Peptides representing the candidates used were pin synthesized as 20-mers spanning the length of all 14 proteins, with each peptide overlapping its neighbor by 12 amino acid residues (Pepscan, Lelystad, The Netherlands) (for peptide sequences, see Table S1 in the supplemental material). These peptides were dissolved in Hanks balanced salt solution (Gibco) and 20% dimethyl sulfoxide to obtain a concentration of 5 mg ml−1 and were grouped according to gene into 26 pools of 8 to 12 peptides; some genes were represented in more than one pool. The pools were used to stimulate whole blood at a total peptide final concentration of 10 μg ml−1. Peptides from the ESAT-6, CFP-10, and Rv3615c proteins were synthesized by conventional solid-phase synthesis technology, the quality was assessed, and the peptides were formulated to obtain peptide cocktails as previously described (25).
IFN-γ ELISA.
Incubation of 250-μl whole-blood aliquots with antigen (as described above) was performed in 96-well plates. Plasma supernatants were harvested after 24 h of incubation at 37°C in the presence of 5% CO2 in a humidified incubator. The IFN-γ concentration was determined using a Bovigam enzyme-linked immunosorbent assay (ELISA) kit (Prionics AG, Switzerland). A result was considered positive if the optical density at 450 nm (OD450) with antigens minus the OD450 without antigens was ≥0.1. For comparative analysis of PPD-B and PPD-A responses, a result was considered positive if the PPD-B OD450 minus the PPD-A OD450 was ≥0.1 and the PPD-B OD450 minus the unstimulated OD450 was ≥0.1.
Ex vivo IFN-γ enzyme-linked immunospot (ELISPOT) assay.
Peripheral blood mononuclear cells (PBMC) were isolated from heparinized blood taken from three cattle which had previously exhibited an in vitro response to the Rv3615c peptide pool. Separation was performed using Histopaque 1077 (Sigma) gradient centrifugation, and the cells were resuspended in RPMI 1640 tissue culture medium containing 25 mM HEPES (Gibco), 10% fetal calf serum, 1% nonessential amino acids, 5 × 10⁻⁵ M β-mercaptoethanol, 100 U/ml penicillin, and 100 μg ml−1 streptomycin. Cells were enumerated, and suspensions containing 2 × 10⁶ cells ml−1 were prepared.
IFN-γ production by PBMC was analyzed using a Mabtech bovine IFN-γ ELISPOT kit (Mabtech, Stockholm, Sweden). The ELISPOT plates (Multiscreen HTS-IP; Millipore) were coated at 4°C overnight with a bovine IFN-γ-specific monoclonal antibody, after which the wells were blocked for 2 h using 10% fetal calf serum in RPMI 1640. The primary antibody and blocking buffer were removed from the plates, and PBMC suspended in tissue culture medium were then added (2 × 10⁵ cells well−1) and incubated overnight at 37°C with 5% CO2 in the presence of the individual antigens. Stimulation was performed using the peptides at a concentration of 5 μg ml−1 or a pool of all 12 peptides containing 5 μg ml−1 of each peptide. The wells were washed using phosphate-buffered saline plus 0.05% Tween 80. A secondary biotinylated antibody was used at a concentration of 0.025 μg ml−1, and this was followed by incubation with streptavidin-linked horseradish peroxidase. After a further wash, the spot-forming cells were visualized using an AEC chromogen kit (Sigma). Spots were counted using an AID ELISPOT reader and EliSpot 4.0 software (Autoimmun Diagnostika, Germany).
Fluorescence-assisted cell sorting (FACS) analysis.
PBMC were isolated from fresh heparinized blood as described above for the ELISPOT assay and enumerated. Then a suspension containing 2 × 10⁶ cells ml−1 was prepared and incubated overnight in a 24-well plate (Nunc) at 37°C in the presence of 5% CO2 with either RPMI medium (unstimulated control), PPD-B, pokeweed mitogen (positive control), individual peptides at a concentration of 5 μg ml−1, or a pool of all 12 peptides at a concentration of 5 μg ml−1. After incubation, brefeldin A (Sigma) was added at a concentration of 10 μg ml−1, and the preparation was incubated for a further 4 h. The plate was centrifuged at 300 × g for 5 min, and the cells were resuspended in 250 μl (final volume) for transfer to a 96-well plate. Surface antibody staining was performed using Alexa Fluor 647-conjugated anti-CD4 (code MCA1653A627; Serotec) and fluorescein isothiocyanate-conjugated anti-CD8 (code MCA837F; Serotec) antibodies. Differential “live/dead” staining was performed using Vivid (Invitrogen). After incubation for 15 min at 4°C, cells were washed and centrifuged before they were permeabilized using Cytofix/Cytoperm (BD) at 4°C for 20 min and stored overnight at 4°C. Intracellular staining for IFN-γ was performed using R-phycoerythrin-conjugated anti-IFN-γ (Serotec) for 30 min at 4°C. Cells were finally suspended in 600 μl of buffer and analyzed using a Cyan ADP instrument and the Summit 4.3 software (Dako, Denmark).
Statistical analysis.
The statistical software package GraphPad InStat v3 was used for statistical analysis of IFN-γ responses and responder frequencies. The Rv3615c IFN-γ responses in naïve, infected, and vaccinated cattle were compared using the nonparametric Wilcoxon rank sum test, with all of the P values corrected for multiple testing using the Bonferroni method. The responder frequencies for Rv3615c in infected cattle were compared to those in naïve and vaccinated cattle using Fisher's exact test. Spearman's rank correlation and linear regression analyses were performed using standard functions in the R statistical environment (http://cran.r-project.org/). Power analyses were performed using GraphPad StatMate 2.00 (GraphPad, San Diego, CA).
RESULTS
We previously showed that 133 genes were consistently highly expressed in both M. tuberculosis and M. bovis under the various growth conditions that were available to us (22). The products of 10 of these genes have been previously described as strong antigens (Table 1). We therefore hypothesized that the products of other genes in this population might be strong antigens and that an approach incorporating quantified levels of expression could supplement our existing sequence-based methods for identifying novel antigens.
Initially, we focused on three populations of candidates: the 133 genes that were consistently highly expressed in both M. tuberculosis and M. bovis; the genes highly expressed in just M. tuberculosis (178 unique genes); and the genes highly expressed in just M. bovis (386 unique genes). We screened these populations for high levels of homology (>98%) between M. tuberculosis and M. bovis orthologs. With two exceptions, we also selected candidates with less than 30% identity to M. avium genes (Table 2). From the resulting group we also removed any candidates that had been tested elsewhere, and we were left with 14 candidates which we used for immunological analysis. Little information about the function of the 14 candidates is available, and we were unable to obtain any further functional insights using either BLASTP or the HMM profile tool SHARKhunt (16). Nine of the proteins are annotated as conserved hypothetical proteins, three are annotated as putative membrane proteins, one is annotated as an excisionase, and one is annotated as a member of the PE family of proteins (Table 2).
Overlapping 20-mer peptides were synthesized for the complete amino acid sequence of each protein and were grouped into 26 pools of 8 to 12 peptides; some candidates were represented by more than one pool. These pools were then screened for the ability to stimulate an IFN-γ response in vitro using whole blood from 30 M. bovis-infected cattle (bovine tuberculin [PPD-B] positive) and 10 M. bovis-naïve cattle (PPD-B negative). All M. bovis-infected cattle had positive responses to PPD-B; in addition, 23 of the 30 infected cattle responded to an ESAT-6/CFP-10 peptide cocktail (25). The proportion of infected cattle responding to ESAT-6/CFP-10 (76.6%) was similar to the proportion which was observed previously in field studies in Great Britain using naturally infected cattle (77.9%) (25).
The responder frequencies for all 14 candidate antigens in the M. bovis-infected and M. bovis-naïve cattle are shown in Fig. 1. Seven of the candidates failed to stimulate any significant IFN-γ response in either the M. bovis-infected or naïve cattle. Four of the candidate antigens stimulated a positive response in a proportion of the M. bovis-naïve animals, suggesting that there was cross-reactivity with other environmental species.
FIG. 1.

Fourteen candidate mycobacterial antigens were identified based on quantified expression data and were screened to determine IFN-γ responses in 30 M. bovis-infected cattle and 10 naïve cattle. The responder frequencies, expressed as percentages, for each candidate antigen for all M. bovis-infected and naïve cattle are shown. Both the M. tuberculosis and M. bovis candidate accession numbers are shown as we selected for clear orthologs with >98% similarity at the amino acid level.
The three remaining candidates (Rv3615c, Rv3750c, and Rv3721c) were each recognized in 10% or more of the infected cattle tested but in none of the naïve animals. However, neither Rv3750c nor Rv3721c was recognized by a significantly large number of the animals or in animals identified as not recognizing ESAT-6 or CFP-10, so we focused on Rv3615c, to which 37% (11 of 30) of the M. bovis-infected animals tested mounted a positive IFN-γ response, which is a statistically significant proportion of the animals compared to the naïve control animals (P < 0.05, Fisher's exact test; power, >80%) or the BCG-vaccinated animals (P < 0.005, Fisher's exact test; power, >90%) (see below). In addition to the significance of the proportion of animals responding to Rv3615c, the level of IFN-γ that the animals produced was significantly different from the level produced by the uninfected control animals, none of which responded to this antigen (P < 0.01) (Fig. 2A).
FIG. 2.

Rv3615c was identified as the antigen with the greatest responder frequency in M. bovis-infected cattle in our initial selection of highly expressed candidates. In this screen IFN-γ levels were measured using the Bovigam ELISA, and the level of IFN-γ production upon stimulation with Rv3615c (A) or PPD-B (B) for each animal in each group is shown. Symbols: •, uninfected cattle; ▴, M. bovis-infected cattle; ▪, BCG-vaccinated cattle; ▾, M. bovis-infected ESAT-6/CFP-10-negative (ESAT-6/CFP-10 -ve) cattle. The data are expressed as background-subtracted OD450 (Δ OD450), and the dashed lines indicate the cutoff for positivity. Significance testing was performed using the nonparametric Wilcoxon rank sum test adjusted for multiple comparisons.
We assessed the overlap in the responses in individual infected animals between Rv3615c and ESAT-6/CFP-10. In particular, we observed that there were responses to the Rv3615c peptide pool in M. bovis-infected cattle that did not respond to ESAT-6 or CFP-10 (4 of 7 cattle [57%]). This raises the possibility that this protein could be used to increase the sensitivity of a previously developed ESAT-6/CFP-10-based diagnostic test (25), as long as the antigen does not cross-react with BCG-vaccinated individuals. To assess Rv3615c's potential as a differential antigen for differential diagnosis of BCG-vaccinated and M. bovis-infected animals, we screened the peptide pool using 20 BCG-vaccinated cattle. In contrast to M. bovis-infected animals, none of the BCG-vaccinated cattle generated a significant IFN-γ response to Rv3615c (Fig. 2A) (P < 0.0001; power, >60%). However, 80% (16 of 20) of the BCG-vaccinated animals exhibited a significant IFN-γ response to PPD-B compared to the naïve animals (Fig. 2B). This occurred despite the fact that M. bovis BCG possesses an identical copy of the gene, indicating that antigenic diversity can occur independent of sequence diversity.
To confirm the presence and location of the T-cell epitopes within Rv3615c, we determined the response to constituent peptides from the Rv3615c pool using an IFN-γ ELISPOT assay with PBMC isolated from M. bovis-infected cattle. Peptides 6 to 11 were recognized in at least two of the three cattle tested, and peptides 8 to 11 (spanning amino acids 57 to 103) from the C terminus of the protein were the most antigenic and were recognized by all three animals tested. Peptide 11 (RIAAKIYSEADEAWRKAIDG), in particular, stimulated a response in all three animals, with an average of 509 spot-forming units (SFU) per 106 PBMC (standard deviation, 185.3 SFU per 106 PBMC), which is comparable to the results for the pool as a whole (414 SFU per 106 PBMC; standard deviation, 135.6 SFU per 106 PBMC) (Fig. 3).
FIG. 3.

To confirm the presence and location of the T-cell epitopes in Rv3615c, the responses of constituent peptides from the Rv3615c pool were determined using an IFN-γ ELISPOT assay with PBMC isolated from M. bovis-infected cattle. The results are expressed in SFU per 106 PBMC for each animal. The cattle used were animals 3420, 3450, and 3606.
To further characterize the specific lymphocyte response to Rv3615c, we performed a FACS analysis with PBMC isolated from the same M. bovis-infected cattle that were used for the ELISPOT analysis. Lymphocytes were analyzed for intracellular IFN-γ production and the presence of CD4 and CD8 cell differentiation markers. We found that, mirroring the ELISPOT data, peptides 1 to 6 stimulated little IFN-γ production. Markedly higher levels of IFN-γ were observed for the cells stimulated with peptides 7, 8, 10, and 11 (Fig. 4). Interestingly, no IFN-γ response to peptide 9 was observed despite the fact that a response was recorded in the ELISPOT assay. Analysis of the cells stimulated with peptide 9 showed that the majority (>64%) of the cells in the sample were dead, suggesting that the peptide itself caused IFN-γ-induced apoptosis, which would be in line with the positive responses seen in the ELISPOT assay.
FIG. 4.

FACS analysis with PBMC isolated from three M. bovis-infected cattle performed after stimulation with RPMI medium, each individual Rv3615c peptide (5 μg ml−1), or the Rv3615c peptide pool (5 μg ml−1). Secretion of IFN-γ was stopped by addition of brefeldin A (10 μg ml−1). Lymphocytes were analyzed for intracellular IFN-γ production and the presence of CD4 and CD8 T-cell subset markers using anti-CD4-Alexa Fluor 647, anti-CD8-fluorescein isothiocyanate, and anti-IFN-γ-phycoerythrin conjugated antibodies. A live/dead differential stain analysis was performed using ViVid and a Dake Cyan ADP. The results are expressed as percentages of the lymphocyte population staining as CD4+ IFN-γ+ (bars above the x axis) or CD8+ IFN-γ+ (bars below the x axis) for each animal (animals 3420, 3450, and 3606).
The results shown in Fig. 4 demonstrate that, in addition to being recognized more frequently by CD4+ T cells, peptides 7, 8, 10, and 11 were also recognized by CD8+ T cells, suggesting that the response to these peptides is major histocompatibility complex class I and II restricted. As shown by the ELISPOT data, peptide 11 produced the strongest response; 0.457% (standard error of the mean [SEM], 0.247%) of the population was CD4+ IFN-γ+ and 0.253% (SEM, 0.045%) was CD8+ IFN-γ+ after stimulation. Again, these results are comparable to the data for the Rv3615c pool as a whole, with which 0.627% (SEM, 0.22%) of the population was CD4+ IFN-γ+ and 0.367% (SEM, 0.044%) of the population was CD8+ IFN-γ+.
As this work demonstrated, it is possible to identify promising diagnostic antigens by screening highly expressed genes. It would be beneficial, therefore, to understand the contribution that the mRNA level makes to a protein's antigenicity. Such information would be useful both for evaluating the rationale behind our decision to explore mRNA levels and antigenicity and for allowing logical design of future antigen prediction algorithms that might be improved by the addition of expression data. To assess this, we explored the correlation between mRNA levels and antigenicity further by including the responder frequencies of an additional 80 mycobacterial proteins, along with the 14 screened here (4, 8, 15; M. Vordermeier, unpublished data). These additional antigens had been screened previously using either 22 (4), 14 (8), 21 (15), or 30 M. bovis-infected cattle (M. Vordermeier, unpublished data). Eighty-two of the 94 proteins had been observed to have some antigenicity (range, 2 to 86%; average, 32%), so they represented a broad range of antigenic potential. Correlation of the responder frequencies for these 82 antigens with their mRNA levels in both M. tuberculosis and M. bovis growing in chemostats revealed a limited but significant relationship in both organisms (Spearman's rank correlation coefficients, 0.35 [P < 0.005] and 0.3 [P < 0.005], respectively) (Fig. 5). Using a model of linear regression, we estimated that 14% (r2 = 0.14) of the variation in the level of antigenicity can be attributed to the mRNA level in both organisms.
FIG. 5.
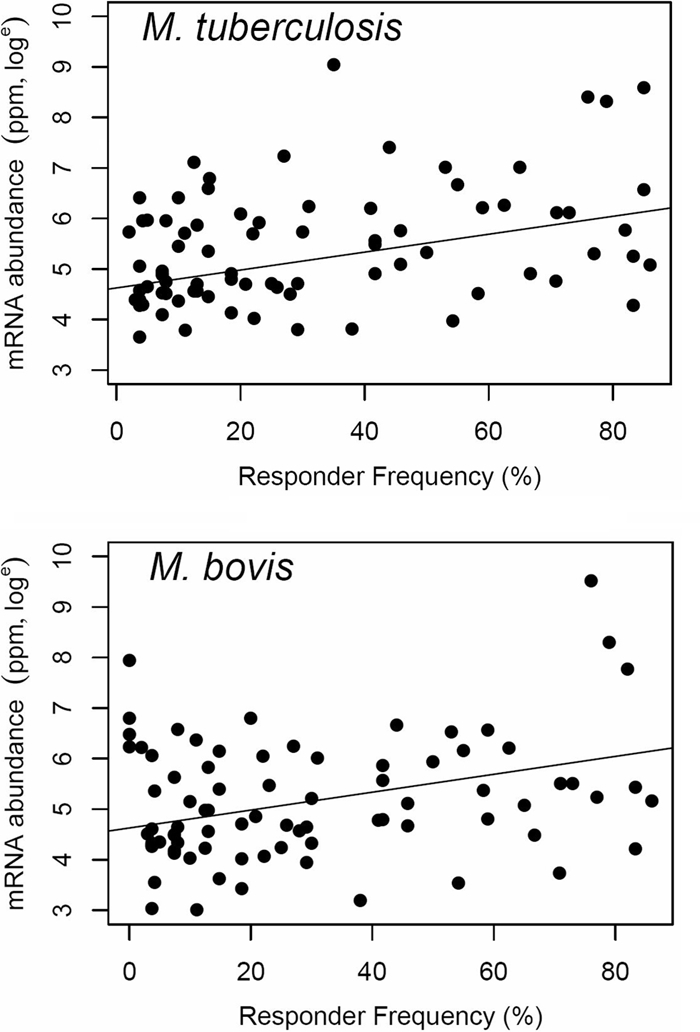
After identification of a potent antigen by screening the products of highly expressed genes, the contribution that mRNA levels make to antigenicity was examined, as this approach could be used to improve mechanisms of antigen prediction. Correlation of the responder frequencies for 82 antigens with their mRNA levels in both M. tuberculosis and M. bovis revealed a slight but significant relationship between expression level and antigenicity (Spearman's rank correlation coefficients, 0.35 [P < 0.005] and 0.3 [P < 0.005], respectively). In addition, linear regression analysis showed that 14% of a protein's antigenic potential is determined by the expression level of its gene. Using this information in tandem with other approaches should improve our ability to detect antigenic proteins.
DISCUSSION
We show here that the responder frequency for Rv3615c in M. bovis-infected cattle was high and significant but that Rv3615c was not recognized by M. bovis-naïve or BCG-vaccinated cattle. Our observation that Rv3615c is not recognized in BCG-vaccinated animals is significant as we used the BCG Danish strain, which is the only vaccine strain licensed in Europe. We further determined that peptides spanning the C terminus of the protein contain the dominant antigenic epitopes. Despite the fact that the cattle sampled for epitope-mapping studies were members of different breeds (a male Simmental cross, a male Belgium Blue cross, and a female Holstein-Friesian), recognition of peptides 6 to 11 was consistent in all of the animals, suggesting that the epitopes are genuinely promiscuous. Using FACS analysis, we also determined that the response is mediated by both CD4+ and CD8+ T cells. However, it is not possible to determine from our data whether the observed CD8+ response relies on the help conferred by CD4+ cells or if it is due to major histocompatibility complex class I-restricted epitopes within the protein. It has been shown previously that peptides and peptide cocktails are useful in the diagnosis of tuberculosis infection (8, 25, 26). Elucidation of the promiscuous epitopes of antigenic proteins is therefore relevant to the development of more specific and economically viable diagnostic peptide cocktails.
The Rv3615c gene is located in an operon containing five genes (Rv3616c to Rv3612c). Four of these genes are present in the population of genes that are highly expressed in both M. tuberculosis and M. bovis. The product of one of these genes, Rv3616c, has been shown to be a dominant mycobacterial antigen elsewhere (15). Our screen also included Rv3614c and Rv3613c, and in contrast to the other two molecules, neither of these was antigenic. Rv3616c was recognized more frequently than Rv3615c in M. bovis-infected cattle (84.6% versus 37%), but Rv3616c was also recognized by 40% of BCG vaccinates (15). This is in contrast to Rv3615c, which did not cross-react with BCG-vaccinated cattle. Given that both the Rv3616c and Rv3615c genes are completely conserved in the genome of M. bovis BCG and that each protein is identical in M. tuberculosis complex organisms since no amino acid sequence differences have been found in any of the species or strains sequenced thus far (including M. tuberculosis H37Rv, H37Ra, and CDC1551, M. bovis AF2122/97, and M. bovis BCG Pasteur [S. Gordon, personal communication]), this difference is surprising. The products of these operonic genes have been identified as components of a mycobacterial secretion system (the SNM system) that exports both ESAT-6 and CFP-10 (9, 14). While the Rv3616c protein is secreted in a mutually dependent manner with ESAT-6 and CFP-10 (9), the Rv3615c protein appears to interact with other proteins of the secretion system (14) and may therefore remain within the bacterial cell. It is therefore of considerable interest that the nonresponsiveness of BCG-vaccinated individuals to Rv3615c is not mediated by sequence diversity but is due to an apparent loss of function associated with deletion of the RD1 region.
An ESAT-6/CFP-10 peptide cocktail has been developed as a diagnostic reagent that differentiates infected and vaccinated cattle and is an alternative to tuberculin (25). The test used is reported to have a sensitivity of approximately 80% in infected cattle (25), and a similar proportion of our cattle have responded to this test. Of the animals that did not respond to the ESAT-6/CFP-10 peptide cocktail, 57% (4 of 7 animals) did mount a response to Rv3615c. Therefore, use of the Rv3615c epitope in combination with the ESAT-6/CFP-10 diagnostic cocktail has the potential to significantly increase diagnostic sensitivity (theoretically from 77.9 to 91%) without reducing the specificity in BCG-vaccinated populations. Confirmation of this in a larger field trial is required, and our current predictions suggest that in such a study the sample sizes would need to be between 100 to 150 to achieve a statistical power of 80 to 90% in order to validate that addition of Rv3615c to the ESAT-6/CFP-10 cocktail results in an increase in the sensitivity from 77.9 to 91%. We note that although we tested cattle here, Rv3615c might also have utility in diagnosis of tuberculosis in human populations, for which similar ESAT-6/CFP-10-based tests are being developed (10, 19).
There have been many strategies for identification of mycobacterial immunogens using postgenomic methods, including T-cell epitope prediction and genomic comparisons to identify pathogen-specific open reading frames (4, 5, 8, 17, 26). We have used an alternative approach and included quantified transcriptomic information as well. Using the level of gene expression as a key factor in the selection criteria, we can identify promising diagnostic antigens, as this work demonstrates. This finding has implications for the identification of antigens in all bacterial pathogens. To examine the relationship between the level of expression and antigenicity in more detail so that future antigen prediction techniques can exploit this finding, we compared the responder frequencies of 82 proteins with their levels of expression. Based on this sample, we were able to identify a modest correlation between gene expression and antigenicity, and using a model of linear regression, we estimated that the level of expression contributes 14% of the variation in responder frequencies. Therefore, there are obviously further characteristics, such as cellular location, that contribute significantly to the antigenic potential of a particular protein. Our data for the proteins assayed here were skewed in that major antigens present in our expression datasets were excluded on the basis that they had been characterized previously. Had we not done this, the analysis might have appeared to be even more sensitive. We suggest that using quantified transcriptomic information in tandem with more traditional genomic approaches could greatly assist in the identification of key antigenic components and the development of diagnostic reagents or subunit vaccines.
Supplementary Material
Acknowledgments
This study was funded by the Department for Environment, Food and Rural Affairs (Defra), United Kingdom. B.S. was funded by a Royal Veterinary College scholarship.
We express our sincere appreciation to the staff of the Animal Services Unit at the Veterinary Laboratories Agency, in particular Derek Clifford, for their dedication to the welfare of test animals. We also thank Lorenz Wernisch, Sharon Kendall, Mike Withers, Rosangela Frita, Annemieke ten Bokum, and Bob Cox for helpful discussions during preparation of the manuscript.
Editor: J. L. Flynn
Footnotes
Published ahead of print on 2 June 2008.
Supplemental material for this article may be found at http://iai.asm.org/.
REFERENCES
- 1.Bacon, J., B. W. James, L. Wernisch, A. Williams, K. A. Morley, G. J. Hatch, J. A. Mangan, J. Hinds, N. G. Stoker, P. D. Butcher, and P. D. Marsh. 2004. The influence of reduced oxygen availability on pathogenicity and gene expression in Mycobacterium tuberculosis. Tuberculosis 84205-217. [DOI] [PubMed] [Google Scholar]
- 2.Baird, P. N., L. M. C. Hall, and A. R. M. Coates. 1988. A major antigen from Mycobacterium tuberculosis which is homologous to the heat shock proteins groES from E. coli and the htpA gene product of Coxiella burneti. Nucleic Acids Res. 169047. [DOI] [PMC free article] [PubMed] [Google Scholar]
- 3.Berthet, F., P. Rasmussen, I. Rosenkrands, P. Andersen, and B. Gicquel. 1998. A Mycobacterium tuberculosis operon encoding ESAT-6 and a novel low-molecular-mass culture filtrate protein (CFP-10). Microbiology 1443195-3203. [DOI] [PubMed] [Google Scholar]
- 4.Cockle, P. J., S. V. Gordon, A. Lalvani, B. M. Buddle, R. G. Hewinson, and H. M. Vordermeier. 2002. Identification of novel Mycobacterium tuberculosis antigens with potential as diagnostic reagents or subunit vaccine candidates by comparative genomics. Infect. Immun. 706996-7003. [DOI] [PMC free article] [PubMed] [Google Scholar]
- 5.Cole, S. T. 2002. Comparative mycobacterial genomics as a tool for drug target and antigen discovery. Eur. Respir. J. 2078S-86. [DOI] [PubMed] [Google Scholar]
- 6.Coler, R. N., Y. A. W. Skeiky, T. Vedvick, T. Bement, P. Ovendale, A. Campos-Neto, M. R. Alderson, and S. G. Reed. 1998. Molecular cloning and immunologic reactivity of a novel low molecular mass antigen of Mycobacterium tuberculosis. J. Immunol. 1612356-2364. [PubMed] [Google Scholar]
- 7.Corbett, E. L., C. J. Watt, N. Walker, D. Maher, B. G. Williams, M. C. Raviglione, and C. Dye. 2003. The growing burden of tuberculosis: global trends and interactions with the HIV epidemic. Arch. Intern. Med. 1631009-1021. [DOI] [PubMed] [Google Scholar]
- 8.Ewer, K., P. Cockle, S. Gordon, H. Mansoor, M. Govaerts, K. Walravens, S. Marche, G. Hewinson, and M. Vordermeier. 2006. Antigen mining with iterative genome screens identifies novel diagnostics for the Mycobacterium tuberculosis complex. Clin. Vaccine Immunol. 1390-97. [DOI] [PMC free article] [PubMed] [Google Scholar]
- 9.Fortune, S. M., A. Jaeger, D. A. Sarracino, M. R. Chase, C. M. Sassetti, D. R. Sherman, B. R. Bloom, and E. J. Rubin. 2005. Mutually dependent secretion of proteins required for mycobacterial virulence. Proc. Natl. Acad. Sci. USA 10210676-10681. [DOI] [PMC free article] [PubMed] [Google Scholar]
- 10.Fox, A., D. J. Jeffries, P. C. Hill, A. S. Hammond, M. D. Lugos, D. Jackson-Sillah, S. A. Donkor, P. K. Owiafe, K. P. W. J. McAdam, and R. H. Brookes. 2007. ESAT-6 and CFP-10 can be combined to reduce the cost of testing for Mycobacterium tuberculosis infection, but CFP-10 responses associate with active disease. Trans. R. Soc. Trop. Med. Hyg. 101691-698. [DOI] [PubMed] [Google Scholar]
- 11.Harboe, M., S. Nagai, M. E. Patarroyo, M. L. Torres, C. Ramirez, and N. Cruz. 1986. Properties of proteins MPB64, MPB70, and MPB80 of Mycobacterium bovis BCG. Infect. Immun. 52293-302. [DOI] [PMC free article] [PubMed] [Google Scholar]
- 12.Harth, G., B. Lee, J. Wang, D. Clemens, and M. Horwitz. 1996. Novel insights into the genetics, biochemistry, and immunocytochemistry of the 30-kilodalton major extracellular protein of Mycobacterium tuberculosis. Infect. Immun. 643038-3047. (Erratum, 65:852, 1997.) [DOI] [PMC free article] [PubMed] [Google Scholar]
- 13.Krebs, J. 1997. Bovine tuberculosis in cattle and badgers. Ministry of Agriculture, Fisheries and Food Publications, London, United Kingdom.
- 14.Macgurn, J. A., S. Raghavan, S. A. Stanley, and J. S. Cox. 2005. A non-RD1 gene cluster is required for Snm secretion in Mycobacterium tuberculosis. Mol. Microbiol. 571653-1663. [DOI] [PubMed] [Google Scholar]
- 15.Mustafa, A. S., Y. A. Skeiky, R. Al-Attiyah, M. R. Alderson, R. G. Hewinson, and H. M. Vordermeier. 2006. Immunogenicity of Mycobacterium tuberculosis antigens in Mycobacterium bovis BCG-vaccinated and M. bovis-infected cattle. Infect. Immun. 744566-4572. [DOI] [PMC free article] [PubMed] [Google Scholar]
- 16.Pinney, J. W., M. W. Shirley, G. A. McConkey, and D. R. Westhead. 2005. metaSHARK: software for automated metabolic network prediction from DNA sequence and its application to the genomes of Plasmodium falciparum and Eimeria tenella. Nucleic Acids Res. 331399-1409. [DOI] [PMC free article] [PubMed] [Google Scholar]
- 17.Pizza, M., V. Scarlato, V. Masignani, M. M. Giuliani, B. Aricò, M. Comanducci, G. T. Jennings, L. Baldi, E. Bartolini, B. Capecchi, C. L. Galeotti, E. Luzzi, R. Manetti, E. Marchetti, M. Mora, S. Nuti, G. Ratti, L. Santini, S. Savino, M. Scarselli, E. Storni, P. Zuo, M. Broeker, E. Hundt, B. Knapp, E. Blair, T. Mason, H. E. Tettelin, D. W. Hood, A. C. Jeffries, N. J. Saunders, D. M. Granoff, J. C. Venter, E. R. Moxon, G. Grandi, and R. Rappuoli. 2000. Identification of vaccine candidates against serogroup B meningococcus by whole-genome sequencing. Science 2871816-1820. [DOI] [PubMed] [Google Scholar]
- 18.Rogerson, B. J., Y.-J. Jung, R. LaCourse, L. Ryan, N. Enright, and R. J. North. 2006. Expression levels of Mycobacterium tuberculosis antigen-encoding genes versus production levels of antigen-specific T cells during stationary level lung infection in mice. Immunology 118195-201. [DOI] [PMC free article] [PubMed] [Google Scholar]
- 19.Sellam, J., H. Hamdi, C. Roy, G. Baron, M. Lemann, X. Puechal, M. Breban, F. Berenbaum, M. Humbert, K. Weldingh, D. Salmon, P. Ravaud, D. Emilie, and X. Mariette. 2007. Comparison of in vitro-specific blood tests with tuberculin skin test for diagnosis of latent tuberculosis before anti-TNF therapy. Ann. Rheum. Dis. 661610-1615. [DOI] [PMC free article] [PubMed] [Google Scholar]
- 20.Shi, L., R. North, and M. L. Gennaro. 2004. Effect of growth state on transcription levels of genes encoding major secreted antigens of Mycobacterium tuberculosis in the mouse lung. Infect. Immun. 722420-2424. [DOI] [PMC free article] [PubMed] [Google Scholar]
- 21.Shinnick, T. M. 1987. The 65-kilodalton antigen of Mycobacterium tuberculosis. J. Bacteriol. 1691080-1088. [DOI] [PMC free article] [PubMed] [Google Scholar]
- 22.Sidders, B., M. Withers, S. Kendall, J. Bacon, S. Waddell, J. Hinds, P. Golby, F. Movahedzadeh, R. Cox, R. Frita, A. ten Bokum, L. Wernisch, and N. Stoker. 2007. Quantification of global transcription patterns in prokaryotes using spotted microarrays. Genome Biol. 8R265. [DOI] [PMC free article] [PubMed] [Google Scholar]
- 23.Skjot, R. L. V., I. Brock, S. M. Arend, M. E. Munk, M. Theisen, T. H. M. Ottenhoff, and P. Andersen. 2002. Epitope mapping of the immunodominant antigen TB10.4 and the two homologous proteins TB10.3 and TB12.9, which constitute a subfamily of the esat-6 gene family. Infect. Immun. 705446-5453. [DOI] [PMC free article] [PubMed] [Google Scholar]
- 24.Sorensen, A., S. Nagai, G. Houen, P. Andersen, and A. Andersen. 1995. Purification and characterization of a low-molecular-mass T-cell antigen secreted by Mycobacterium tuberculosis. Infect. Immun. 631710-1717. [DOI] [PMC free article] [PubMed] [Google Scholar]
- 25.Vordermeier, H. M., A. Whelan, P. J. Cockle, L. Farrant, N. Palmer, and R. G. Hewinson. 2001. Use of synthetic peptides derived from the antigens ESAT-6 and CFP-10 for differential diagnosis of bovine tuberculosis in cattle. Clin. Diagn. Lab. Immunol. 8571-578. [DOI] [PMC free article] [PubMed] [Google Scholar]
- 26.Vordermeier, M., A. O. Whelan, and R. G. Hewinson. 2003. Recognition of mycobacterial epitopes by T cells across mammalian species and use of a program that predicts human HLA-DR binding peptides to predict bovine epitopes. Infect. Immun. 711980-1987. [DOI] [PMC free article] [PubMed] [Google Scholar]
Associated Data
This section collects any data citations, data availability statements, or supplementary materials included in this article.