

Abstract
A capillary electrophoretic (CE) method for the analysis of urinary extracts of the local anesthetic, bupivacaine, and its three main metabolites, desbutylbupivacaine, 3’-hydroxybupivacaine, and 4’-hydroxybupivacaine, in rat urine has been developed. The limits of detection were 0.22 μm for desbutylbupivacaine and bupivacaine, 0.15 μm for 3’-hydroxybupivacaine, and 0.16 μm for 4’-hydroxybupivacaine. The linear range was from 0.7 μm to 16.8 μm for all four compounds. Migration time and peak height reproducibilities, and extraction efficiencies were determined for all four compounds. Peak height reproducibilities (n = 5) for the overall method were improved through the use of prilocaine as an internal standard. Peak height reproducibilities were 5.6% RSD for desbutylbupivacaine and bupivacaine, and 9.9% RSD for 3’-hydroxybupivacaine and 4’-hydroxybupivacaine. Migration time reproducibilities (n = 5) were 2.4% for all compounds. Urine samples were collected from rats administered therapeutic doses of bupivacaine and extracted using a solid-phase extraction method (SPE). Separation of bupivacaine and its metabolites was achieved in 15 min.
Keywords: Capillary electrophoresis, Bupivacaine, Bupivacaine metabolites, Drug analysis
1 Introduction
Bupivacaine is an amide-type local anesthetic that has been extensively used in chronic and acute pain management [1]. The metabolism of bupivacaine in a variety of animals has been reported [2-9] The most commonly reported bupivacaine metabolites have been desbutylbupivacaine, 3’- hydroxybupivacaine, and 4’-hydroxybupivacaine [2-9] as shown in Fig. 1, though a number of other metabolites have been reported [2-7]. The development of analytical methods permitting simultaneous determination of bupivacaine and its metabolites is important in understanding its fate and distribution in tissues and biological fluids after therapeutic administration. The analysis of bupivacaine and its metabolites in biological tissues and fluids has been performed by thin-layer chromatography (TLC) [2, 3], gas chromatography (GC) [2-8], and high-performance liquid chromatography (HPLC) [9-17]. The earliest approaches to the analysis of bupivacaine and its metabolites made use of TLC and GC methods. The analysis of bupivacaine in rat urine was studied [2] using TLC after liquid-liquid extraction. Further identification of metabolites of bupivacaine in these samples was carried out by extraction of relevant portions of the TLC plate and subsequent GC-MS. The major metabolites described were desbutylbupivacaine and three hydroxy forms of bupivacaine.
Figure 1.
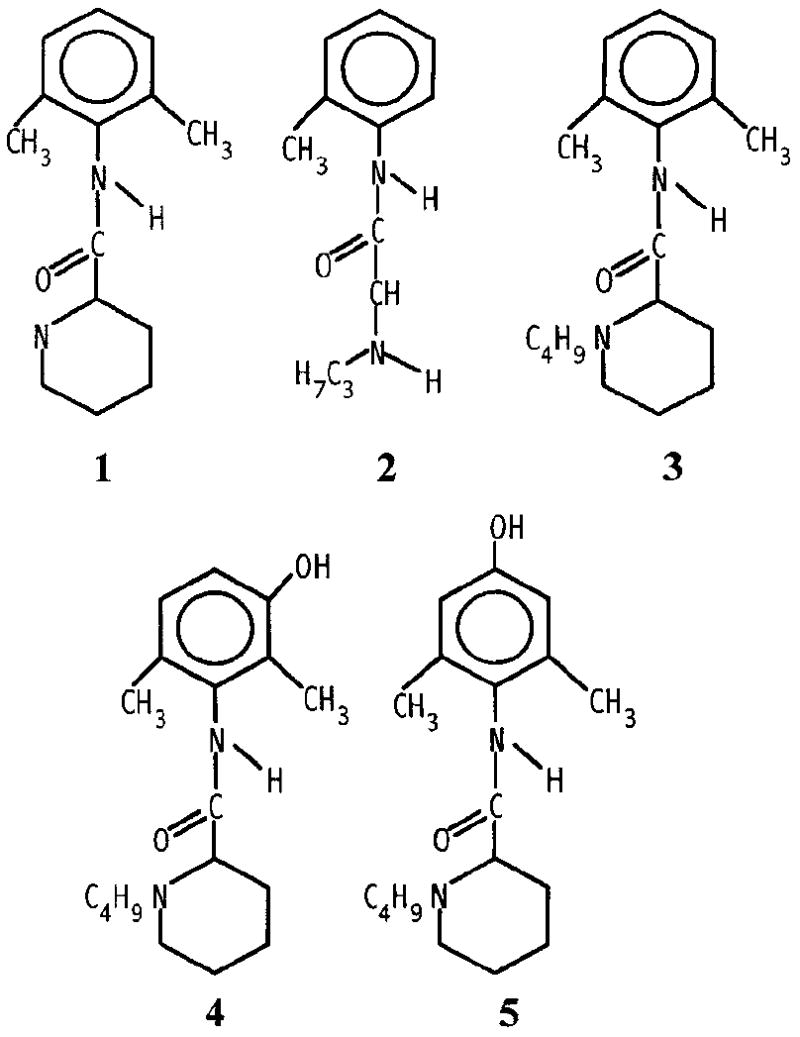
Structures of (1), desbutylbupivacaine, (2) prilocaine, (3) bupivacaine, (4) 3’-hydroxybupivacaine, and (5) 4’-hydroxybupivacaine.
The detection of bupivacaine, 3’-hydroxybupivacaine, and desbutylbupivacaine in rat urine by GC-MS after liquid-liquid extraction has been reported [4]. Using this approach in conjunction with NMR analysis, three further metabolites, N-butyl-pipecolyl-2-amide and two mono-hydroxylated bupivacaine metabolites were identified in the urine samples. Use has been made of a GC-MS method incorporating selected ion monitoring [6] to determine bupivacaine and desbutylbupivacaine in maternal, fetal and analysis neonatal plasma following its administration as an epidural anesthesia for Caesarean section. The majority of analytical methods in recent years for the simultaneous analysis of bupivacaine and its metabolites in biological matrices have made use of HPLC in conjunction with liquid-liquid extraction [10-14], solid-phase extraction (SPE) [15] or column switching [16, 17] schemes. The analysis of bupivacaine, desbutylbupivacaine and 4’-hydroxybupivacaine in human serum, plasma and urine using liquid-liquid extraction and HPLC, has been reported by several authors [13, 14]. Using the chromatographic conditions described, excellent separation of all three compounds was possible. However, no separation or quantitation of 3’-hydroxybupivacaine was reported. Two previous studies on the disposition of bupivacaine and its metabolites have reported levels of 3’- and 4’-hydroxybupivacaine in urine [2, 3]. Both studies utilized radio-labeling and TLC to quantify bupivacaine and its metabolites. Goehl et al. [3], reported percent recoveries of dosed bupivacaine 24 h after injection to be 2.8% for bupivacaine, 2.2% for 3’-hydroxybupivacaine, and 0% for desbutylbupivacaine and 4’-hydroxybupivacaine. Caldwell et al. [2] reported percent recoveries of bupivacaine 24 h after injection to be 1.1% bupivacaine, 0.36% desbutylbupivacaine, 2.97% 3’-hydroxybupivacaine, and 1.87% 4’-hydroxybupivacaine. However, very few details on the separation of bupivacaine and its metabolites were provided in either report.
Capillary electrophoresis (CE) has been used for the analysis of pharmaceutical drugs and their metabolites in a wide range of biological matrices. The separation in CE is based on the charge-to-size characteristics of the analyte of interest rather than partitioning as in liquid chromatography. In addition, the separation efficiency of CE is frequently much higher than for LC. For these reasons, separations not possible by LC may be possible by CE.
The use of capillary electrophoresis for the separation and quantitation of bupivacaine enantiomers in human plasma [18] and therapeutic monitoring of bupivacaine in drain fluid collected from patients after pulmonary surgery [19] has been reported. However, no reported method in the literature clearly describes an analytical procedure for the simultaneous separation and analysis of bupivacaine and its desbutyl, 3’-hydroxy and 4’-hydroxy metabolites in a biological matrix. In this report, the capillary electrophoretic and SPE conditions necessary for the simultaneous analysis of bupivacaine and the aforementioned metabolites in urine from rats administered a therapeutic dose of bupivacaine are described.
2 Materials and methods
2.1 Materials and reagents
Bupivacaine hydrochloride and prilocaine hydrochloride were obtained from Sigma-Aldrich (St. Louis, MO). Desbutylbupivacaine, 3’-hydroxybupivacaine, and 4’- hydroxybupivacaine were gifts from Astra Pain Control AB (Sodertalje, Sweden). Chloroform, used in the extraction method, was 99.9% A.C.S. grade. HPLC grade methanol was used in both the extraction method and as part of the CE buffer. All other chemicals were reagent grade or better and were used as received. All water was purified by passing distilled water through a Barnstead water purification system (Boston, MA, USA). Two buffers were used in this work. The CE buffer consisted of 30% v/v methanol and 70% v/v 214 mM ammonium acetate, pH 5.0. The extraction buffer consisted of 300 mM sodium bicarbonate, pH 10. All solutions were filtered through a 0.22 pm nylon filter prior to use.
2.2 Urine collection
Female Sprague-Dawley rats were supplied by the University of Kansas Animal Care Unit breeding colony. Housing and care of the animals prior to experimental use was provided by the Animal Care Unit. Housing and care of the animals during experimental procedures were performed according to Animal Use Statements approved by the University of Kansas Institutional Animal Care and Use Committee. Rats weighing 300–350 g were housed in a metabolism cage (Lab Products, Maywood, NJ). Urine was collected over a 12 h period in collection tubes submerged in dry ice. During the collection period, the animals were provided with food and water ad libitum. After collection of blank urine, the rats were given a 15 mg/kg intramuscular injection of bupivacaine, and urine was collected for 12 h after dosing. From rat 1, 10.3 mL urine was collected, while 7.0 mL was collected from rat 2. All urine samples were frozen until use, when they were thawed, extracted, and immediately analyzed by CE.
2.3 Extraction procedure
Varian 3 mL, 200 mg Bond Elute™ C18 SPE cartridges (Phenomonex, Torrance, CA) were used in conjunction with a twelve-sample vacuum manifold (Supelco, Bellefonte, PA) for all extraction procedures. A Vortex Genie 2™ (Fisher Scientific, Pittsburg, PA) was used to aid dissolution of analytes in the injection matrix after evaporation of the elution solvent. The SPE cartridges were washed with 1 mL of methanol, 3 mL deionized water, and 1 mL of 300 mm sodium bicarbonate, pH 10.0, respectively, before sample application. To 0.940 mL urine sample, 0.200 mL of 300 mm sodium bicarbonate pH 10.0 buffer, and 0.200 mL of 4.0 μm prilocaine were added and the sample was applied to the SPE cartridge. The SPE cartridge was then washed with 0.5 mL deionized water and drained completely. One mL of chloroform was then applied to the SPE cartridge and eluted under vacuum. All washings, sample applications, and sample elutions were performed at a flow rate of approximately 1 mL/min. The chloroform extract was evaporated to dryness and reconstituted in 0.200 mL of 0.1% formic acid, 20% v/v methanol. Reconstitution of the sample was aided by vortexing for 1 min, after which the sample was electrokinetically injected into the CE capillary.
2.4 CE apparatus
CE analyses wereAerformed using Model 3850 Capillary Electropherograph™ (Isco, Lincoln, NE) interfaced to a Turbochrom 4 data acquisition system (PE Nelson, Norwalk, CT) using a 900 Series Interface. A fused-silica capillary, 360 μm OD and 50 μm ID (Polymicro Technologies, Phoenix, AZ), was used for the separation capillary. A window was made in the capillary by placing a drop of concentrated sulfuric acid on the capillary, heating the droplet, wiping the exposed area with a tissue, and finally cleaning with methanol and water.
2.5 CE conditions
The CE capillary length was 105 cm, 83.3 cm to the detection window. Initially, the CE capillary was flushed for 15 min at 20 psi with 100 mm acetic acid, then for 5 min at 20 psi with deionized water, and finally for 1 h at 20 psi with run buffer. The run buffer consisted of 70% v/v 214 mm ammonium acetate, pH 5.0, and 30% v/v methanol. The CE capillary was flushed for 5 min at 20 psi with run buffer between runs, and run buffer was replaced with fresh buffer after every 5 runs. Samples were electrokinetically injected at 5 kV for 45 s. The capillary tip was wiped with a tissue before injection. After injection, the capillary tip was wiped with a tissue, rinsed with run buffer, and finally put into the run buffer reservoir. Separation voltage was 30.2 kV, and the detection wavelength was set at 210 nm.
2.6 Preparation of stock and standard solutions
A stock solution of 1.5 mm desbutylbupivacaine, bupivacaine, 3’-hydroxybupivacaine, and 4’-hydroxybupivacaine and a stock solution of 1.0 mm prilocaine were prepared in water and stored at 4°C. Standards were prepared daily by serial dilutions of the two stock solutions into 20% v/v methanol and 0.1% v/v formic acid.
2.7 Analytical protocol
Limits of detection and quantitation were determined at three and ten times the signal-to-noise ratio, respectively. The linear range for the CE method was established using five standards prepared from serial dilutions of the stock solution into 0.1% v/v formic acid and 20% v/v methanol. Peak height reproducibilities and extraction efficiencies were determined by spiking 0.200 mL of 55.9 μm standards in pH 10.0 buffer and 0.200 mL of 18.7 μm prilocaine into 0.935 mL of urine blank (n = 5) and reconstituting in 0.935 mL of 0.1% formic acid, 20% v/v methanol. Peak height reproducibilities were calculated using prilocaine as an internal standard.
3 Results and discussion
3.1 Influence of run buffer pH
The CE separation of desbutylbupivacaine, 3’-hydroxybupivacaine, 4’-hydroxybupivacaine, bupivacaine, and prilocaine was investigated at several run buffer pH values. Figure 2 shows electropherograms for the separation of 2.5 μm standards and 4 μm prilocaine at (A) pH 4.5, (B) pH 5.0, (C) pH 6.0, and (D) the separation of 5 μm standards at pH 7.0. The run buffers for the pH 4.5, pH 5.0, and pH 6.0 separations consisted of 70% v/v 214 mm ammonium acetate and 30% v/v methanol, while run buffer for the pH 7.0 separation consisted of 70 % v/v 171 mm potassium phosphate and 30% v/v methanol. The order of migration is desbutylbupivacaine (1), prilocaine (2), bupivacaine (3), 3’-hydroxybupivacaine (4), and 4’- hydroxybupivacaine (5) in all electropherograms except for Fig. 2D in which no prilocaine was added and the two hydroxybupivcaine peaks comigrate. At pH 4.5, baseline resolution was achieved for all compounds with an analysis time of 16 min. Increasing the pH of the buffer to 5.0 permitted baseline separation of all compounds in a reduced separation time of 15 min. With the use of a pH 6.0 buffer, the analysis time was further improved to 14 min. However at this run buffer pH, comigration of 3’-hydroxybupivacaine and 4’-hydroxybupivacaine began to occur (Rs = 0.87). This comigration of hydroxy bupivacaine isomers was more pronounced with the use of a pH 7.0 run buffer. As the purpose of this pH optimization study was to define a set of CE run buffer conditions permitting baseline resolution of all compounds in as short an analysis time as possible, a run buffer pH of 5.0 was chosen for all future work.
Figure 2.
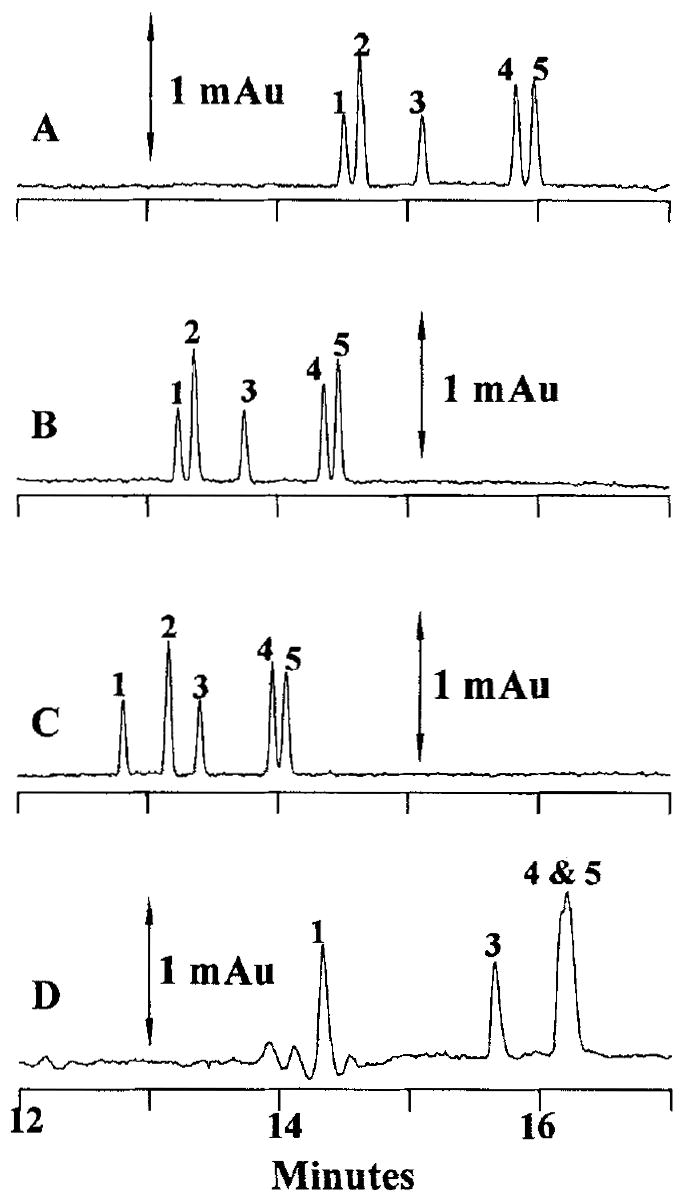
Electropherograms of separations performed at (A) pH 4.5, (B) pH 5.0, (C) pH 6.0, and (D) pH 7.0. CE conditions: run buffer 70% v/v 214 mm ammonium acetate, 30% v/v methanol; electrokinetic injection at 5 kV; separation voltage, 30.2 kV; detection, 210 nm. Peak identities as in Fig. 1.
3.2 Influence of methanol concentration
It was noted that significant peak tailing occurred when aqueous buffers were employed. Adding methanol to the run buffer has been shown to reduce peak tailing for some compounds [20]. The use of methanol to reduce peak tailing was investigated at concentrations of 20 and 30% v/v. With the use of 20% v/v methanol in the run buffer, peak tailing was reduced but not eliminated. Methanol at 30% v/v was found to eliminate peak tailing; thus, this concentration of methanol was used in the run buffer for all further analyses. Higher concentrations of methanol were not investigated because evaporation of the organic portion of the run buffer at higher organic concentrations can lead to irreproducible peak heights and migration times [21].
3.3 Influence of injection time
In the initial stages of this investigation, vacuum, hydrodynamic, and electrokinetic injection schemes were investigated. As the injection matrix is acidic, bupivacaine, its metabolites and prilocaine all exist in their ionized forms and are amenable to electrokinetic injection. The selection of electrokinetic injection for the final method was based on the better limits of detection associated with this injection technique compared to vacuum or hydrodynamic injection. While hydrodynamic injection was slightly more reproducible than electrokinetic injection, 1.5% versus 2.3% (n = 3), electrokinetic injection provided more than a 10-fold improvement in detection limit, 10 μm for hydrodynamic injection versus 0.7 μm for electrokinetic injection.
The effect of the injection time on the sensitivity and resolution of the CE method was studied; the relationship between analyte response and injection time is presented in Fig. 3. It can be seen that the analyte response increases with increasing injection time; however, the resolution of 3’-hydroxybupivacaine and 4’-hydroxybupivacaine decreases as the injection time is increased. The resolution of 3’-hydroxybupivacaine and 4’-hydroxybupivacaine was 1.12, 1.03, 0.93, and 0.93 at 10, 45, 65, and 120 s, respectively. Baseline resolution of prilocaine and desbutylbupivacaine was achieved at all injection times studied, with Rs = 1.12, 1.02, 1.00, and 1.00 at 10,45, 60, and 120 s, respectively. Lower resolution of the two hydroxy metabolites using longer injection times is due to the injection of a longer analyte band. A longer analyte band leads to decreased resolution because the effective length of capillary available for separation of analytes is decreased. This is evidenced in the reduced number of theoretical plates for the hydroxy isomer separation at different injection times. Separation efficiencies for 3’- and 4’-hydroxybupivacaine were 274 × 103, 231 × 103, 206 × 103 and 188 × 103 plateslm at injection times of 10, 45, 65 and 120 s, respectively. Although the use of longer injection times would result in improved limits of detection for this CE method, an injection time of 45 s was chosen as it permitted good resolution of all compounds, particularly that of the hydroxybupivacaine isomers. The detection limit using this 45 s injection time proved sufficient, when used in conjunction with SPE, for the analysis of bupivacaine and its desbutyl and hydroxy metabolites in urine.
Figure 3.
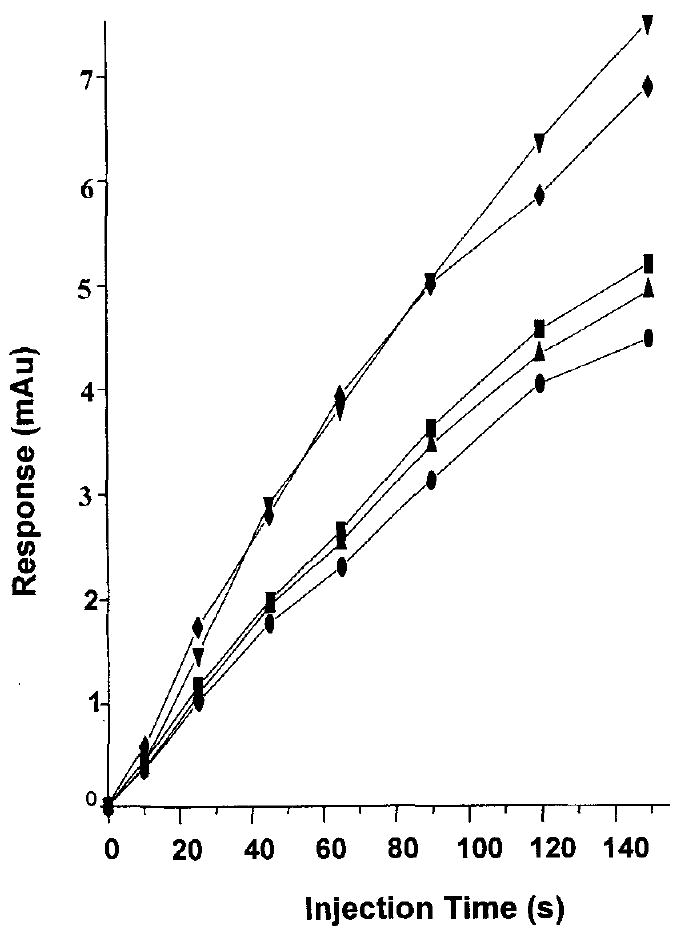
Plot of injection time versus analyte response for (■) desbutylbupivacaine; (●)prilocaine; (▲) bupivacaine; (▼) 3’- hydroxybupivacaine; (♦) 4’-hydroxybupivacaine. CE conditions: run buffer 70% v/v 214 mm ammonium acetate, pH 5.0, 30% methanol; all other conditions as in Fig. 2.
3.4 Method characteristics
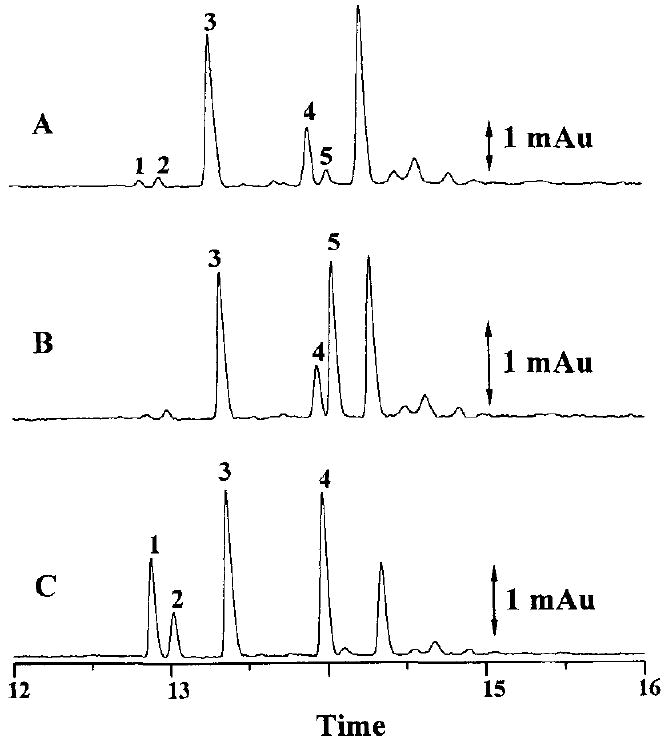
Figure 4 shows electropherograms of (A) a blank injection, (B) injection of 5 μm standards and 4 μm prilocaine, and (C) injection of 0.5 μm standards and 4 μm prilocaine. Figure 4C shows identifiable peaks for all four analytes near the limit of quantitation. The analytical characteristics of the method are listed in Table 1. The limits of detection for the four compounds were 0.22 μm for desbutylbupivacaine and bupivacaine, 0.15 μm for 3’-hydroxybupivacaine, and 0.16 μm for 4’-hydroxybupivacaine. When used in conjunction with SPE, the detection limits of the CE method were sufficient for the analysis of bupivacaine and its metabolites in urine. Linear dynamic ranges from 0.7 μm to 16.8 μm, extrapolated through zero, with R > 0.997, were established for all four compounds. Migration time reproducibilities (n = 5) were 2.4% for all compounds. Extraction efficiencies ranging from 63% to 72% were achieved for bupivacaine and its metabolites. This indicated that good recovery of analytes by the extraction method was possible. These extraction efficiencies are similar to a previously reported SPE procedure [15]. In the final method, use of the internal standard prilocaine corrected for any losses during the extraction procedure. Peak height reproducibiliteis (n = 5) for the overall method were 5.6% for desbutylbupivacaine and bupivacaine and 9.9% for 3’- and 4’-hydroxybupivacaine. The use of peak height gave somewhat better precision at low concentrations (less than 5 μm) than did peak area. There was no difference in the precision at higher concentrations whether peak height or peak area measurements were used.
Figure 4.

Electropherograms of (A) a blank injection, (B) 5 μm standards and 4 μm prilocaine, and (C) 0.5 μm standards and 4 μm prilocaine. All CE conditions and peak identities as in Fig. 2.
Table 1.
Analytical parameters
| Desbutylbupivacaine | Bupivacaine | 3’-Hydroxybupivacaine | 4’-Hydroxybupivacaine | |
|---|---|---|---|---|
| Extraction efficiencya | 63% | 72% | 68% | 68% |
| Method RSDa, b | 5.6% | 5.6% | 9.9% | 9.9% |
| CE RSDa, c | 1.9% | 2.3% | 1.4% | 2.4% |
| Migration time (min)a | 13.32 | 13.85 | 14.47 | 14.59 |
| Migration time RSDa | 2.4% | 2.4% | 2.4% | 2.4% |
| LOQ (μm)a | 0.72 | 0.74 | 0.51 | 0.53 |
| LOD (μm)a | 0.22 | 0.22 | 0.15 | 0.16 |
| Sensitivity (mAu/μm)a | 0.32 | 0.3 1 | 0.45 | 0.43 |
| N (plates/m)a | 237 × 103 | 219 × 103 | 240 × 103 | 223 × 103 |
n = 5
includes the extraction and CE steps using spiked urine samples
includes ony the CE step using standards
LOD, limit of detection; LOQ, limit of quantitation
Figure 5 shows electropherograms of (A) urine blank after SPE, and (B) standards spiked into the urine blank. The urine blank was clean after extraction except for a minor peak that migrated before any of the analyte peaks. This endogenous peak did not interfere with any of the analytes as shown in Fig. 5B. An electropherogram of a 12 h urine extract, diluted by a factor of four with injection buffer, is presented in Fig. 6A. An aliquot of the same 12 h urine sample was spiked with 4’-hydroxybupivacaine and the resultant electropherogram is shown in Fig. 6B. A further aliquot of the 12 h urine sample was spiked with desbutylbupivacaine, prilocaine, bupivacaine, and 3’-hydroxybupivacaine; the resultant electropherogram is presented in Fig. 6C. Based on their respective migration times, bupivacaine, desbutylbupivacaine, 3’-hydroxybupivacaine, and 4’-hydroxybupivacaine could be detected in the urine. Further verification of peak identities was carried out by spiking experiments. Spiking the urine extract with 4’- hydroxybupivacaine increased the height of the peak corresponding to the migration time of 4’-hydroxybupivacaine. Spiking the urine extract with the other three analytes and prilocaine increased the heights of the peaks corresponding to the respective migration times of these compounds. The two spiking experiments thus confirmed the initial identification of all four analyte peaks and the prilocaine peak based on their respective migration times. In addition, unequivocal identification of these peaks was obtained through the use of a CE-MS method developed in our laboratory [22].
Figure 5.

Electropherograms of (A) a urine blank extract, and (B) standards spiked into the urine blank extract. All CE conditions and peak identities as in Fig. 2.
Figure 6.
Electropherograms of a urine extract from (A) a rat dosed with bupivacaine, (B) 4’-hydroxybupivacaine spiked into the same urine extract, and (C) desbutylbupivacaine, bupivacaine, and 3’-hydroxybupivacaine and 4 μm prilocaine spiked into the same urine extract. All CE conditions and peak identities as in Fig. 2.
3.5 Sample analysis
To demonstrate the utility of this method, the CE method was applied to the analysis of bupivacaine in the urine of two female Sprague-Dawley rats previously administered a 15 mgkg intramuscular dose of bupivacaine. Table 2 presents the mass of bupivacaine, desbutylbupivacaine, and 3’- and 4’-hydroxybupivacaine recovered, in addition to their recovery as a percentage of the administered dose. The recoveries as a percent of the dose were 0.02, 0.78, 0.13, and 0.03% for desbutylbupivacaine, bupivacaine, 3’-hydroxybupivacaine, and 4’-hydroxybupivacaine, respectively.
Table 2.
Recoveries of bupivacaine and its metabolites in rat urine 12h after dosing with 15 mg/kg bupivacaine
| Rat 1 | Rat 2 | |||
|---|---|---|---|---|
| Mass recovered (μg) | % Recovery of dose | Mass recovered (μg) | % Recovery of dose | |
| Desbutylbupivacaine | 0.86 | 0.02 | 0.95 | 0.02 |
| Bupivacaine | 37.20 | 0.78 | 34.62 | 0.74 |
| 3’-Hydroxybupivacaine | 6.32 | 0.13 | 10.00 | 0.22 |
| 4’-Hydroxybupivacaine | 1.52 | 0.03 | 2.43 | 0.05 |
| Total | 45.90 | 0.96 | 48.00 | 1.03 |
In the study by Goehl et al. [3] bupivacaine and 3’-hydroxybupivacaine were quantified whereas Caldwell et al. [2] reported quantification of all four compounds. In the current study, less overall recovery of bupivacaine and its metabolites was achieved than in these studies. This lower recovery is likely due to the fact that urine was only collected for a 12 h period as opposed to a 24 h period in the previous studies.
However, in terms of the aims of the current research, namely to develop a method capable of simultaneously analyzing bupivacaine and its metabolites, it is clear that the CE method can be used in conjunction with SPE for their determination in urine. The method offers superior resolution of the 3’- and 4’-hydroxy metabolites than can be achieved using reverse-phase LC methods [13, 14]. When compared to the use of radiochemical detection in earlier studies [2, 3] for the analysis of the hydroxy isomers, the CE method represents a more convenient and rapid approach for their determination in urine. In addition, the CE method can be interfaced directly to a mass spectrometer to provide further identification of unknown peaks in the electropherograms of the urine extract, as shown in Fig. 6A. The development of a CE-MS method [22] employing electrospray ionization is currently underway in our laboratory for the identification of further metabolites of bupivacaine.
4 Concluding remarks
An analytical method for the determination of the local anaesthetic, bupivacaine, and its metabolites in rat urine using SPE and CE has been demonstrated. The excellent resolution of the CE method makes this a viable approach for the in vivo analysis of bupivacaine and its metabolites. A particular advantage of this approach over published HPLC methods is that separation of the two hydroxy positional isomers of bupivacaine is possible. A number of unknown peaks were also observed in the electropherograms from the rats dosed with bupivacaine. These did not correspond to any peaks appearing in the blank urine samples. Characterization of these unknown peaks may prove useful for the further understanding of bupivacaine metabolism, Qualitative determination of these unknowns by CE-MS is currently being carried out in our laboratories.
Acknowledgments
The authors would like to thank Astra Pain Control AB, Sodertalje, Sweden for generously providing us with bupivacaine metabolites. This work was funded by NIH grant R01 GM4990. M.A.S. acknowledges the financial support of National Cancer Institute Training Grant T32- CA09242.
Abbreviation
- SPE
solid phase extraction
References
- 1.Burm AGL. Drug Dispos. 1989;16:283–311. [Google Scholar]
- 2.Caldwell J, Notarianni LJ, Smith RL, Snedden W. Proc BPS. 1977 July 13–15;:135–136. [Google Scholar]
- 3.Goehl TJ, Davenport JB, Stanley MJ. Xenobiotica. 1973;3:761–772. doi: 10.3109/00498257309151601. [DOI] [PubMed] [Google Scholar]
- 4.Dennhardt R, Fricke M, Stoeckert G. Reg Anaesth. 1978;1:59–64. [PubMed] [Google Scholar]
- 5.Bouche R, Lhoest G. Pharm Acta Helv. 1976;51:223–225. [PubMed] [Google Scholar]
- 6.Kuhnert PM, Kuhnert BR, Stitts JM, Gross TL. J Anesthesiology. 1981;55:611–617. doi: 10.1097/00000542-198155060-00001. [DOI] [PubMed] [Google Scholar]
- 7.Pihlajamaki K, Kanto J, Lindberg R, Karanako M, Kiilholma P. Brit J Anaesth. 1990;64:556–562. doi: 10.1093/bja/64.5.556. [DOI] [PubMed] [Google Scholar]
- 8.Mather LE, Long GJ, Thomas J. Clin Phamcol Ther. 1971;12:935–943. doi: 10.1002/cpt1971126935. [DOI] [PubMed] [Google Scholar]
- 9.Reynolds F. Brit J Anaesth. 1971;43:33–37. doi: 10.1093/bja/43.1.33. [DOI] [PubMed] [Google Scholar]
- 10.Sullivan NW, Weiner L. J Chrornatogr. 1987;417:236–238. doi: 10.1016/0378-4347(87)80115-9. [DOI] [PubMed] [Google Scholar]
- 11.Michaelis HC, Geng W, Kahl GF, Foth H. J Chromatogr. 1990;527:201–207. doi: 10.1016/s0378-4347(00)82101-5. [DOI] [PubMed] [Google Scholar]
- 12.Le Guevello P, Le Corre P, Chevanne F, Le Verge R. J Chromatogr. 1993;622:284–290. doi: 10.1016/0378-4347(93)80279-d. [DOI] [PubMed] [Google Scholar]
- 13.Lindberg RLP, Kanto JH, Pihlajamaki KK. J Chromatogr. 1986;383:357–364. doi: 10.1016/s0378-4347(00)83481-7. [DOI] [PubMed] [Google Scholar]
- 14.Kastrissios H, Hung MF, Triggs EJ. J Chromatogr. 1992;577:103–107. doi: 10.1016/0378-4347(92)80603-n. [DOI] [PubMed] [Google Scholar]
- 15.Gupta RN, Dauphin A. J Chromatogr B. 1994;658:113–119. doi: 10.1016/0378-4347(94)00214-2. [DOI] [PubMed] [Google Scholar]
- 16.Yu Z, Westerlund D. J Chromatogr A. 1996;725:149–155. doi: 10.1016/0021-9673(95)00947-7. [DOI] [PubMed] [Google Scholar]
- 17.Yu Z, Abdel-Rehim M, Westerlund D. J Chromatogr B. 1994;654:221–230. doi: 10.1016/0378-4347(93)e0454-x. [DOI] [PubMed] [Google Scholar]
- 18.Soini H, Riekkola ML, Novotny MV. J Chromatogr. 1992;608:265–274. doi: 10.1016/0021-9673(92)87133-s. [DOI] [PubMed] [Google Scholar]
- 19.Wolfisberg H, Schmutz A, Stotzer R, Thormann W. J Chromatogr A. 1993;652:407–416. doi: 10.1016/0021-9673(93)83260-Y. [DOI] [PubMed] [Google Scholar]
- 20.Weinberger R, Sapp E, Moring S. J Chromatogr. 1990;516:271–285. doi: 10.1016/s0021-9673(01)90225-0. [DOI] [PubMed] [Google Scholar]
- 21.Leung GNW, Tang HPO, Tso TSC, Wan TSM. J Chromatogr A. 1996;738:141–154. [Google Scholar]
- 22.Schieferecke MA, McLaughlin KJ, Williams TD, Lunte CE. Conference Proceedings of the 22nd International Symposium on High Perjomnce Liquid Chromatography; St. Louis. May 1998; p. 216. [Google Scholar]