

Abstract
The limits of detection (LOD) for capillary electrophoresis (CE) are constrained by the dimensions of the capillary. For example, the small volume of the capillary limits the total volume of sample that can be injected into the capillary. In addition, the reduced pathlength hinders common optical detection methods such as UV detection. Many different techniques have been developed to improve the LOD for CE. In general these techniques are designed to compress analyte bands within the capillary, thereby increasing the volume of sample that can be injected without loss of CE efficiency. This on-line sample preconcentration, generally referred to as stacking, is based on either the manipulation of differences in the electrophoretic mobility of analytes at the boundary of two buffers with differing resistivities or the partitioning of analytes into a stationary or pseudostationary phase. This article will discuss a number of different techniques, including field-amplified sample stacking, large-volume sample stacking, pH-mediated sample stacking, on-column isotachophoresis, chromatographic preconcentration, sample stacking for micellar electrokinetic chromatography, and sweeping.
Keywords: On-line preconcentration, Stacking, Capillary electrophoresis, Field-amplified stacking, pH-mediated stacking, Review
1 Introduction
With a separation based on physical phenomena different from those used in chromatography, capillary electrophoresis (CE) has been the focus of attention for developing new analytical methodology. The analysis of samples that cannot be separated by more common reversed-phase liquid chromatography (LC) are often resolved by CE. Unfortunately, the benefits from the high number of theoretical plates obtained with CE have been overshadowed by the poor detection limits achieved with UV detection. Because of the small dimensions of CE capillaries, typically 25–150 μm ID and 40–80 cm in length, only very small sample volumes may be loaded onto the column. Additionally, for the most common optical detection techniques, CE suffers from a drastically reduced pathlength as compared to LC. Since absorbance is directly proportional to pathlength and concentration, the concentration of the samples must be dramatically increased to obtain the same signal-to-noise ratio as would result from a typical LC experiment. Overcoming the poor sensitivity of CE has been the emphasis of many investigations. A number of techniques have been developed to preconcentrate samples and to increase the amount of sample that can be loaded onto the column without degrading the separation. The focus of this article is to explain the different approaches that have been developed over the last ten years. These approaches can be categorized into two groups based on the physical phenomena used to concentrate analytes. One method involves manipulating the electrophoretic velocity of the analyte and includes techniques such as field-amplified sample stacking, large-volume sample stacking, isotachophoresis, pH-mediated stacking, and matrix switching. The other group utilizes partitioning into a stationary or pseudostationary phase to affect the analyte preconcentration, including chromatographic preconcentration and sweeping.
Two effects, the electroosmotic flow EOF and the molecule’s electrophoretic mobility determine the migration time of sample molecules in CE. The EOF is the bulk flow through the capillary due to the migration of cationic counterions, which are held closely to the anionic capillary wall by electrostatic forces. The electrophoretic mobility is a result of the force exerted on any charged particle in an electric field. This force is balanced by the frictional counterforce of the fluid surrounding the particle. With the exception of a very short initial time, these two forces are equal. This results in a steady-state velocity of the charged particle that can be calculated by
| (1) |
where q is the charge on the particle, E is the field strength, and f is the frictional coefficient. It is important to note that the electrophoretic mobility of an analyte is directly proportional to the local field strength inside the capillary. The field strength in a capillary filled with one buffer is defined by
| (2) |
where V is the voltage and L is the length of the capillary. In a capillary filled with two buffers of differing resistivities the field strength is given by
| (3) |
| (4) |
where E1 and E2 are the field strengths of the high and low resistance solutions, respectively. E0 is the field strength in a system of only buffer 1 or 2, γ is the ratio of the resistivities of the low concentration buffer to that of the high, and x is the fraction of the capillary filled with low resistance buffer. It follows that the higher the resistivity of one buffer relative to the other, the more the field strength is amplified in that buffer. Since analyte velocity is directly proportional to field strength, the larger the difference in resistance of the two buffers inside the capillary, the faster the analytes will migrate through the high resistance buffer. This can be particularly detrimental when dealing with biological samples where the sample matrix consists of salts with a concentration on the order of 100 mM. In this instance, as sample is injected, a high field strength develops over the relatively low concentration background electrolyte (BGE) while a low field occurs over the portion of the capillary where low resistance, high conductivity sample matrix has been injected. The analytes migrate slowly through the sample matrix until they reach the BGE where they accelerate. This leads to band broadening and a decreased signal-to-noise ratio. The difficulty of making the BGE at a lower resistance than the sample matrix is the limitation created by Joule heating as a result of high currents with high ionic strength buffers.
Although the band broadening as a result of a relatively low field over the sample plug is detrimental, the reverse has proven to be important in understanding the techniques used for online preconcentration in CE. Almost all on-column concentration techniques manipulate the changes in electrophoretic mobility of analytes at the boundary between high-resistance and low-resistance buffers. Albeit this may seem insignificant when first investigating some of the more sophisticated techniques involving polarity switching, matrix switching, and the acid/base titration of a sample zone, the same phenomena is responsible for on-column sample concentration in each of these techniques.
Two factors affect the enhancement of analyte detection in stacking. First is the narrowing of analyte bands in the column. As the peak width of the analyte is decreased, the peak height is dramatically increased, resulting in a greater signal-to-noise ratio, improving the limits of detection. The second factor is the amount of sample that can be loaded onto the column. Because the width of the peaks is significantly reduced by the stacking procedure, much larger sample volumes may be injected without losing separation efficiency. This results in a greater mass of analyte in the capillary and therefore a greater response at the detector.
2 Field-amplified sample stacking
The simplest technique for sample stacking is field-amplified sample stacking (FASS). The effects of injecting samples in low-conductivity matrix were first explained by Mikkers et al. in 1979 [1]. In general, this method is based upon the idea that ions electrophoretically migrating through a low-conductivity solution into a high-conductivity solution slow down dramatically at the boundary of the two buffers. For example, consider a sample dissolved in a low-conductivity solution such as water. The electric field strength will be higher over the low-conductivity sample zone than the BGE. Therefore, the velocity of the analyte will be high in the sample zone until it reaches the buffer interface. As the sample ions reach the high-concentration BGE they slow down and stack into a narrow zone.
Burgi and Chien [2] described a model to optimize the buffer concentrations in the sample and capillary, and have discussed the limitations to stacking efficiency in FASS [3]. The stacking efficiency is limited by laminar flow created by differences in EOF arising from the discontinuous buffers. The flow profile created by laminar flow conditions can be convex or concave depending on whether the leading buffer has the higher or lower EOF. This hemispherical shape can cause band broadening in the narrow sample zone. Furthermore, Chien and Burgi [4] described enhanced stacking and sample loading by injection of a water plug into the capillary immediately prior to sample injection (Fig. 1). Further study has shown that injection of a high viscosity plug, such as ethylene glycol, prior to the preinjection plug of water, acts as a trap to slow the electrophoretic velocity of the analytes [5]. Stacking efficiencies were doubled using this procedure. Addition of organic solvent to the sample matrix has also been shown to provide an improved signal-to-noise ratio [6].
Figure 1.
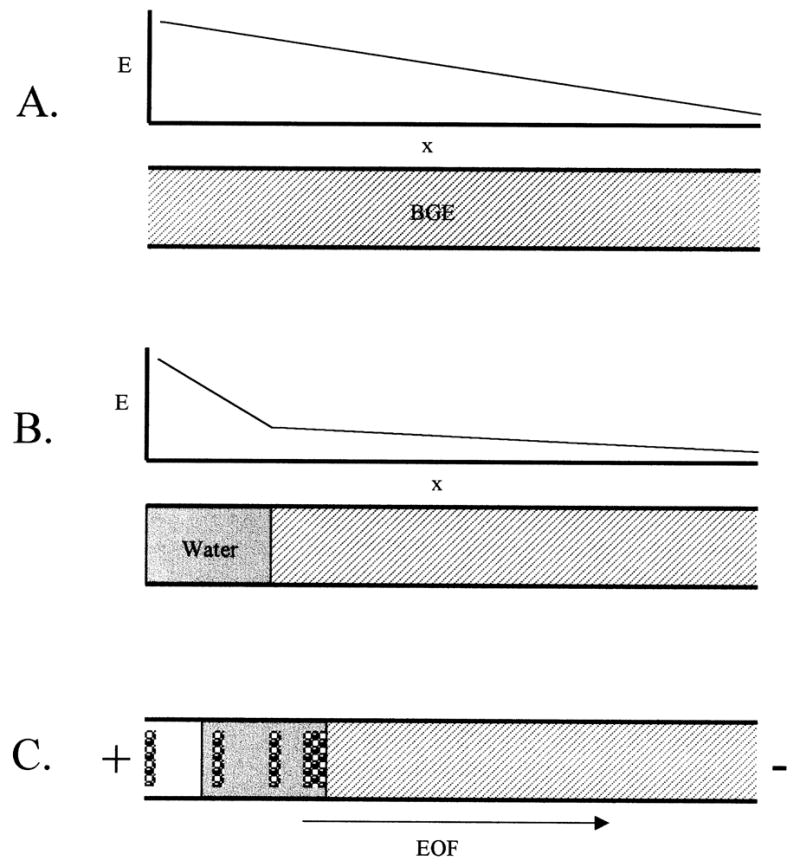
FASS with a preinjection plug of water. (A) Capillary filled with BGE prior to injection. The field strength across the capillary is shown qualitatively. (B) A short plug of water is injected hydrodynamically. The diagram of the field strength shows that high field strength is exhibited over the water plug, while the remainder of the capillary has a relatively low field strength. (C) As the sample is electrokinetically injected cations race across the water plug and stack at the boundary of water and BGE, while the EOF draws a small amount of the sample matrix into the capillary.
Sjogren and Dasgupta [7] describe a FASS technique in which there is no liquid junction between the anode and the capillary tip. After the sample is injected into the capillary, the capillary tip is positioned 1.5 cm above the anodic buffer reservoir and the potential is applied to the buffer reservoir. Since the field strength is significantly higher than the breakdown voltage of the intervening air, the circuit is closed and the analytes stack. Care must be taken to return the capillary to the anodic reservoir for separation, before air bubbles are introduced into the capillary tip. The goal of this approach is to increase reproducibility and efficiency. Significant improvements were not observed for small molecules while quantitative improvements were evident for larger molecules with slower diffusion coefficients.
Friedberg et al. [8] have reported the effects of pH, ionic strength and buffer composition on stacking with and without acetonitrile in the sample matrix. Different buffers were shown to amplify the stacking effects for different analytes. Additionally, increased efficiency was observed for the analytes studied by lowering the pH of the sample buffer relative to the BGE and by increasing the ionic strength of the sample matrix when using acetonitrile to dilute samples for stacking. Furthermore, Beckers and Ackermans [9] have discussed the effects of stacking on resolution and the pH in the capillary. The resolution was decreased as a result of large injection volumes used in stacking. This is due in part to the relatively low field strength in the BGE, and to the diminished effective separation length of the capillary when long stacking zones are employed. Stacking techniques can also create circumstances where a difference in field strength between sample and BGE zones can affect local pH inside the capillary. For instance, in a typical stacking experiment protons will migrate much more quickly through the sample zone than the BGE. Therefore, the number of protons leaving the sample zone will be greater than the number of protons entering and the pH will increase. This can slow the mobility of weak cations, countering the stacking effect.
Applications of FASS include analysis of DNA fragments [10], analysis of Pharmaceuticals in serum [11] and drugs of abuse [12, 13]. Sensitivity enhancements up to 1000-fold have been reported [14]. Sample stacking for nonaqueous CE [15] and nonaqueous chiral separations [16] has also been performed. However, a limitation to FASS is that the ionic strength of the sample must be significantly lower than that of the BGE. This requirement may cause problems for analysis of some physiological solutions such as dialysate. FASS was discussed in detail by Chien and Burgi [17] as well as by Albin et al. [18].
3 Large-volume sample stacking
Large-volume sample stacking (LVSS) is a technique designed by Chien and Burgi [19] that is performed by dissolving the sample in water and hydrodynamically filling 1/3–1/2 of the capillary with the sample. Reverse polarity is applied with BGE at the detection end of the capillary. As a result, the EOF backs the sample plug out of the capillary while anionic analytes move toward the detection end and stack at the interface with the BGE. The electrophoretic current is monitored until it reaches approximately 95–99% of its original value. At this point the polarity is returned to normal, and the separation occurs in the usual fashion.
Under reverse polarity, the cations and neutrals should exit the capillary into the waste buffer reservoir before the polarity is returned to normal. However, if the electrophoretic current is not carefully monitored, some anionic analyte may be lost. Applications of this method include analysis of drugs [20, 21], dyes [21, 22], chelates [21, 22], metals in hair [23], chemicals of environmental concern [24], and phenols [25] with 2- to 100-fold enhancements reported. A variation of this technique has been used to improve the detection limits of cations [20, 21]. The EOF modifier cetyltrimethylammonium bromide (CTAB) has been used to reverse the EOF of the system and the separation performed with the CE system in reversed polarity mode. McGrath and Smyth [20] reported 10-fold concentration enhancement for analysis of cationic drugs in a urine sample after extraction and reconstitution in water.
LVSS is a demanding procedure since the current must be closely monitored by the analyst to obtain reproducible results. This technique will not separate anions and cations simultaneously, and is additionally limited to analytes with low mobilities [26]. However, variations on this technique do allow the analysis of fast moving ions. LVSS without polarity switching has been reported for the analysis of high mobility anions [27, 28]. In this technique an EOF modifier such as CTAB is present in the BGE. When the capillary is primarily filled with sample dissolved in water and a reversed polarity is applied to the inlet, the EOF pushes the sample plug out of the capillary. As this happens, BGE from the detector side of the capillary is pulled into the column. The CTAB present in the BGE coats the capillary and reverses the direction of the EOF, eliminating the need for polarity switching. This approach has also been reported using a BGE at low pH to suppress the EOF rather than reversing it [29]. Another variation on LVSS is termed double stacking [30]. In this procedure all potentials are applied in normal polarity and pressure at the detection side of the capillary is used to back the sample plug out of the capillary.
4 pH-Mediated stacking
FASS and LVSS are performed with the sample either dissolved in water or diluted with a low conductivity buffer. Unfortunately, this is not always an option, as is often the case when analyzing low concentrations in dialysate. One method for improving the detection limits with these samples is to neutralize the high-conductivity sample matrix with pH-mediated sample stacking. This is a technique in which FASS is triggered by titrating the injected sample zone to neutral, thus creating a low-conductivity region (Fig. 2). First, a sample in a high-ionic strength biological medium is electrokinetically injected. As the sample is injected the anions of the strong acid such as Cl− are displaced by the anions of the weak acid in the BGE, such as acetate. Next, a plug of strong acid (HCl) is injected electrokinetically. The protons from the acid injection migrate quickly through the sample zone, titrating the acetate ions and creating a region of neutral charge and high resistivity. This allows the sample cations to migrate quickly through the titrated zone to the boundary with the BGE, where they stack into a narrow band [31, 32]. This method can also be used for the determination of anions by incorporating an EOF modifier such as CTAB into a basic BGE and running in reverse polarity [33] (Fig. 3). Applications of pH-mediated stacking have been reported for the analysis of Pharmaceuticals [31] as well as for DMA sequencing [34].
Figure 2.
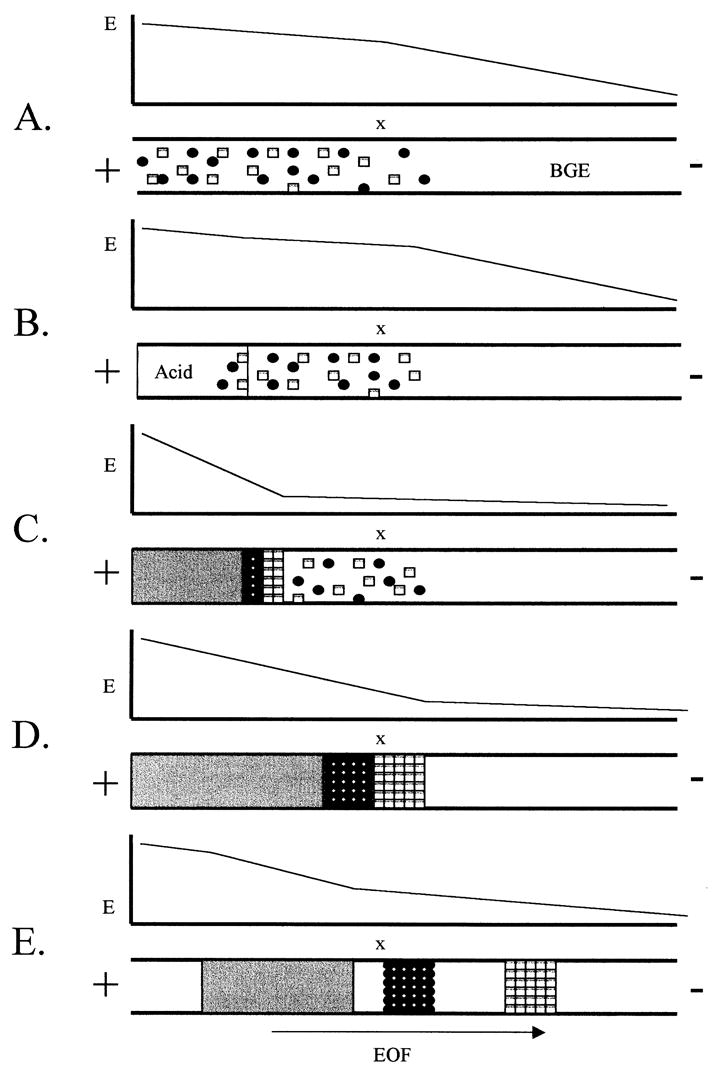
Schematic of the acid stacking mechanism for pH-mediated stacking. (A) A sample in a high ionic strength sample matrix is injected electrokinetically. Because the resistivity of the sample matrix is lower than that of the BGE, most of the field strength is dropped across the BGE portion of the capillary. (B) Next a plug of strong acid is electrokinetically injected behind the sample plug. (C) As the separation voltage is applied the strong acid titrates the sample zone to neutral, creating a high resistance zone. Now mosts of the field strength is dropped across the sample zone. (D) The acid titrates the entire sample zone and the analytes are stacked into narrow bands at the boundary of the titrated zone and the BGE. (E) The electrophoretic separation proceeds through the remainder of the capillary.
Figure 3.
Example of pH-mediated stacking using base stacking. (A) Normal electrokinetic injection of 10 μM phenolic acids in 90% Ringer’s solution. (B) Injection of 10 μM phenolic acids in 90% Ringer’s solution using base stacking procedure.
Previous reports of pH-mediated stacking for the analysis of peptides have used different techniques for titrating the sample zone. Aebersold and Morrison [35] injected a sample of dilute peptides in a highly basic matrix into a capillary containing an acidic buffer. In the basic sample solution the peptide has a net anionic charge, while in the acidic BGE the peptide is positively charged. Therefore, as the sample zone is titrated from basic to acidic during the CZE separation, the direction of the electrophoretic migration of the peptide is reversed. Schwer and Lottspeich [36] describe the hydrodynamic injection of strong base, followed immediately by injection of peptide sample, then strong acid. The OH−1 and H+ migrate towards one another, temporarily creating a low-conductivity region to electrofocus the peptides.
If too large a volume of sample is injected, the separation efficiency will be dramatically diminished. This is caused by too large a portion of the capillary being used for stacking and an insufficient length left for the separation. Simply increasing the length of the capillary does not solve this problem, however, since the field strength is highly amplified in the sample zone and weakened in the BGE.
To increase the sample loading capacity, further investigation into pH-mediated stacking incorporated a double-capillary system in which the capillaries are arranged in a “T”. The analytes are stacked between one arm of the “T” and the injection end of the capillary. The separation potential is applied across the stacking arm of the “T” and the detection end of the capillary, allowing a separation without the sample zone affecting the field strength [33]. This increased the amount of sample that could be loaded onto the column. A 300-fold enhancement in detection limits has been reported using pH-mediated stacking [33]. The most impressive aspect of this method is the complete simplicity with which it allows the user to analyze biological samples.
5 Isotachophoresis
Unlike CE, isotachophoresis (ITP) is performed with a discontinuous buffer. ITP is applicable to many compounds ranging from small charged analytes to proteins [37–39]. This method is particularly useful when samples are not simply dissolved in water, but have some conducting ions, such as biological samples. ITP is often performed with the sample zone between the BGE of higher (leading electrolyte) and lower electrophoretic mobilities (terminating electrolyte). Typically, either cations or anions can be separated in one run with some exceptions [40, 41]. For cation analysis the leading buffer is positioned on the cathodic end of the sample zone while the terminating buffer is injected after the sample zone. When high voltage is applied, a potential gradient develops and each of the analyte zones migrate with the same velocity. Where cations of lower mobility are present, the electric field is stronger, making the velocity of the zone match the rest of the sample. If a solute moves too slowly and enters the band behind it, a region of higher field strength, the analyte will accelerate until it re-enters its own zone. Eventually a steady state is reached where each analyte moves as a discrete band according to its mobility. Bands with the highest mobility will elute before those of lowest mobility. Continuing the separation in the zone electrophoresis mode can be performed by placing the capillary inlet in leading electrolyte. When the leading electrolyte catches up with the sample zone the field gradient will be lost and CE separation will begin. This is one of the main modes of transient ITP-CE, so named because the migration mode gradually changes from ITP to CE.
One of the advantages of ITP over CE is that with samples in a high ionic strength matrix, the matrix itself may be used as the leading electrolyte. This is another mode of transient-ITP, self-induced stacking [42], when the BGE has a lower mobility than the analytes. This was observed as one of the first examples of transient ITP-CE [43]. In this case the BGE serves as the terminating electrolyte. Reinhoud and co-authors [44] have developed a variation of transient ITP-CE referred to as counterflow ITP-CE. A large diameter capillary is used (100 μm ID) to load several microliters onto the capillary. To stack almost 100% of the capillary volume, hydrodynamic back pressure is used during the focusing step, to remove the terminating electrolyte before the CE separation. Using this method, 100-fold concentration of sample was reported, compared to CE alone. ITP followed by capillary gel electrophoresis has also been performed [45]. Using this method, half the capillary was filled with sieving gel and a 700 nL sample of DNA restriction fragments was focused prior to separation.
Coupled column ITP (Fig. 4) uses two capillaries for ITP followed by CE [38, 46–53]. The first capillary has an ID of approximately 500 urn while the second capillary has an ID of 50 μm with similar length [54]. ITP is used to focus analytes in the larger ID capillary. Once the sample bands have been injected into the second capillary, the terminating electrolyte is flushed from the first capillary with leading electrolyte. The CE separation then proceeds in the second capillary. In this way, volumes greater than the total volume of the CE capillary can be stacked into nanoliter volumes for the separation. Nanomolar limits of detection have been reported with this technique for separations of enantiomers in urine [49]. In terms of the effective on-column concentration, a 10000-fold sensitivity enhancement has been reported using coupled column ITP preconcentration [52]. ITP can handle both complex and highly concentrated matrices [53, 55–57] including blood, plasma and urine [49, 58, 59]. Kaniansky etal. [57] demonstrated the determination of six anions in a matrix of 104 times higher concentration than the sample analytes. Applications of ITP are wide, ranging from peptides [38, 60] to arsenic speciation [61]. Since leading and terminating electrolytes must be chosen carefully, Krivankova and Bocek have recommended several [39].
Figure 4.
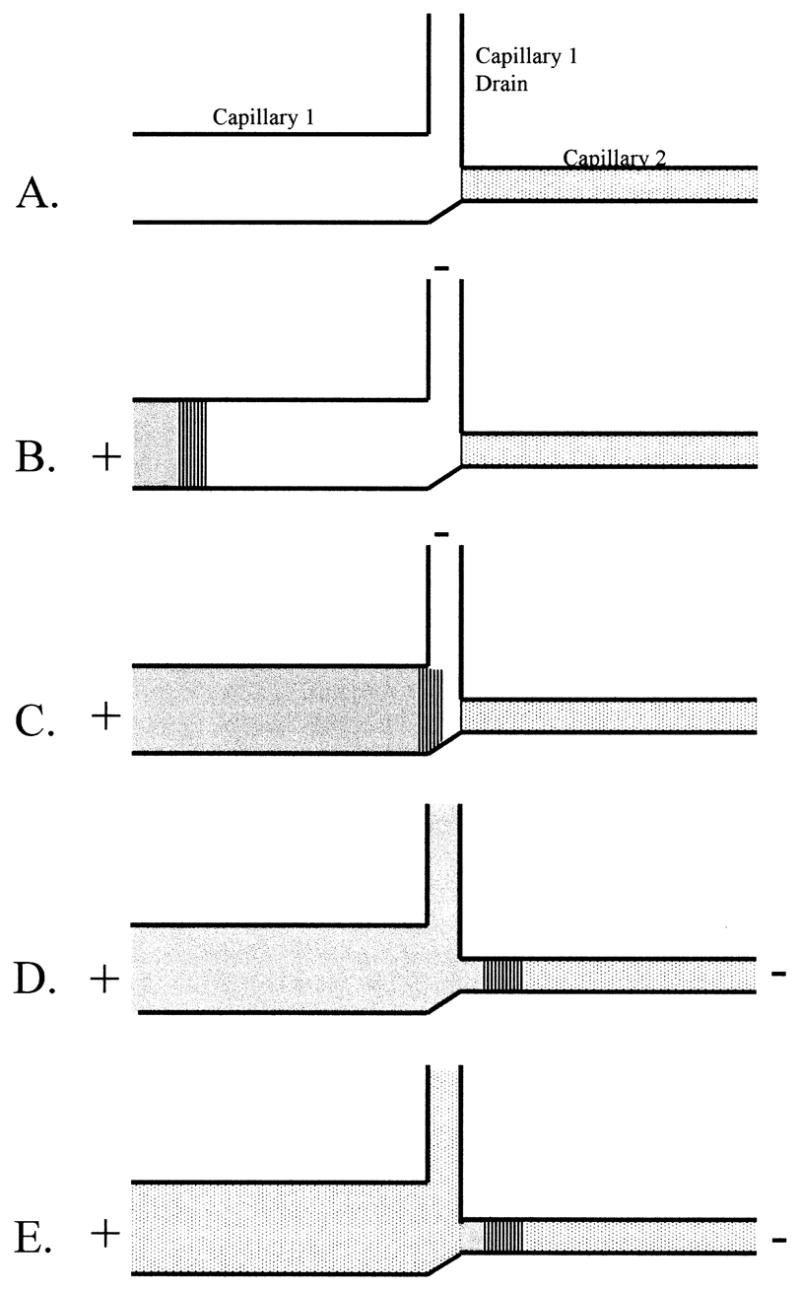
Double capillary system for ITP-CZE. (A) The second capillary is filled with BGE and the first capillary is filled with leading buffer. (B) The sample is injected and the anodic reservoir is filled with terminating buffer. (C) The ITP preconcentration is carried out in the first capillary. Once the boundary of the leading buffer and sample zone has reached the inlet of the second capillary the high voltage is turned off. (D) The high voltage is applied between the inlet of the first capillary and the outlet of the second capillary to transfer the analyte bands into the separation capillary. (E) The first capillary is flushed with BGE and the separation potential is applied.
6 Chromatographic preconcentration
Sample pretreatment with solid-phase extraction (SPE) is commonly used off-line for separations. This is a useful technique that allows a large volume of low concentration sample to be loaded onto the solid phase and eluted in a small volume, providing concentrations that can be easily detected. Since this technique obviously consumes more analyst time, on-line methods have been investigated for CE. One method is to pack a short segment, about 2 mm, of the injection end of the capillary with LC stationary phase [62–73]. The sample is loaded onto the stationary phase by hydrodynamic injection, and then eluted by injection of a second solvent. Applications of this technique have included affinity chromatography stationary phases [71], analysis of Pharmaceuticals isolated from urine [73] and the direct analysis of biological samples [72]. Alternatively, Cai and Rassi [74, 75] have developed an open-tubular preconcentrator for CE. In this approach the walls of a 20 cm capillary are modified with a C18 phase for herbicide analysis [74] or a metal chelate phase for protein analysis [75]. This preconcentration capillary is connected in series with a separation capillary. While these configurations improve sample stacking, a number of problems may arise, including tailing, loss of CE efficiency, and interference between the organic elution solvent and the CE electric field [76]. Attempts to alleviate these problems include development of a double-capillary system [72] and an on-line switching valve [77]. In the double-capillary design the sample matrix is pushed through the inlet and out a drain capillary while the analytical separation is performed between the inlet and a second capillary. With the on-line switching valve the analytes are retained on a stationary bed contained within the valve. To inject the analytes the valve is switched so that the packed bed lies within the path of the CE separation capillary.
Additionally, two-dimensional (2-D) LC-CE designs [78–80] have led to the investigation of on-line LC or SPE steps without an in-capillary solid-phase cartridge. The use of small-bore LC columns on-line with CE, coupled through electrokinetic injection manifolds, have been reported [81–85]. This allows the sample matrix, unretained analytes, and large volumes of LC mobile phase to be flushed through the stationary phase without traversing the capillary’s volume. The difficulty in transferring analyte bands from the LC portion of the system to the CE portion is the major problem with this approach. While this is not an issue in 2-D separations, the coupling of these techniques for preconcentration makes it critical that as much of the analyte as possible is transferred to the CE. The LC portion of the separation must be rugged in order to have a reliable injection of analytes for CE.
Tomlinson, Naylor and co-workers [86–94] have reported a different technique for on-column partitioning-based preconcentration, termed membrane preconcentration (mPC), with the goal of solving some of the problems arising from the use of large packed beds in on-line SPE-CE. Specifically, mPC is designed to improve the CE efficiency by reducing the large volume of organic solvent often needed to elute compounds and to lessen the impact of the large packed bed on the EOF and backpressure [76]. In this technique a thin polymer membrane is placed between two short capillary segments. One end of this preconcentration cartridge serves as the capillary inlet, while the other end connects to the separation capillary. Polymeric phases such as styrene-divinyl benzene, C2 and C8 have been successfully used. The application of this preconcentration method has been shown to improve detection for on-line CE-MS [86, 88–91, 93, 94].
Precolumn and on-line concentration techniques using SPE to replace the high ionic strength sample matrix with a low ionic strength matrix for PASS have also been investigated. The substantial difference between this technique, matrix switching, and other on-line SPE techniques is the purposeful reliance on the elution of analytes in a low-conductivity plug to amplify field effect stacking rather than relying on the solid phase to provide the concentration enhancement. The instrumentation is similar to that described above.
Petersson et al. [95] used a 1–3 mm packed bed at the capillary inlet. The washing of buffer and sample was carefully controlled to prevent the problems previously encountered. All washing, sample loading, and electrolyte rinsing proceeded from the detection end of the capillary to the injection end. Organic solvent was then injected for a short time from the capillary inlet. The elution solvent was pushed further through the packed bed by a short injection of electrolyte, followed by application of the separation potential. The analytes are stacked at the boundary of the high resistance organic solvent and the BGE.
Zhao and co-workers [96] have made use of a four-capillary system arranged in a cross. Numbering the capillaries 1–4 in a clockwise manner, the LC mobile phase flows from a micro-LC column through capillary 1 and to waste through capillary 3. Once the retained analytes are transported into capillary 3 they may be electrokinetically injected into capillary 2. Stacking is observed due to the difference in conductivities between the LC mobile phase and the CE BGE. Once the analytes are stacked into narrow bands at the head of capillary 2, electrophoretic separation is performed between capillaries 4 and 2, thus preventing the low-conductivity mobile phase (present in capillaries 1 and 3) from interfering with the separation electric field. Using matrix switching techniques, detection enhancements of 400- to 500-fold [96, 97] and as high as 7000-fold [95] have been reported. These techniques are limited by their complexity, which can lower the reproducibility of the methods.
7 Stacking techniques in MEKC
Techniques for on-column sample stacking have also been applied to MEKC. These techniques fall into two categories; the first is a derivative of PASS and the second is termed sweeping. A number of techniques for enhancing the detection limits of neutral analytes by applying PASS in MEKC have been reported [5, 98–107]. Some of the methods reported are outlined below.
7.1 PASS
Liu et al. [98] reported stacking by hydrodynamically injecting a sample in a low-conductivity micellar solution into the capillary containing a high-conductivity micellar BGE. The analytes may be stacked in either normal or reverse polarity mode. In normal polarity mode the neutral analytes contained within the anionic micelles migrate quickly toward the inlet end of the capillary and stack at the boundary between the sample solution and the BGE that is being drawn into the capillary by the EOF. The net migration then switches toward the detector since the electroosmotic velocity is greater than the electrophoretic velocity of the micelles in the high conductivity buffer. In reverse polarity mode a negative high voltage is placed at the capillary inlet. The micelles stack towards the detector and the sample plug is backed out of the capillary. Once the current measured through the capillary returns to 90–99% of its preinjection value, the polarity is reversed and the separation proceeds in normal polarity mode. The two methods gave similar stacking efficiencies up to an injection volume of 80 nL, while with an injection volume of 80–160 nL normal polarity stacking yielded superior results. This is attributed to the decrease in stacking efficiency due to band broadening during polarity switching. With the instrumentation used in this study, polarity switching took about 1 min, allowing time for the analyte bands to diffuse. Above 160 nL, the reverse polarity stacking mode was found to be superior. This effect was due to the increase in sample injection volume, which disrupted the uniform field strength in the capillary, resulting in a decrease in efficiency. An 85-fold increase in response was reported using these methods.
Quirino and Terabe [100] have reported a series of studies investigating protocols for the stacking of neutral analytes in MEKC. The first method is termed normal stacking mode. In this technique a sample of neutral analytes, in a low-conductivity sample solution such as water, is injected hydrodynamically into the capillary. Due to the high field strength when the separation voltage is applied, micelles race across the sample zone toward the capillary inlet incorporating the neutral analytes. Once the micelles reach the boundary between the sample zone and the BGE that has been drawn into the capillary by the EOF, they are stacked into narrow bands. The result was a 10-fold enhancement in detection limits. In reverse polarity stacking mode, analytes in a low-conductivity matrix are again injected hydrodynamically [101]. Stacking is then performed by applying a negative voltage to the capillary inlet. As the sample solution is being backed out of the capillary by the EOF, micelles from the inlet buffer reservoir migrate across the sample zone towards the detector, stacking the analytes. Once the current of the system has returned to 90–99% of its preinjection value, the polarity is reversed and the separation proceeds in normal polarity mode. Although some improvement in stacking efficiency is observed, as compared to normal stacking mode, the reproducibility of this method may be limited by the analyst’s ability to determine when to switch the polarity from stacking to separation mode.
Stacking with reverse migrating micelles employs a highly acidic micellar BGE to reduce the EOF [102]. Samples in water are injected onto the capillary via pressure, and the separation is run in reverse polarity mode. Since the potential at the inlet is negative, the EOF slowly pushes the sample plug out of the capillary. However, because the high concentration of protons dramatically reduces the EOF, the micelle’s net migration is towards the detector. This method was shown to achieve two orders of magnitude enhancement in detection. Quirino and Terabe have also reported stacking of neutral analytes in MEKC by field-enhanced injection [103], field-enhanced injection with reverse migrating micelles [104], and reverse migrating micelles with the injection of a water plug [105]. Enhancements in detection as determined from peak heights were found to be about 20-fold, 75-fold, and 100-fold with some compounds for each of the previous methods, respectively.
A 400-fold increase in peak heights was demonstrated utilizing a preinjection plug of high conductivity and high viscosity [5]. In this technique a 38 mm plug of 500 mM phosphate was first followed by injection of a 3.8 mm plug of water, then electrokinetic injection of low-conductivity sample solution. Next a negative voltage is applied while the capillary inlet is submersed in 500 mM surfactant for a short period of time. The separation is carried out in normal polarity mode with micellar BGE at the capillary inlet. Again, a major factor limiting the appeal of this method is the ability of the analyst to repeat the injection sequence in a precise manner.
7.2 Sweeping
Sweeping (Fig. 5) is a technique for on-column sample concentration of nonpolar molecules resulting in an 80- to 5000-fold enhancement (Fig. 6) based on the analytes’ ability to partition into the pseudostationary phase in MEKC [108–110]. Samples are injected onto the column in a buffer solution with a similar conductivity as that of the BGE, but in the absence of a pseudostationary phase. The capillary inlet is then placed into an anionic micellar BGE solution and the separation is performed in reverse polarity mode. The BGE is kept at a low pH to suppress the EOF, allowing the anionic micelles to electrophoretically migrate towards the detector. As the micelles migrate towards the detector they “sweep” the neutral analytes along. This effect is dependent on a uniform electric field and the absence of micelles in the sample solution. The effectiveness of this sample concentration technique has been shown to be dependent on the analytes’ affinity for the pseudostationary phase. The length of the sweep zone (Isweep) is related to the length of the analyte zone (Iinjected) by the equation
Figure 5.
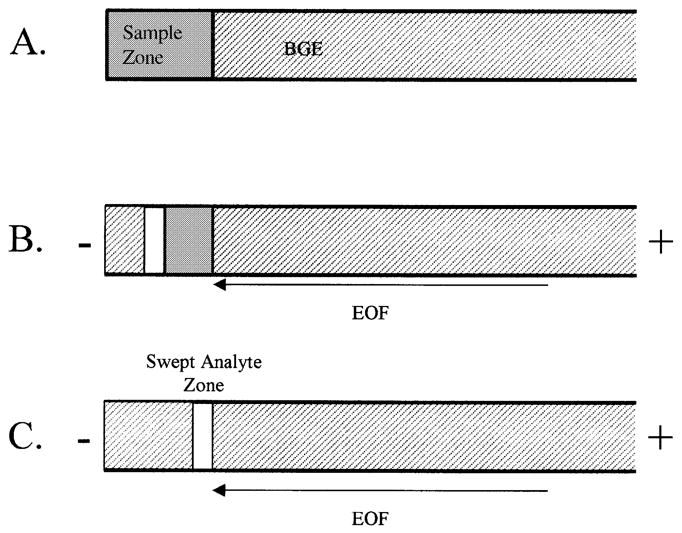
Schematic of sweeping for MEKC. (A) A sample in buffer of the same conductivity as the BGE but without micelles is injected into the capillary. (B) The inlet reservoir is replaced with BGE and a reverse polarity high voltage is applied. The anionic micelles from the BGE migrate across the sample zone, incorporating the neutral analytes into a narrow stacked band. (C) The analytes are stacked into a narrow band and the separation proceeds towards the detector. Although the EOF is in the direction of the capillary inlet, the low pH of the BGE suppresses the EOF so that the net migration of the micelles is towards the detector.
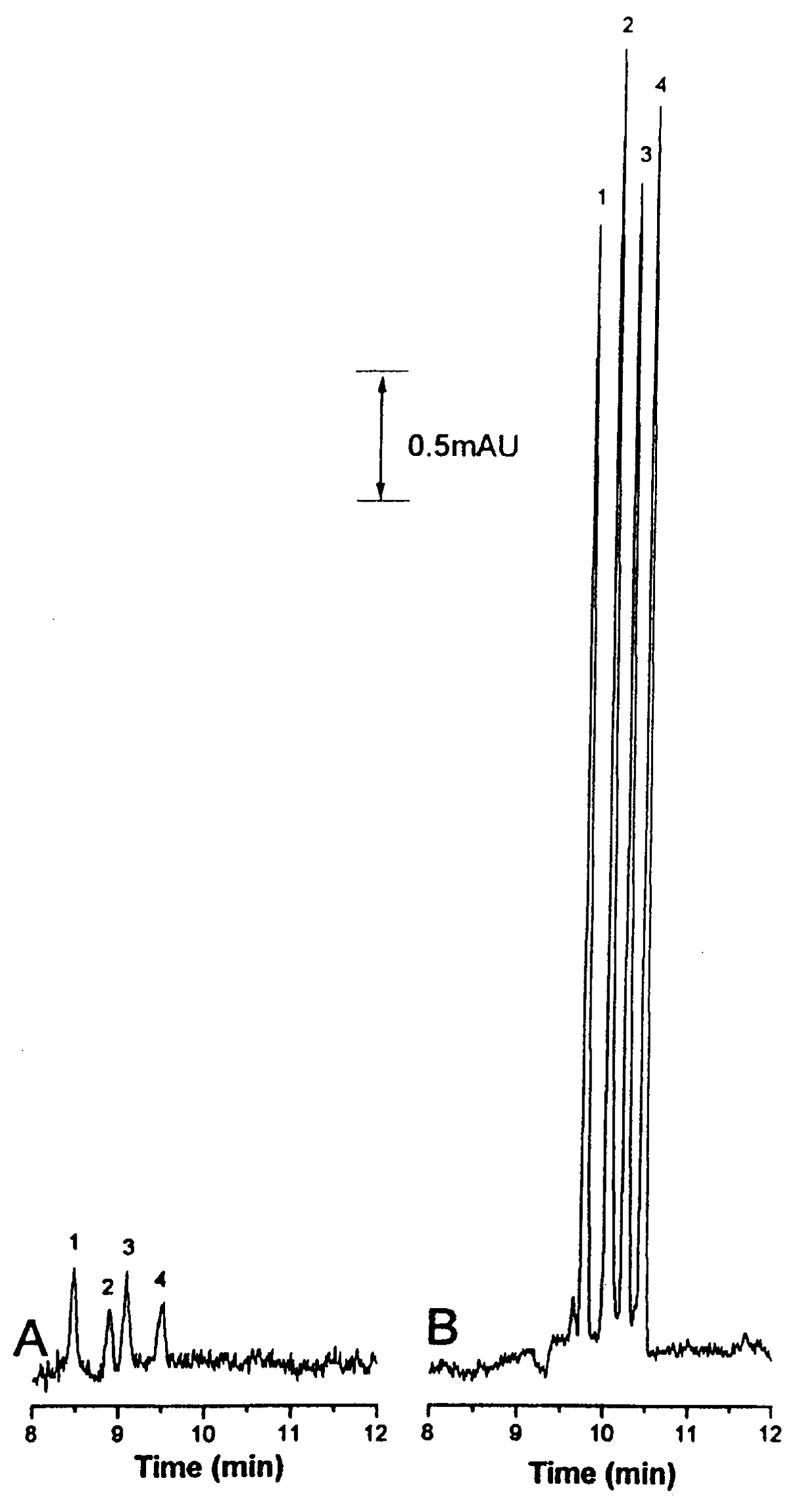
Figure 6.
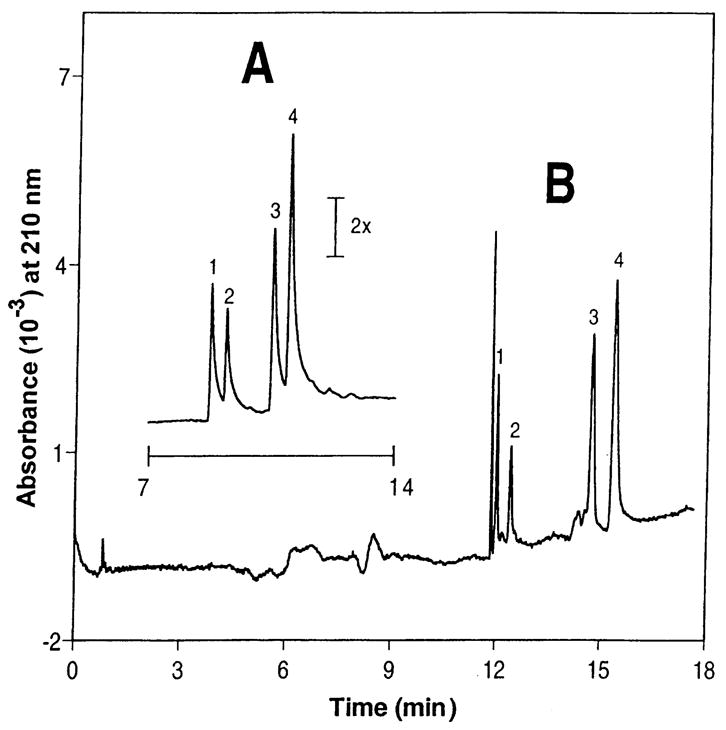
Example of sweeping for concentration of neutral analytes. (A) Injection of analytes between 190 and 265 ppm. (B) Injection of analytes between 19 and 26.5 ppb. Peak identities: 1, trimipramine; 2, nicardipine; 3, noscapine; 4, laudanosine.
| (5) |
where k is the retention factor.
8 Future trends
Sample stacking is often simple to perform and has a wide range of applications. Most analyses use water as the sample diluent with large injection volume or field amplification methods. With the availability of better commercial instruments, automation will provide increased reproducibility in the steps used to perform these stacking techniques. This makes it more likely that validated CE methods for routine analysis will take advantage of stacking procedures to enhance the detection of analytes in low concentrations or biological matrices.
A new direction in sample stacking involves analysis of samples in high ionic strength matrices. Hadwiger and co-workers [31] have illustrated the use of pH-mediated sample stacking for on-column concentration of isoproterenol in dialysate. Double-capillary pH-mediated stacking is also an important new area, with a 300-fold sample concentration being possible [33]. While the high ionic strength of the sample buffer is detrimental to normal CE separations, some sample stacking methods are actually improved when high ionic strength sample matrix is used instead of water. For example, Shihabi [6] has shown FASS to be enhanced when diluting samples with aceto-nitrile if the sample is initially in 1% saline. Further application and new methods of stacking of physiological solutions would be helpful in studying drug transport, metabolism, and pharmacokinetics and may help move CE out of the academic laboratory and further into the industrial setting.
Microfabrication is an area in which CE is now playing a major role. Jacobson and Ramsey [111] demonstrated field effect stacking of dansylated amino acids on a quartz microchip with a 31-fold concentration of sample. Detection limits of 70 nM were reported for dansyl-lysine. Micro-fabrication technology will provide the ability to create new stacking procedures, making it easier to design stacking systems with multiple channels and electrical circuits. In general, sample stacking applied to microfabricated CE systems would allow for on-column concentration with the advantages of the high efficiency and fast analysis of separations in the chip format.
Table 1.
Comparison of stacking efficiencies and reproducibility for preconcentration methods
| Technique | Limits of detection | Stacking efficiency (x-fold increase in peak height) | Reproducibility (RSD peak height, n ≥3) |
|---|---|---|---|
| FASS | 80 nM [11] | 1000 [14] | 3–6% [11] 2.5–25% [14] |
| LVSS | 2 ppb[29] | 100 [29] | 5–12% [29] |
| pH-mediated | 35–50 μM [25] 300 nM [33] | 8–20 [25] 66 [33] | 1.4–8.8% [25] 1.4–1.7% [33] |
| IIP -single capillary | 50 nM[58] | 100–200(43,58] | 0.7–1.5% [43, 44] |
| IIP -double capillary | 10 nM[49] | 300–10000[49,52] | 0.3–2.6% [50–52] |
| Chromatographic preconcentration | 5 nM [66] | 100–200[62,66] | 3.8–6.2% [62, 66] |
| Matrix switching | 0.6–10 nM [95, 96] | 500–7000 [95, 96] | 10% [96] |
| FASS with MEKC | 15.5–21.6 ppb [105] | 28–102 [105] | 1.2–4.6% [105] |
| Sweeping | 1.7–9.6 ppb [110] | 88–5044 [110] | 3.9–13.8% [110] |
Abbreviations
- FASS
field-amplified sample stacking
- LVSS
large-volume sample stacking
References
- 1.Mikkers FEP, Everaerts FM, Verheggen TPEM. J Chromatogr. 1979;169:11–20. [Google Scholar]
- 2.Burgi DS, Chien RL. Anal Chem. 1991;63:2042–2047. [Google Scholar]
- 3.Chien RL, Helmer JC. Anal Chem. 1991;63:1354–1361. [Google Scholar]
- 4.Chien RL, Burgi DS. J Chromatogr. 1991;559:141–152. [Google Scholar]
- 5.Zhang CX, Thormann W. Anal Chem. 1998;70:540–548. doi: 10.1021/ac9707085. [DOI] [PubMed] [Google Scholar]
- 6.Shihabi ZK. J Chromatogr A. 1999;853:3–9. doi: 10.1016/s0021-9673(99)00316-7. [DOI] [PubMed] [Google Scholar]
- 7.Sjogren A, Dasgupta PK. Anal Chem. 1996;68:1933–1940. doi: 10.1021/ac951126v. [DOI] [PubMed] [Google Scholar]
- 8.Friedberg MA, Hinsdale M, Shihabi ZK. J Chromatogr A. 1997;781:35–42. doi: 10.1016/s0021-9673(97)00583-9. [DOI] [PubMed] [Google Scholar]
- 9.Beckers JL, Ackermans MT. J Chromatogr. 1993;629:371–378. [Google Scholar]
- 10.Tan WG, Tyrrell DLJ, Dovichi NJ. J Chromatogr A. 1999;853:309–319. doi: 10.1016/s0021-9673(99)00712-8. [DOI] [PubMed] [Google Scholar]
- 11.Zhang CX, Aebi Y, Thormann W. Clin Chem. 1996;42:1805–1811. [PubMed] [Google Scholar]
- 12.Tagliaro F, Manetto G, Crivellente F, Scarcella D, Marigo M. Forens Sci Int. 1998;92:201–211. doi: 10.1016/s0379-0738(98)00016-4. [DOI] [PubMed] [Google Scholar]
- 13.Wey AB, Zhang CX, Thormann W. J Chromatogr A. 1999;853:95–106. doi: 10.1016/s0021-9673(99)00577-4. [DOI] [PubMed] [Google Scholar]
- 14.Zhang CX, Thormann W. Anal Chem. 1996;68:2523–2532. doi: 10.1021/ac951250e. [DOI] [PubMed] [Google Scholar]
- 15.Morales S, Cela R. J Chromatogr A. 1999;846:401–411. [Google Scholar]
- 16.Wang F, Khaledi MG. J Chromatogr B. 1999;731:187–197. doi: 10.1016/s0378-4347(99)00217-0. [DOI] [PubMed] [Google Scholar]
- 17.Chien RL, Burgi DS. Anal Chem. 1992;64:489A–496A. [Google Scholar]
- 18.Albin M, Grossman PD, Moring SE. Anal Chem. 1993;65:489A–497A. [Google Scholar]
- 19.Chien RL, Burgi DS. Anal Chem. 1992;64:1046–1050. [Google Scholar]
- 20.McGrath G, Smyth WF. J Chromatogr B. 1996;681:125–131. doi: 10.1016/0378-4347(95)00486-6. [DOI] [PubMed] [Google Scholar]
- 21.Harland GB, McGrath G, McClean S, Smyth WF. Anal Commun. 1997;34:9–11. [Google Scholar]
- 22.Smyth WF, Harland GB, McClean S, McGrath G, Oxspring D. J Chromatogr A. 1997;772:161–169. [Google Scholar]
- 23.McClean S, O’Kane E, Coulter DJM, McLean S, Smyth WF. Electrophoresis. 1998;19:11–18. doi: 10.1002/elps.1150190105. [DOI] [PubMed] [Google Scholar]
- 24.Hissner F, Daus B, Mattusch J, Heinig K. J Chromatogr A. 1999;853:497–502. doi: 10.1016/s0021-9673(99)00381-7. [DOI] [PubMed] [Google Scholar]
- 25.Martinez D, Borrull F, Calull M. J Chromatogr A. 1997;788:185–193. [Google Scholar]
- 26.Albert M, Debusschere L, Demesmay C, Rocca JL. J Chromatogr A. 1997;757:281–289. doi: 10.1016/s0021-9673(97)00413-5. [DOI] [PubMed] [Google Scholar]
- 27.Burgi DS. Anal Chem. 1993;65:3726–3729. [Google Scholar]
- 28.Albert M, Debusschere L, Demesmay C, Rocca JL. J Chromatogr A. 1997;757:291–296. doi: 10.1016/s0021-9673(97)00413-5. [DOI] [PubMed] [Google Scholar]
- 29.Quirino JP, Terabe S. J Chromatogr A. 1999;850:339–344. doi: 10.1016/s0021-9673(99)00204-6. [DOI] [PubMed] [Google Scholar]
- 30.Pálmarsdóttir S, Mathiasson L, Jonsson JA, Edholm LE. J Chromatogr B. 1997;688:127–134. doi: 10.1016/s0378-4347(97)88064-4. [DOI] [PubMed] [Google Scholar]
- 31.Hadwiger ME, Torchia SR, Park S, Biggin ME, Lunte CE. J Chromatogr B. 1996;681:241–249. doi: 10.1016/0378-4347(95)00549-8. [DOI] [PubMed] [Google Scholar]
- 32.Park S, Lunte CE. J Microcol Sep. 1998;10:511–517. [Google Scholar]
- 33.Zhao Y, Lunte CE. Anal Chem. 1999;71:3985–3991. doi: 10.1021/ac990242l. [DOI] [PMC free article] [PubMed] [Google Scholar]
- 34.Xiong Y, Park S, Swerdlow H. Anal Chem. 1998;70:3605–3611. doi: 10.1021/ac980376j. [DOI] [PubMed] [Google Scholar]
- 35.Aebersold R, Morrison HD. J Chromatogr. 1990;516:79–88. doi: 10.1016/s0021-9673(01)90206-7. [DOI] [PubMed] [Google Scholar]
- 36.Schwer C, Lottspeich F. J Chromatogr. 1992;623:345–355. doi: 10.1016/0021-9673(92)80375-5. [DOI] [PubMed] [Google Scholar]
- 37.Mazereeuw M, Tjaden UR, Reinhoud NJ. J Chromatogr Sci. 1995;33:686–697. [Google Scholar]
- 38.Foret F, Szökö E, Karger BL. J Chromatogr. 1992;608:3–12. [Google Scholar]
- 39.Kr̆ivánková L, Boc̆ek P. J Chromatogr B. 1997;689:13–34. [PubMed] [Google Scholar]
- 40.Thormann W, Dieter A, Ernst S. Electrophoresis. 1985;6:10–18. [Google Scholar]
- 41.Hirokawa T, Watanabe K, Yokota Y, Kiso Y. J Chromatogr. 1993;633:233–259. [Google Scholar]
- 42.Gebauer P, Thormann W, Boc̆ek P. J Chromatogr. 1992;608:47–57. [Google Scholar]
- 43.Schoots AC, Verheggen TPEM, De Vries PMEM, Everaerts FM. Clin Chem. 1990;36:435–440. [PubMed] [Google Scholar]
- 44.Reinhoud NJ, Tjaden UR, van der Greef J. J Chromatogr. 1993;641:155–162. doi: 10.1016/0378-4347(92)80047-t. [DOI] [PubMed] [Google Scholar]
- 45.van der Scans MJ, Beckers JL, Molling MC, Everaerts FM. J Chromatogr A. 1995;717:139–147. [Google Scholar]
- 46.Mikkers FEP, Everaerts FM, Verheggen TPEM. J Chromatogr. 1979;169:21–38. [Google Scholar]
- 47.Kr̆ivánková L, Gebauer P, Boc̆ek P. J Chromatogr A. 1995;716:35–48. [Google Scholar]
- 48.Kr̆ivánková L, Pantuckova P, Boc̆ek P. J Chromatogr A. 1999;838:55–70. doi: 10.1016/s0021-9673(99)00114-4. [DOI] [PubMed] [Google Scholar]
- 49.Dankova M, Kaniansky D, Fanali S, Ivanyi F. J Chromatogr A. 1999;838:31–43. doi: 10.1016/s0021-9673(98)00974-1. [DOI] [PubMed] [Google Scholar]
- 50.Kr̆ivánková L, Foret F, Boc̆ek P. J Chromatogr. 1991;545:307–313. doi: 10.1016/s0021-9673(01)88721-5. [DOI] [PubMed] [Google Scholar]
- 51.Kaniansky D, Marak J. J Chromatogr. 1990;498:191–204. [Google Scholar]
- 52.Hirokawa T, Ohmori A, Kiso Y. J Chromatogr. 1993;634:101–106. [Google Scholar]
- 53.Kaniansky D, Marak J, Lastinec J, Reijenga JC, Onuska FI. J Microcol Sep. 1999;11:141–153. [Google Scholar]
- 54.Stegehuis DS, Irth H, Tjaden UR, van der Greef J. J Chromatogr. 1991;538:393–402. doi: 10.1016/s0021-9673(01)88860-9. [DOI] [PubMed] [Google Scholar]
- 55.Bor̆ek P, Deml M, Kaplanova B, Janak J. J Chromatogr. 1978;160:1–9. [Google Scholar]
- 56.Mikkers FEP, Everaerts FM, Peek JAF. J Chromatogr. 1979;168:317–332. [Google Scholar]
- 57.Kaniansky D, Zelensky I, Hybenova A, Onuska FI. Anal Chem. 1994;66:4258–4264. [Google Scholar]
- 58.Larsson M, Nagard S. J Microcol Sep. 1994;6:107–113. [Google Scholar]
- 59.Foret F, Sustác̆ek V, Boc̆ek P. J Microcol Sep. 1990;2:229–233. [Google Scholar]
- 60.Schwer C, Lottspeich F. J Chromatogr. 1992;623:345–355. doi: 10.1016/0021-9673(92)80375-5. [DOI] [PubMed] [Google Scholar]
- 61.Michalke B, Schramel P. Electrophoresis. 1998;19:2220–2225. doi: 10.1002/elps.1150191229. [DOI] [PubMed] [Google Scholar]
- 62.Hoyt AM, Jr, Beale SC, Larmann JP, Jr, Jorgenson JW. J Microcol Sep. 1993;5:325–330. [Google Scholar]
- 63.Strausbauch MA, Madden BJ, Wettstein PJ, Landers JP. Electrophoresis. 1995;16:541–548. doi: 10.1002/elps.1150160189. [DOI] [PubMed] [Google Scholar]
- 64.Strausbauch MA, Xu SJ, Ferguson JE, Nunez ME, Machacek D, Lawson GM, Wettstein PJ, Landers JP. J Chromatogr A. 1995;717:279–291. doi: 10.1016/0021-9673(95)00743-6. [DOI] [PubMed] [Google Scholar]
- 65.Beattie JH, Self R, Richards MP. Electrophoresis. 1995;16:322–328. doi: 10.1002/elps.1150160153. [DOI] [PubMed] [Google Scholar]
- 66.He J, Shibukawa A, Zeng M, Amane S, Sawada T, Nakagawa T. Anal Sci. 1996;12:177–181. [Google Scholar]
- 67.Figeys D, Ducret A, Aebersold R. J Chromatogr A. 1997;763:295–306. doi: 10.1016/s0021-9673(96)00847-3. [DOI] [PubMed] [Google Scholar]
- 68.Knudsen CB, Beattie JH. J Chromatogr A. 1997;792:463–473. doi: 10.1016/s0021-9673(97)00857-1. [DOI] [PubMed] [Google Scholar]
- 69.Li J, Thibault P, Martin A, Richards JC, Wakarchuk WW, van der Wilp W. J Chromatogr A. 1998;817:325–336. doi: 10.1016/s0021-9673(98)00341-0. [DOI] [PubMed] [Google Scholar]
- 70.Tomlinson AJ, Benson LM, Braddock WD, Oda RP, Naylor S. J High Resol Chromatogr. 1994;17:729–731. [Google Scholar]
- 71.Guzman NA, Trebilcock MA, Advis JP. J Liq Chromatogr. 1991;14:997–1015. [Google Scholar]
- 72.Morita I, Sawada J. J Chromatogr. 1993;641:375–381. [Google Scholar]
- 73.Swartz ME, Merion M. J Chromatogr. 1993;632:209–213. [Google Scholar]
- 74.Cai J, EI Rassi Z. J Liq Chromatogr. 1992;15:1179–1192. [Google Scholar]
- 75.Cai J, EI Rassi Z. J Liq Chromatogr. 1993;16:2007–2024. [Google Scholar]
- 76.Tomlinson AJ, Benson LM, Guzman NA, Naylor S. J Chromatogr A. 1996;744:3–15. [Google Scholar]
- 77.Debets AJJ, Mazereeuw M, Voogt WH, van Iperen DJ, Lingeman H, Hupe KP, Brinkman UAT. J Chromatogr. 1992;608:151–158. [Google Scholar]
- 78.Bushey MM, Jorgenson JW. Anal Chem. 1990;62:978–984. doi: 10.1021/ac00201a015. [DOI] [PubMed] [Google Scholar]
- 79.Lemmo AV, Jorgenson JW. Anal Chem. 1993;65:1576–1581. [Google Scholar]
- 80.Hooker TF, Jorgenson JW. Anal Chem. 1997;69:4134–4142. [Google Scholar]
- 81.Pálmarsdóttir S, Mathiasson L, Jonsson JA, Edholm L-E. J Capil Electrophor. 1996;3:255–260. [PubMed] [Google Scholar]
- 82.Veraart JR, Gooijer C, Lingeman H, Velthorst NH, Brinkman UAT. Chromatographia. 1997;44:581–588. [Google Scholar]
- 83.Veraart JR, Gooijer C, Lingeman H, Velthorst NH, Brinkman UAT. J Chromatogr B. 1998;719:199–208. doi: 10.1016/s0378-4347(98)00410-1. [DOI] [PubMed] [Google Scholar]
- 84.Arce L, Kuban P, Rios A, Valcarcel M, Karlberg B. Anal Chim Acta. 1999;390:39–44. [Google Scholar]
- 85.Chen HW, Fang Z-L. Anal Chim Acta. 1997;355:135–143. [Google Scholar]
- 86.Tomlinson AJ, Naylor S. J High Resol Chromatogr. 1995;18:384–386. [Google Scholar]
- 87.Tomlinson AJ, Benson LM, Braddock WD, Oda RP, Naylor S. J High Resol Chromatogr. 1995;18:381–383. doi: 10.1016/0378-4347(95)00127-5. [DOI] [PubMed] [Google Scholar]
- 88.Tomlinson AJ, Naylor S. J Liq Chromatogr. 1995;18:3591–3615. [Google Scholar]
- 89.Tomlinson AJ, Naylor S. J Capil Electrophor. 1995;2:225–233. [PubMed] [Google Scholar]
- 90.Benson LM, Tomlinson AJ, Mayeno AN, Gleich GJ, Wells D, Naylor S. J High Resol Chromatogr. 1996;19:291–294. [Google Scholar]
- 91.Tomlinson AJ, Benson LM, Jameson S, Johnson DH, Naylor S. J Am Soc Mass Spectrom. 1997;8:15–24. [Google Scholar]
- 92.Rohde E, Tomlinson AJ, Johnson DH, Naylor S. J Chromatogr B. 1998;713:301–311. doi: 10.1016/s0378-4347(98)00209-6. [DOI] [PubMed] [Google Scholar]
- 93.Naylor S, Tomlinson AJ. Talanta. 1998;45:603–612. doi: 10.1016/s0039-9140(97)00186-0. [DOI] [PubMed] [Google Scholar]
- 94.Yang Q, Tomlinson AJ, Naylor S. Anal Chem. 1999;71:183A–189A. doi: 10.1021/ac990246q. [DOI] [PubMed] [Google Scholar]
- 95.Petersson M, Wahlund KG, Nilsson S. J Chromatogr A. 1999;841:249–261. [Google Scholar]
- 96.Zhao Y, Mclaughlin K, Lunte CE. Anal Chem. 1998;70:4578–4585. doi: 10.1021/ac980427c. [DOI] [PMC free article] [PubMed] [Google Scholar]
- 97.Pálmarsdóttir S, Edholm LE. J Chromatogr A. 1995;693:131–143. [Google Scholar]
- 98.Liu Z, Sam P, Sirimanne SR, McClure PC, Grainger J, Patterson DG., Jr J Chromatogr A. 1994;673:125–132. doi: 10.1016/0021-9673(94)87065-9. [DOI] [PubMed] [Google Scholar]
- 99.Nielsen KR, Foley JP. J Chromatogr A. 1994;686:283–291. [Google Scholar]
- 100.Quirino JP, Terabe S. J Chromatogr A. 1997;781:119–128. doi: 10.1016/s0021-9673(00)00812-8. [DOI] [PubMed] [Google Scholar]
- 101.Quirino JP, Terabe S. J Chromatogr A. 1997;791:225–267. [Google Scholar]
- 102.Quirino JP, Terabe S. Anal Chem. 1998;70:149–157. doi: 10.1021/ac9706281. [DOI] [PubMed] [Google Scholar]
- 103.Quirino JP, Terabe S. J Chromatogr A. 1998;798:251–257. [Google Scholar]
- 104.Quirino JP, Terabe S. Anal Chem. 1998;70:1893–1901. doi: 10.1021/ac9711504. [DOI] [PubMed] [Google Scholar]
- 105.Quirino JP, Otsuka K, Terabe S. J Chromatogr B. 1998;714:29–38. doi: 10.1016/s0378-4347(98)00063-2. [DOI] [PubMed] [Google Scholar]
- 106.Wu YS, Lee HK, Li SFY. J Microcol Sep. 1998;10:529–535. [Google Scholar]
- 107.Szucs R, Vindevogel J, Sandra P, Verhagen LC. Chromatographia. 1993;36:323–329. [Google Scholar]
- 108.Quirino JP, Terabe S, Otsuka K, Vincent JB, Vigh G. J Chromatogr A. 1999;838:3–10. [Google Scholar]
- 109.Quirino JP, Terabe S. Anal Chem. 1999;71:1638–1644. [Google Scholar]
- 110.Quirino JP, Terabe S. Science. 1998;282:465–468. doi: 10.1126/science.282.5388.465. [DOI] [PubMed] [Google Scholar]
- 111.Jacobson SC, Ramsey JM. Electrophoresis. 1995;16:481–486. doi: 10.1002/elps.1150160179. [DOI] [PubMed] [Google Scholar]