

Abstract
We have previously studied the unfolding equilibrium of bacterio-opsin in a single phase solvent, using Förster mechanism fluorescence resonance energy transfer (FRET) as a probe, from tryptophan donors to a dansyl acceptor. We observed an apparent unfolding transition in bacterio-opsin perturbed by increasing ethanol concentrations [Nannepaga et al.(2004) Biochemistry 43, 50–59]. We have further investigated this transition and find the unfolding is pH-dependent. We have now measured the apparent pK of acid-induced unfolding of bacterio-opsin in 90% ethanol. When the acceptor is on helix B (Lys 41), the apparent pK for unfolding is 4.75; on the EF connecting loop (Cys 163), 5.15; and on helix G (Cys 222), 5.75. Five-helix proteolytic fragments are less stable. The apparent unfolding pKs are, for residues 72-248 (Cys 163), 5.46; and 1-166 (Lys 41), 7.36. When interpreted in terms of a simple equilibrium model for unfolding, the apparent pKs give relative free energies of unfolding, in the range of −0.54 to −3.5 kcal/mol. The results suggest that the C-terminal helix of bacterio-opsin is less stably folded than the N-terminal helices. We analyzed the pair-wise helix-helix interaction surfaces of bacteriorhodopsin and three other 7-transmembrane helix proteins, based on crystal structures. The results show that the interaction surfaces are smoother and the helix axis separations are closer in the amino-terminal two-thirds of the proteins compared with the carboxyl terminal one-third. However, the F helix is important in stabilizing the folded structure, as shown by the instability of the 1-166 fragment. Considering the high resolution crystal structure of bacteriorhodopsin, there are no obvious helix-helix interactions involving protein side chains which would be destabilized by protonation at the estimated pH of the unfolding transitions. However, a number of helix-bridging water molecules could become protonated, thereby weakening the helix-helix interactions.
In comparison with water-soluble proteins, integral membrane protein folding mechanisms are poorly understood. Results of several folding studies, both in vivo (1) and in vitro (2–6), have been published on membrane proteins containing transmembrane helices. In some in vitro experiments, the membrane proteins were solubilized in detergent micelles, and unfolding was induced by an anionic amphiphile perturbant, docecyl sulfate. In order to obtain free energies of unfolding, it is necessary to assume that the free energy changes are linear with perturbant concentration (7). Due to non-ideal mixing when charged amphiphiles are added to neutral micelles, the assumption of linearity does not necessarily hold (8). An alternative approach would be to examine unfolding in a single phase solvent system. We have been studying the unfolding equilibrium of bacterio-opsin (BO)1 in ethanol/water mixtures. We found an apparent unfolding transition in BO perturbed by increasing ethanol concentrations (9). However, this measurement was complicated by the pK change of the buffer as the solvent composition varied from 0 to 90% ethanol. Thus, the unfolding transition was a composite of solvent-induced and acid-induced unfolding. We have now studied the acid unfolding process by itself, measuring the unfolding equilibria as a function of pH at constant solvent composition. Förster mechanism fluorescence resonance energy transfer (FRET) provides a signal which indicates the folded state. The energy donors are tryptophans and the energy acceptor is a dansyl group introduced at specific locations in the protein sequence. From these results we are able to obtain relative stabilities of helix-helix interactions in different regions of the protein molecule, suggesting some constraints on possible folding mechanisms.
Materials and Methods
Materials
Purple membrane was prepared from Halobacterium salinarum (10). Wild type H. salinarum was strain S9, and cysteine mutants (M163C and I222C) were obtained from Janos K. Lanyi, U. of California, Irvine. Dansyl chloride, 3-[(3-cholamidopropyl)dimethylammonio]-1-propanesulfonate (CHAPS), and chymotrypsin were obtained from Sigma (St. Louis, MO). Staphylococcus aureus V8 protease was obtained from MP Biomedicals (Irvine, CA). Didansyl cystine and tris(2-carboxyethyl) phosphine (TCEP) were obtained from Molecular Probes (Eugene, OR). HPLC grade ethanol was obtained from EMD Chemicals (Gibbstown, NJ). 90% formic acid was obtained from J.T. Baker (Phillipsburg, NJ). Sequanal grade trifluoroacetic acid was obtained from Pierce (Rockford, IL). Octyl glucoside was obtained from Calbiochem (La Jolla, CA). Dimyristoyl phosphatidylcholine (DMPC) was obtained from Avanti Polar Lipids (Alabaster, AL). Other chemicals were reagent grade, obtained from standard sources.
Fluorescent labeling
Purple membrane was reacted with dansyl chloride as previously described (9,11,12). Purple membrane isolated from H. salinarum containing single cysteine bacteriorhodopsin (BR) mutants was labeled with didansyl cystine as follows. Purple membrane was suspended in deionized water at 10 μM BR and 10 μL 0.1 M TCEP was added. After 30 min at room temperature, the sample was centrifuged at 13,000 × g. The supernatant was discarded and the pellet was resuspended in 0.05 M NaCl and the centrifugation repeated. The pellet was suspended in 0.1 mL 0.1 M phosphate buffer, pH 8.0, containing 0.1 M NaCl. To this was added 10 μL 10 mM EDTA and 1.9 mL 1 mM didansyl cystine in 0.1 M phosphate buffer, pH 8.0, containing 0.1 M NaCl. After reaction for 4 hr at room temperature in the dark, the reaction was stopped by adding 0.2 mL 0.5 M iodoacetamide. After 30 minutes, the membrane was washed by centrifugation and resuspension in fresh buffer until the supernatant was free of noticeable fluorescence. Fluorescent-labeled purple membrane was lyophilized, solubilized in 90% formic acid, and purified on a column of LH-60. Column solvent was CHCl3:methanol 1:1 containing 0.1 M ammonium acetate. Incorporation of label was estimated by UV spectroscopy (Aviv-Cary 14 spectrophotometer), using an extinction coefficient at 280 nm of 65,700 M−1 cm−1 for bacterio-opsin (13) and 4500 for the dansyl group. The stoichiometry was 1 at Lys 41 for dansyl chloride, and 0.2 at Cys 163 and 0.8 at Cys 222 for didansyl cystine. Parallel reactions of wild type BO with didansyl cystine showed no detectable incorporation of fluorescent label. Cleavage of dansyl-Lys 41-BO with S. aureus V8 protease and purification of the dansyl-V1 fragment was done as previously described (13, 14). Cleavage with chymotrypsin was done as described by Gerber et al. (15), using purple membrane from the M163C mutant. The proteolyzed membrane was then reacted with didansyl cystine and the dansyl-C1 fragment was purified on LH-60 (13). Fluorescent-labeled BO samples (generally 20–30 μM in column solvent) were stored at −20°C.
Ultrafiltration
Aliquots of fluorescent-labeled BO (0.12 nmol) were dried in a centrifugal evaporator and solubilized in 3 μL 90% formic acid. The samples were then diluted with 10 μL ethanol followed by 0.5 mL 0.1 M ammonium acetate, 40 mM octyl glucoside. Each sample was then concentrated on a Microcon-30 centrifugal concentrator (Millipore, Billerica, MA) at 14000 × g to a volume of approximately 0.1 mL. Each was then diluted with 0.4 mL of 0.1 M ammonium acetate, 40 mM octyl glucoside and again concentrated to about 0.1 mL. The samples were then pooled.
Titrations
Spectrofluorometric titrations were measured on samples containing 0.1 mL of ultrafiltered BO, 0.9 mL ethanol, and varying amounts of organic acid. In pilot studies, the amount of acid needed to eliminate the sensitized emission signal of ultrafiltered samples was determined. Using this information, a 100 mL sample of 90% ethanol containing 10 mM ammonium acetate was titrated with formic acid and trifluoroacetic acid. A combination glass electrode with a Ag/AgCl reference electrode (Futura 511063, Beckman Coulter, Fullerton, CA) and a Radiometer (Copenhagen, Denmark) PHM 64 pH meter were used to measure pH. The measured pH values determined the amount of acid needed to obtain a particular pH in the 1.0 mL fluorescence spectroscopy samples. The pH was not corrected for the junction potentials in 90% ethanol. However, the correction would be a constant offset applied to all pH values (16). The symbol pH* is used to indicate that the measured pH values are correct relative to one another, but the absolute pH is not known. The maximum volume of acid added to 1.0 mL, for the lowest pH samples, was 50 μL of 9% formic acid and 11 μL of 10% trifluoroacetic acid. Fluorescence excitation spectra were measured on a Photon Technology, Inc. (Lawrenceville, NJ) QuantaMaster QM4. The sensitized emission at 490 nm from 285 nm excitation was normalized to the 490 emission from 340 nm direct excitation of dansyl. The emission vs. pH* data were fit to a titration curve, assuming the titration of a single type of non-interacting group linked to unfolding.
Proteolytic fragment association
Dansyl-Lys 41 V1 in 0.2 % sodium dodecyl sulfate, 0.05 M phosphate, pH 6.0 was mixed with varying amounts of V2 in the same buffer and then added to CHAPS/DMPC, as previously described for C1 and C2 (9).
Computation of transmembrane helix surface properties
Surface roughness of transmembrane helices was calculated as described previously (17). The minimum axial distances of helix pairs were calculated as follows. The Cα atomic coordinates of each helix were averaged in contiguous groups of four, thus generating a set of points on a line passing through the helix axis. The distances between the sets of points for each pair of helices were calculated and the minimum distance was selected for each pair.
Results
Effect of pH changes on unfolding equilibrium of BO in ethanol
In our previous studies, we used the change in FRET between tryptophan donors (Trp 86 and Trp 182) and a dansyl acceptor on Lys 41 (figure 1) as a signal for unfolding of BO (9). Sensitized emission at the dansyl emission maximum of 490 nm was observed from 285 nm tryptophan excitation in aqueous micelles, but the sensitized emission disappeared in 90% ethanol. The samples were prepared from aliquots of dried protein which had been solubilized in a small amount of 90% formic acid. We showed that the high acetate buffer concentration in the final samples held the pH at 4.6 in water. Although we did not attempt to measure the pH in the non-aqueous solutions, we assumed that the acidity of formate and acetate would be similarly diminished by the non-aqueous solvent. However, on further examination we now find that in 90% ethanol, with 0.15 M acetate and 0.07 M formic acid, the acetate almost completely loses its buffering capacity, but the formic acid is mostly dissociated (18). Therefore, not only did our protein samples in the previous study undergo a decrease in solvent polarity as the solvent varied between water and 90% ethanol, but there was also an increase in acidity. It is necessary to separate solvent-induced unfolding effects from possible acid-induced unfolding.
Figure 1. Fluorescence resonance energy transfer donors and acceptors.

Amino acid sequence of bacterio-opsin is shown with α-helices drawn as helical nets. Helices are lettered A-G from amino to carboxyl terminus. Energy donors and acceptors are numbered by sequence position: predominant tryptophan donors, 86 and 182; dansyl acceptors (attached in separate experiments), 41, 163 or 222. For acceptor attachment to positions 163 and 222, cysteine mutants were used. Proteolytic fragments (C1, V1, and V2) are identified by brackets.
We prepared dansyl-Lys 41-labeled BO samples as in the previous study and then washed out the formic acid by ultrafiltration. As shown in fig. 2, curve A, when the formic acid is removed, a large sensitized emission peak is observed at 285 nm, characteristic of folded BO. Curve B shows an identical sample with 0.08 M formic acid added, demonstrating the low sensitized emission at 285 nm, characteristic of partially unfolded BO. When HCl is added to reach the same value of pH* as in formic acid, the same loss of sensitized emission is observed (data not shown), thus suggesting that the effect is due to acid, not formate. By varying the amount of organic acid added, we obtained a spectrofluorometric titration, as shown in fig. 3, left curve. The data can be fit with an apparent pK of 4.75. There is no evidence of cooperativity in the titration, suggesting there is a single group or class of groups that, when protonated, causes helix B (containing the FRET acceptor) to move away from helix C and helix F (containing the FRET donors). The unfolding reaction is complete within 100 msec, but on a time scale of minutes it is irreversible (S. R. Alloor & R. Renthal, unpublished experiments).
Figure 2. Partial unfolding of BO in 90% ethanol.
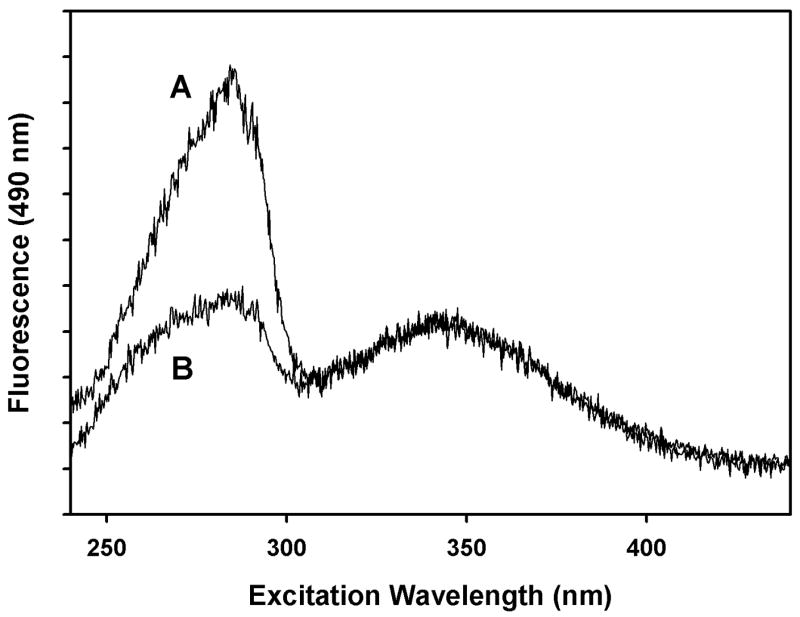
A. BO sample was washed on microcon-30 ultrafiltration membrane to remove formic acid. B. BO in 80 mM formic acid. Both samples contained 10 mM ammonium acetate buffer.
Figure 3. Acid-induced unfolding of bacterio-opsin.

Fraction of folded protein measured by FRET from tryptophan donors to dansyl acceptors. Acceptors: solid line (circles), dansyl groups on Lys 41 (helix B); short dashed line (triangles), dansyl groups on Cys 163 (EF loop); long dashed line (squares), dansyl groups on Cys 222 (helix G). Conditions: 9:1 ethanol:water (v:v), 10 mM ammonium acetate. Titrated with formic and trifluoroacetic acid. pH*: glass electrode measurements uncorrected for junction potentials in 90% ethanol. Lines calculated from pKs in table 1, and error bars indicate standard deviations from lines.
Using BR mutants in which cysteine had been introduced at specific positions, we moved the FRET acceptor location from the B helix to the loop connecting helices E and F (M163C) or to the F helix (I222C). The positions of donors and acceptors in structure of BR are illustrated schematically in figure 1. Viewed from the EF connecting loop, the partial unfolding has an apparent pK of 5.15 (fig. 3, middle curve). With the acceptor on helix G, the apparent pK shifts to 5.75 (fig. 3, right curve). Thus, the stability of the folded structure to acid is different in different regions of the protein.
We also examined the acid-induced unfolding of two different proteolytic fragments of BO, each containing five of the seven helices BR helices. A chymotrypsin fragment containing residues 72-248 (helices C-G) was purified from BO to which a dansyl group had been attached to Cys 163 (dansyl-Cys 163-C1). The fluorometric titration is shown in fig. 4 (circles). As in fig. 3, the fraction folded was calculated from the intensity of the 285 nm sensitized emission. The data fits a titration curve with an apparent pK of 5.46. A Staphylococcus aureus V8 protease fragment containing residues 1-166 (helices A-E) was purified from BO to which a dansyl group had been attached to Lys 41 (dansyl-Lys 41-V1). The fluorometric titration is shown in fig. 4 (triangles). The data fits a titration curve with an apparent pK of 7.36, and a Hill constant of 1.5. The removal of helices F and G destabilizes the remaining five helices far more than the effect of removing helices A and B. The apparent pKs are summarized in table 1.
Figure 4. Acid-induced unfolding of 5-helix fragments of bacterio-opsin.
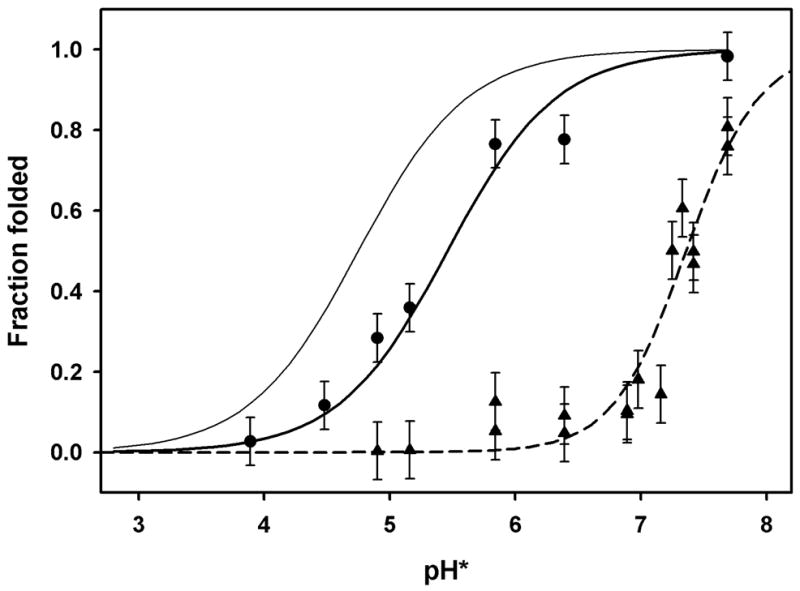
Fraction of folded protein measured by FRET from tryptophan donors to dansyl acceptors. Acceptors: heavy solid line (circles), dansyl groups on Cys 163 (EF loop) of fragment C1 (residues 72-248); dashed line (triangles), dansyl groups on Lys 41 (helix B) of fragment V1 (residues 1-166); thin line, curve fit for Lys 41 label on intact bacterio-opsin (same as solid line in fig. 3). Conditions same as fig. 3.
Table 1.
pH* dependence of acid-induced unfolding of BO
| Protein | FRET acceptor site | modification reaction | apparent pK | ΔΔGu (kcal/mol) |
|---|---|---|---|---|
| BO | K 41 | dansyl chloride | 4.75 | a |
| BO | C 163 | didansyl cystine
|
5.15 | −0.54 |
| BO | C 222 | didansyl cystine | 5.75 | −1.4 |
| C1 fragment | C 163 | didansyl cystine | 5.46 | −1.0 |
| V1 fragment | K 41 | dansyl chloride | 7.36 | −3.5 |
other entries in this column calculated relative to data for K41 site in BO, using equation 6.
Association of V1 and V2 fragments in detergent micelles
The striking instability of the V1 proteolytic fragment of BO led us to examine the interaction of the five-helix V1 fragment with the two-helix V2 fragment. It is known that in detergent micelles, V1 and V2 spontaneously associate to form BR in the presence of all-trans retinal (14,19). Also, we previously showed that the proteolytic fragments C1 and C2 interact with an association constant of 7.7 × 10⁶ M−1 in the absence of retinal (9). To a constant concentration of dansyl-Lys 41-V1 in CHAPS/DMPC micelles, varying amounts of V2 were added. The increase in the sensitized emission at 285 nm due to FRET between Trp 182 and dansyl Lys 41 was used as a measure of the amount of V1 V2 complex formed. The results are shown in fig. 5. We analyzed the data by a similar method to that reported in Nannepaga et al. (9) for the association of proteolytic fragments C1 and C2. By analogy with equation 5 in that paper,
Figure 5. Apparent association of V1 and V2 fragments, measured by FRET.
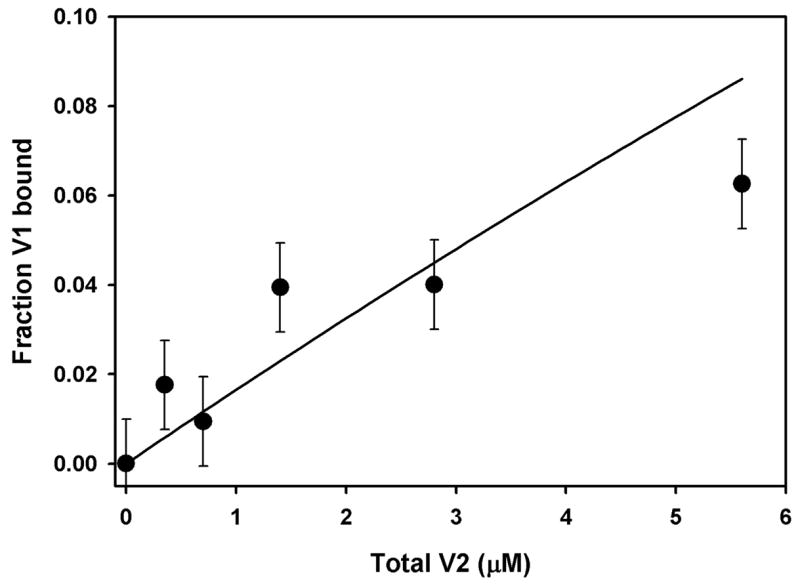
V1-V2 association data from magnitude of sensitized emission at 285 nm, analyzed as described in text. Line calculated from eq. (1) with association constant = 0.017 μM−1. Error bars indicate standard deviation from line. Conditions, 0.7 μM V1, 0.55% CHAPS, 0.55% DMPC, 0.15% SDS, 0.05 M phosphate, pH 6.0.
| (1) |
where fV1 is the fraction of V1 bound to V2, K is the association constant for V1-V2 association, and V1T and V2T are the total concentrations of V1 and V2, respectively, in each measurement. As before, we assumed that the maximum sensitized emission measured at 285 nm is that obtained for a BO sample solubilized in CHAPS/DMPC, and the minimum corresponds to the 285 nm emission from V1 alone. We find the apparent association constant is 0.017 μM−1, much weaker than for association of C1 and C2 (7.7 μM−1, 9). Both the V1-V2 binding and the acid unfolding results indicate that V1 is partially unfolded in the absence of V2. Thus, V1 unfolds a lower concentrations of acid, and it binds to V2 as if only a small fraction of V1 and/or V2 has the correct conformation for association (see Discussion).
Analysis of helix-helix interactions in 7-transmembrane helix proteins
The difference in stabilities of different regions of BO to acid or proteolysis prompted us to look at the helix-helix interactions in the structure of BO. The surface roughness of the helix-helix interfaces was measured by calculating the fractal dimension (17), and the distance of closest approach was measured between lines fit to the helix axis. The results were plotted in fig. 6. For comparison, the surface roughness and distance of closest approach was also calculated for three other 7-transmembrane helix proteins. The results indicate that the helix pairs in the N-terminal two-thirds of the proteins have shorter axial distances, and half have smoother interfaces. The helix pairs in the C-terminal one-third of the proteins have longer axial distances and rougher interfaces.
Figure 6. Helix-helix interactions in seven-transmembrane-helix proteins.
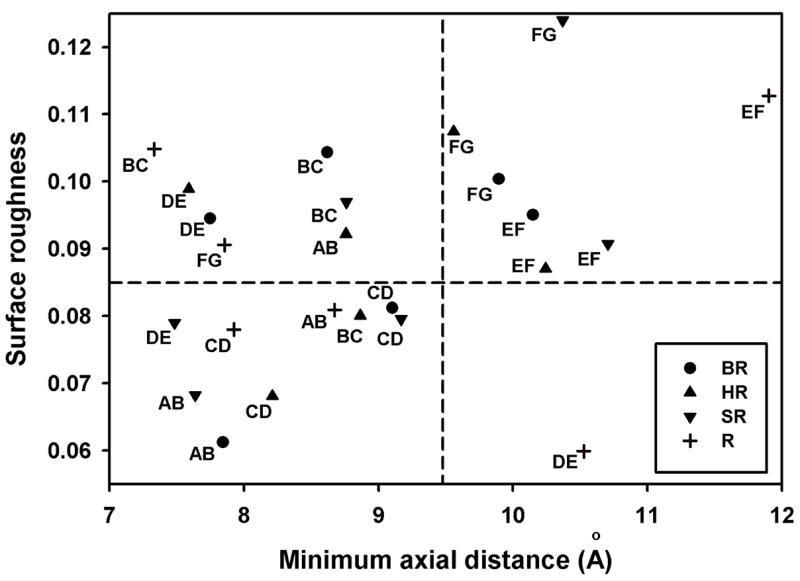
Distance of closest approach of helix pairs obtained from helix axes by averaging Cα atomic coordinates in contiguous groups of 4 and then calculating minimum axial distance. Surface roughness calculated from fractal dimension, D (17) and plotted as D - 2. Protein Data Bank files: circles, BR, 1C3W; triangles, HR (halorhodopsin), 1E12; inverse triangles, SR (sensory rhodopsin II), 1JGJ; crosses, R (bovine rhodopsin), 1F88. Letters next to symbols indicate helix pairs, starting from the N-terminal helix (A) to the C-terminal helix (G).
Discussion
Analysis of acid-induced unfolding
Using FRET as an indicator of local conformation, we observed acid-induced unfolding of BO in 90% ethanol (fig. 2), fit by a single pK. A simple model can account for the observations. We assume that an unfolding equilibrium is linked with sites which have higher pKs in the unfolded state of the protein:
| (2) |
where F is the folded protein, U is unfolded protein, UH is unfolded protein protonated at a site which destabilizes the folded form when protonated, and FH is the folded form protonated at the same site. The unfolding equilibrium appears to be established in less than 100 msec, and the analysis which follows refers to this rapid equilibrium. On a time scale of minutes, the reaction is observed to be irreversible. We assume the irreversible step draws equally from folded and unfolded forms, so that the measured fraction of unfolded protein reflects the initial equilibrium concentrations. We define the equilibrium constants for unfolding, sensed by a FRET acceptor at a particular site S on the protein, as KS = [U]/[F], and KS’ = [UH]/[FH]. We assume that a single titrating group or type of group is involved in the equilibria in (2), with a dissociation constant Ka for the equilibrium with U and Ka’ for the equilibrium with F. The ratio of the fraction of unfolded protein to the fraction of folded protein fU/fF detected by a FRET acceptor at a particular site S will be:
| (3) |
Since by definition proton binding destabilizes the folded form, it follows that KS’ > 1 > KS and thus KS’ ≫ KS. Therefore, equation (3) reduces to:
| (4) |
For a sequential unfolding process, where the protein structure in the region of one FRET acceptor site, S1, is more destabilized by titration of the proton binding site than at another FRET acceptor site, S2, then at a particular pH:
| (5) |
Equation (5) assumes all side chains with a particular functional group have similar pKs when exposed to solvent by unfolding of the protein. We can define the unfolding process at a particular site S as the change in protein conformation which moves the FRET donor/acceptor pairs beyond about 3.5 nm, a distance which would diminish the energy transfer efficiency to a negligible amount for the tryptophan-to-dansyl pair. The free energy change of unfolding at site S, ΔGu, equals -RT ln Ks. Thus, the difference in unfolding free energy between site S1 and site S2, ΔΔGu, equals:
| (6) |
The results in figs. 2 and 3 were analyzed using equation (6). The acid-induced unfolding of BO viewed from the Lys 41 dansyl site was used as the reference (denominator) for each of the other sites and for the two proteolytic fragments. The values of ΔΔGu obtained were −0.54 kcal/mol for the 163C site, −1.4 kcal/mol for the 222C site, −1.0 kcal/mol for C1, and −3.5 kcal/mol for V1 (table 1).
The unfolding process which results in a loss of the FRET signal could be due to movement of the acceptor site away from fixed donor sites, movement of the donor sites away from a fixed acceptor site, or both the donors and the acceptor moving. The relative contributions of BO tryptophans to the sensitized emission at 285 nm can be calculated from the high resolution crystal structure of BR (table 2), assuming that the folded state in 90% ethanol has a similar structure (see below). The energy transfer efficiency varies depending on the acceptor position. However, for all three acceptor sites, Trp 182 has the largest contribution and Trp 86 the second largest. Because of the closer proximity of Trp 182 to the acceptors at positions 163 and 222, these positions require a larger change in distance during unfolding to decrease the energy transfer. The titration curves fit well to single pKs, with no evidence of broadening within the resolution of the data. A single acceptor site would report more than one pK if it detected unfolding processes with different apparent pKs. Thus, the simplest interpretation is that each acceptor site moves relative to fixed donors. Of the three FRET acceptor sites we examined, the C-terminal helix (helix G) appears to be least stably associated with the native structure, and helix B is the most stably associated.
Table 2.
Calculated FRET donor-acceptor transfer efficiencies
| K41 Nε | M163 Cε | I222 Cγ | ||||
|---|---|---|---|---|---|---|
| Trp, Cε | Ra | Eb | R | E | R | E |
| 10 | 41.9 | 0.02 | 43.4 | 0.01 | 31.6 | 0.08 |
| 12 | 38.5 | 0.03 | 37.0 | 0.03 | 25.7 | 0.23 |
| 80 | 33.0 | 0.06 | 38.0 | 0.03 | 31.5 | 0.08 |
| 86 | 26.2 | 0.21 | 26.8 | 0.19 | 20.3 | 0.55 |
| 137 | 35.7 | 0.04 | 35.5 | 0.04 | 35 | 0.04 |
| 138 | 34.3 | 0.05 | 29.4 | 0.12 | 27.2 | 0.17 |
| 182 | 20.3 | 0.55 | 17.7 | 0.74 | 13.8 | 0.93 |
| 189 | 33.9 | 0.05 | 32.3 | 0.07 | 28.1 | 0.15 |
Distances (R) in Ångstroms from FRET acceptor sites (Lys Nε, Met Cε, or Ile Cγ) to Trp residues (Trp Cε). Data from PDB file 1C3W.
Fluorescence energy transfer efficiency (E) calculated from E = Ro6/(Ro6+R6) with Ro = 21 Å.
Our survey of four 7-transmembrane helix protein structures (figure 6), revealed that the three C-terminal helices (E, F and G) tend to have topologically rougher surfaces and longer axial separations from neighboring helices, implying weaker interactions. This is consistent with the computational unfolding studies for visual rhodopsin (20) which show that the C-terminal third of the protein unfolds more readily than the N-terminal two-thirds. Studies of the stability of the individual helical segments of BO showed that peptides with the sequences of helices F and G did not form helices independently in lipid bilayers (21), suggesting these sequences are less stable than helices A-E. Similar studies of the stability of multi-helical fragments of BO showed that of eleven fragments tested, containing two to five helices, only the FG helix pair was substantially less folded in mixed lipid micelles than in the native structure (22). Hunt et al. (21) previously suggested that the stability of the BR N-terminal helices being greater than the C-terminal helices is consistent with a sequential folding model, in which selection constraints on the first helices synthesized would be more stringent than on the last helices, which would have a template of already-associated helices with which to interact. However, our results show that the helix B-helix F interaction is stronger than the helix F-helix G interaction. Thus, helix F does not dissociate along with helix G, but rather in the same process which separates helix B from the core structure. An alternative explanation for the lower stability of the C-terminal helices in rhodopsins is that the retinal attachment site is on helix G, and for retinal to enter its binding pocket, helix G may be required to undergo a displacement.
The importance of the F and G helix interactions with the other BO helices for stabilizing the folded structure is dramatically demonstrated by the five-helix V1 fragment, which lacks helices F and G. V1 is unstable in acid (fig. 4), and the interaction between V1 and the two-helix V2 fragment is far weaker (fig. 5) than that between the five-helix C1 fragment (helices C-F) and the two-helix C2 fragment (helices A-B) (9). A possible explanation for this weak association is that both V1 and V2 are partially unfolded. V1 contains only one energy donor site (Trp 86), which is on helix C. The energy acceptor is at Lys 41, on helix B. Thus, the helix B-helix C interaction could be mostly intact in V1(fig. 4) but the other helices may be partially separated, destroying the binding site for V2. Also, V2 itself is likely to be partially unfolded (22). The dissociation equilibrium for V1 and V2 can be written to include partially unfolded forms V1u and V2u:
| (7) |
The apparent association constant, K, as measured in fig. 5 and equation 1 is:
| (8) |
where K1 and K2 are the equilibrium constants between the folded and unfolded forms of V1 and V2, respectively. If the association constant Kv for the folded forms of V1 and V2 is [V1·V2] / ([V1][V2]), then the apparent association constant is:
| (9) |
If K1 ~ K2 ≫ 1, and if Kv is approximately the same as the association constant between the chymotryptic fragments of BR, C1 and C1 (9), then K1 and K2 are in the range of about 20, i.e. only about 5% of V1 and V2 are folded into a form that can associate in CHAPS/DMPC.
The free energy differences observed between the different sites include differences in protein-protein interactions and protein-solvent interactions. The latter are likely to be similar for all helices, so that we assume the measured differences (table 1) mostly involve helix-helix interactions. The magnitudes of ΔΔGu are in the range expected for a small number of hydrogen bonds. It would be interesting if we could identify candidate helix-helix hydrogen bonds which might be destabilized in acid and thus explain the observed unfolding. To do this, we need to know the nature of the helix-helix hydrogen bonds, and also the pH range of the unfolding experiment.
Although our pH measurements were made on a relative scale, we can estimate the absolute pH. Gutbezahl & Grunwald (23) calculated junction potentials between aqueous KCl and alcohol-water mixtures. For 80% ethanol, their results suggest a pH of 1.26 units higher than the measured value; and for 100% ethanol, 2.35 units higher. For 100% methanol, Beckers et al. (16) report a pH shift due to the junction potential of 2.25 units. The pH* of the midpoints of the unfolding transitions we observed was in the range 5 to 7, suggesting that the transitions occur at absolute pH values above 6. In this range in 90% ethanol, formic acid is mostly dissociated, protein carboxyl groups are mostly protonated, and Arg and Lys side chains would be mostly protonated (18, 24).
We assume that the starting folded state of BO in 90% ethanol resembles the folded structure of BR. This assumption is supported by the efficiency of energy transfer (e.g. fig. 2), which suggests that in neutral 90% ethanol the three dansyl sites are each at approximately the distances from Trp 86 and Trp 182 found in the native structure. Luecke et al. (25) list 31 helix-helix H-bonding interactions involving side chains, observed in the 1.55 Å resolution structure of BR. Thirteen of these H-bonds involve Arg or Lys side chains, of which, eleven are bonded to backbone carbonyl oxygens and two to Tyr OH. It is unlikely that these oxygens would accept protons from the solvent at the pH of our experiments. Thus these H-bonds are unlikely to be disrupted by protonation. An additional thirteen H-bonds involve carboxyl side chains, of which six are to hydroxyl side chains (Ser, Thr or Tyr), four are to backbone carbonyl or amide groups, two are to other carboxyl side chains, and one to a Lys side chain. Of these, the two carboxyl-carboxyl hydrogen bonds might be weakened by protonation, but only if they are ionized in the folded state. Finally, there are five H-bonds involving non-ionizable side chains, of which four are to backbone carbonyl oxygens and one involves a Tyr-Trp H-bond. None of these H-bonds is likely to become protonated in the unfolded state. However, eleven of the H-bonds identified by Luecke et al. (25) involve helix-helix H-bonds mediated by water molecules. Binding of a proton to a water molecule that is hydrogen-bonded within a folded protein would undoubtedly disrupt H-bonding, either by directly occupying the acceptor lone pair or by a distortion of bond-angles due to the more highly polarized H3O+. This raises the intriguing possibility that internally bound water molecules provide a source of stabilization for folding of integral membrane proteins into compact structures.
Buried water molecules have been observed in the interiors of several other high resolution structures of helical transmembrane proteins, including visual rhodopsin (26), a glutamate transporter (27), halorhodopsin (28), and sensory rhodopsin II (29). These water molecules bond almost exclusively to the side chains or backbone within α-helix regions. By contrast, buried water molecules in water-soluble proteins frequently bond to polar groups in loops lacking secondary structure (30). Studies of water-soluble proteins indicate that buried water molecules stabilize the structure. For example, cytochrome f mutations which remove buried water increase the sensitivity to unfolding (31). Conversely, when mutagenesis of lysozyme creates cavities into which water binds, about 2 kcal/mol more free energy is required for unfolding compared to lysozyme with empty cavities (32). We plan to direct future experiments toward measuring the extent of stabilization provided by the buried water molecules in BR.
Acknowledgments
We thank Janos Lanyi for providing H. salinarum cultures containing the M163C and I222C BR mutations.
Footnotes
Supported by a grant from the National Institutes of Health (GM 08194)
Abbreviations: BO, bacterio-opsin; BR, bacteriorhodopsin; C1, proteolytic fragment of BO containing residues 72-248; C2, proteolytic fragment of BO containing residues 1-71; CHAPS, 3-[(3-cholamidopropyl)dimethylammonio]-1-propanesulfonate; DMPC, dimyristoyl phosphatidylcholine; FRET, Förster mechanism fluorescence resonance energy transfer; I222C, BR with isoleucine 222 mutated to cysteine; M163C, BR with methionine 163 mutated to cysteine; TCEP, tris(2-carboxyethyl) phosphine; V1, proteolytic fragment of BO containing residues 1-166; V2, proteolytic fragment of BO containing residues 167-248.
References
- 1.Hessa T, Kim H, Bihlmaier K, Lundin C, Boekel J, Andersson H, Nilsson I, White SH, von Heijne G. Recognition of transmembrane helices by the endoplasmic reticulum translocon. Nature. 2005;433:377–381. doi: 10.1038/nature03216. [DOI] [PubMed] [Google Scholar]
- 2.Booth PJ. Unraveling the folding of bacteriorhodopsin. Biochim Biophys Acta. 2000;1460:4–14. doi: 10.1016/s0005-2728(00)00125-0. [DOI] [PubMed] [Google Scholar]
- 3.Lau F, Bowie JU. A method for assessing the stability of a membrane protein. Biochemistry. 1997;36:5884–5892. doi: 10.1021/bi963095j. [DOI] [PubMed] [Google Scholar]
- 4.Chen GQ, Gouaux E. Probing the folding and unfolding of wild-type and mutant forms of bacteriorhodopsin in micellar solutions: evaluation of reversible unfolding conditions. Biochemistry. 1999;38:15380–15387. doi: 10.1021/bi9909039. [DOI] [PubMed] [Google Scholar]
- 5.Yohannan S, Faham S, Yang D, Grosfeld D, Chamberlain AK, Bowie JU. A Cα-H···O hydrogen bond in a membrane protein is not stabilizing. J Am Chem Soc. 2004;126:2284–2285. doi: 10.1021/ja0317574. [DOI] [PubMed] [Google Scholar]
- 6.Janoviak H, Struckmeier J, Hubain M, Kedrov A, Kessler M, Muller DJ. Proving the energy landscape of the membrane protein bacteriorhodopsin. Structure. 2004;12:871–879. doi: 10.1016/j.str.2004.03.016. [DOI] [PubMed] [Google Scholar]
- 7.Pace CN. Determination and analysis of urea and guanidine hydrochloride denaturation curves. Meth Enzymol. 1986;131:266–280. doi: 10.1016/0076-6879(86)31045-0. [DOI] [PubMed] [Google Scholar]
- 8.Tanford C. The hydrophobic effect. 2. Wiley; N.Y.: 1980. pp. 81–83. [Google Scholar]
- 9.Nannepaga S, Gawalapu R, Velasquez D, Renthal R. Estimation of helix-helix association free energy from partial unfolding of bacterio-opsin. Biochemistry. 2004;43:550–559. doi: 10.1021/bi034875c. [DOI] [PubMed] [Google Scholar]
- 10.Oesterhelt D, Stoeckenius W. Isolation of the cell membrane of Halobacterium halobium and its fractionation into red and purple membrane. Meth Enz. 1974;31:667–678. doi: 10.1016/0076-6879(74)31072-5. [DOI] [PubMed] [Google Scholar]
- 11.Harris G, Renthal R, Tuley J, Robinson N. Dansylation of bacteriorhodopsin near the retinal attachment site. Biochem Biophys Res Comm. 1979;91:926–931. doi: 10.1016/0006-291x(79)91968-5. [DOI] [PubMed] [Google Scholar]
- 12.Renthal R, Cothran M, Dawson N, Harris G. Fluorescent labeling of purple membrane: implications for helix connections. Biochim Biophys Acta. 1987;897:384–394. doi: 10.1016/0005-2736(87)90436-6. [DOI] [PubMed] [Google Scholar]
- 13.Renthal R, Haas P. Effect of transmembrane helix packing on tryptophan and tyrosine environments in detergent-solubilized bacterio-opsin. J Protein Chem. 1996;15:281–289. doi: 10.1007/BF01887117. [DOI] [PubMed] [Google Scholar]
- 14.Sigrist H, Wenger RH, Kislig E, Wuthrich M. Refolding of bacteriorhodopsin. Protease V8 fragmentation and chromophore reconstitution from proteolytic V8 fragments. Eur J Biochem. 1988;177:125–133. doi: 10.1111/j.1432-1033.1988.tb14352.x. [DOI] [PubMed] [Google Scholar]
- 15.Gerber GE, Anderegg RJ, Herlihy WC, Gray CP, Biemann K, Khorana HG. Partial primary structure of bacteriorhodopsin: sequencing methods for membrane proteins. Proc Natl Acad Sci USA. 1979;76:227–231. doi: 10.1073/pnas.76.1.227. [DOI] [PMC free article] [PubMed] [Google Scholar]
- 16.Beckers JL, Ackermans MT, Bocek P. Capillary zone electrophoresis in methanol: migration behavior and background electrolytes. Electrophoresis. 2003;24:1544–1552. doi: 10.1002/elps.200305359. [DOI] [PubMed] [Google Scholar]
- 17.Renthal R. Transmembrane and water-soluble helix bundles display reverse patterns of surface roughness. Biochem Biophys Res Commun. 1999;263:714–717. doi: 10.1006/bbrc.1999.1439. [DOI] [PubMed] [Google Scholar]
- 18.Grunwald E, Berkowitz B. The measurement and correlation of acid dissociation constants for carboxylic acids in the system ethanol-water. Activity coefficients and empirical activity functions. J Am Chem Soc. 1951;73:4939–4944. [Google Scholar]
- 19.Liao MJ, Huang KS, Khorana HG. Regeneration of native bacteriorhodopsin structure from fragments. J Biol Chem. 1984;259:4200–4204. [PubMed] [Google Scholar]
- 20.Rader AJ, Anderson G, Isin B, Khorana HG, Bahar I, Klein-Seetharaman J. Identification of core amino acids stabilizing rhodopsin. Proc Nat Acad Sci USA. 2004;101:7246–7251. doi: 10.1073/pnas.0401429101. [DOI] [PMC free article] [PubMed] [Google Scholar]
- 21.Hunt JF, Earnest TN, Bousche O, Kalghatgi K, Reilly K, Horvath C, Rothschild KJ, Engelman DM. A biophysical study of integral membrane protein folding. Biochemistry. 1997;36:15156–15176. doi: 10.1021/bi970146j. [DOI] [PubMed] [Google Scholar]
- 22.Luneberg J, Widmann M, Dathe M, Marti T. Secondary structure of bacteriorhodopsin fragments. External sequence constraints specify the conformation of transmembrane helices. J Biol Chem. 1998;273:28822–28830. doi: 10.1074/jbc.273.44.28822. [DOI] [PubMed] [Google Scholar]
- 23.Gutbezahl B, Grunwald E. The acidity and basicity scale in the system ethanol-water. The evaluation of degenerate activity coefficients for single ions. J Am Chem Soc. 1953b;75:565–574. [Google Scholar]
- 24.Gutbezahl B, Grunwald E. The effect of solvent on equilibrium and rate constants. II The measurement and correlation of acid dissociation constants of anilinium and ammonium salts in the system ethanol-water. J Am Chem Soc. 1953a;75:559–565. [Google Scholar]
- 25.Luecke H, Schobert B, Richter HT, Cartailler JP, Lanyi JK. Structure of bacteriorhodopsin at 1.55 Å resolution. J Mol Biol. 1999;291:899–911. doi: 10.1006/jmbi.1999.3027. [DOI] [PubMed] [Google Scholar]
- 26.Okada T, Fujiyoshi Y, Silow M, Navarro J, Landau EM, Shichida Y. Functional role of internal water molecules in rhodopsin revealed by x-ray crystallography. Proc Nat Acad Sci USA. 2002;99:5982–5987. doi: 10.1073/pnas.082666399. [DOI] [PMC free article] [PubMed] [Google Scholar]
- 27.Yernool D, Boudker O, Jin Y, Gouaux E. Structure of a glutamate transporter from Pyrococcus horikoshii. Nature. 2004;431:811–818. doi: 10.1038/nature03018. [DOI] [PubMed] [Google Scholar]
- 28.Kolbe M, Besir H, Essen L-O, Oesterhelt D. Structure of the light-driven chloride pump halorhodopsin at 1.8 Å resolution. Science. 2000;288:1390–1396. doi: 10.1126/science.288.5470.1390. [DOI] [PubMed] [Google Scholar]
- 29.Gordeliy VI, Labahn J, Moukhametzianov R, Efremov R, Granzin J, Schlesinger R, Büldt G, Savopol T, Scheidig AJ, Klare JP, Engelhard M. Molecular basis of transmembrane signalling by sensory rhodopsin II transducer complex. Nature. 2002;419:484–487. doi: 10.1038/nature01109. [DOI] [PubMed] [Google Scholar]
- 30.Park S, Saven JG. Statistical and molecular dynamics studies of buried waters in globular proteins. Proteins. 2005;60:450–463. doi: 10.1002/prot.20511. [DOI] [PubMed] [Google Scholar]
- 31.Griffin S, Vitello A, Wittung-Stafshede P. Buried water molecules contribute to cytochrome f stability. Arch Biochem Biophys. 2002;404:335–337. doi: 10.1016/s0003-9861(02)00333-8. [DOI] [PubMed] [Google Scholar]
- 32.Takano K, Yamagata Y, Yutani K. Buried water molecules contribute to the conformational stability of a protein. Protein Engineering. 2003;16:5–9. doi: 10.1093/proeng/gzg001. [DOI] [PubMed] [Google Scholar]