

Abstract
Activation of O2 by heme-containing monooxygenases generally commences with the common initial steps of reduction to the ferrous heme and binding of O2 followed by a one-electron reduction of the O2-bound heme. Subsequent steps that generate reactive oxygen intermediates diverge and reflect the effects of protein control on the reaction pathway. In this study, Mössbauer and EPR spectroscopies were used to characterize the electronic states and reaction pathways of reactive oxygen intermediates generated by 77 K radiolytic cryoreduction and subsequent annealing of oxy-heme oxygenase (HO) and oxy-myoglobin (Mb). The results confirm that one-electron reduction of (FeII-O2)HO is accompanied by protonation of the bound O2 to generate a low-spin (FeIII-O2H−)HO that undergoes self hydroxylation to form the α-meso-hydroxyhemin-HO product. In contrast, one-electron reduction of (FeII-O2)Mb yields a low-spin (FeIII-O22−)Mb. Protonation of this intermediate generates (FeIII-O2H−)Mb, which then decays to a ferryl complex, (FeIV=O2−)Mb, that exhibits magnetic properties characteristic of the compound II species generated in the reactions of peroxide with heme peroxidases and with Mb. Generation of reactive high-valent states with ferryl species via hydroperoxo intermediates is believed to be the key oxygen-activation steps involved in the catalytic cycles of P450-type monooxygenases. The Mössbauer data presented here provide direct spectroscopic evidence supporting the idea that ferric-hydroperoxo hemes are indeed the precursors of the reactive ferryl intermediates. The fact that a ferryl intermediate does not accumulate in HO underscores the determining role played by protein structure in controlling the reactivity of reaction intermediates.
INTRODUCTION
Activation of molecular oxygen by heme-containing monooxygenases, such as cytochrome P450 and heme oxygenase (HO), generally involves the common initial steps of reduction to the ferrous heme and binding of O2, followed by a one-electron reduction of the O2-bound heme to generate reactive oxygen intermediates.1 Recently we have shown that radiolytic cryoreduction of oxyhemoproteins in frozen solution at 77 K2–5 in combination with annealing at elevated temperatures and EPR/ENDOR spectroscopy is a very useful approach for investigating mechanistic details of monooxygenase processes involving these active-oxygen species. For example, it has been shown that in cytochrome P450cam, camphor as substrate is hydroxylated by compound I, while methylenyl camphor can be hydroxylated both by P450 compound I and by hydroperoxo-ferri-P450.6,7 In the case of HO we found that the hydroperoxo ferric-HO is the reactive state for heme hydroxylation, not compound I,3,5 and this is confirmed by the recent demonstration that HO compound I is not reactive.8
To deepen our understanding of the reactions of reduced oxy-ferrous hemes it is important to examine the properties of all intermediates as thoroughly as possible, both those that are EPR-active and those that are not. To this end, we have used Mössbauer spectroscopy, which can monitor all heme states, to study the cryoreduction annealing process for oxy-HO and oxy-Mb. The ability to monitor all intermediates during a cryoreduction/annealing experiment further conveys an important ability to address mechanistic questions. As applied to HO, it allows us to test the expectation that compound I/II does not form as the hydroperoxo-HO is reactive. Of particular importance, it has allowed us to favorably resolve a question as to the fundamental applicability of the cryoreduction/annealing technique. Thus, Symons and Kappl and coworkers9 proposed that the hydroperoxo-ferric-Mb intermediate produced by cryoreduction decays directly to high-spin ferric-Mb via a dissociative mechanism, whereas it is well known that the reaction between metMb and H2O2 forms compound I which is very unstable and converts to the EPR-silent Mb compound II (FeIV=O).10–15 This raises the question whether the hydroperoxo-ferric intermediate formed during low-temperature cryoreduction/annealing is distinct from the intermediate formed during ambient-temperature reaction of metMb with H2O2.
In the present study, we have used 77 K cryoreduction to generate the one-electron reduced O2-bound ferrous heme in HO and Mb for Mössbauer characterization. The reaction of these one-electron reduced intermediates were then induced by stepwise annealing the frozen samples at temperatures above 77 K and the decay pathways were investigated by Mössbauer and EPR spectroscopies. These studies add to the information about EPR-visible states derived from EPR spectroscopy, and in particular address a speculation that the hydroperoxo-ferric-heme state of HO has a unique reactivity because it adopts a novel electronic structure.16 Most importantly, they demonstrate that the reaction of hydroperoxo-ferric Mb during low-temperature cryoreduction/annealing occurs by the same mechanism as that seen in reactions at ambient temperature, a conclusion which is extendable to monooxygenases in general.
MATERIALS AND METHODS
Preparation of Oxy-Heme Oxygenase and Oxy-Myoglobin
Expression, purification and reconstitution of the recombinant rat heme oxygenase isoform-1 with heme were carried out as described previously.17 57Fe hemin was purchased from Frontier Scientific Porphyrin Products (Logan, Utah) and 57Fe-enrichment (>95%) and purity were confirmed by ESI-TOF mass spectrometry. The oxy form of the heme complex of HO was prepared according to Davydov et al.5 as follows. First, the ferric heme-HO complex was reduced by sodium dithionite in deoxygenated buffer. Then, the reduced form of the complex was loaded on to a column of Sephadex G-25 equilibrated with air-saturated 0.1 M phosphate buffer, pH 7 containing 1 mM EDTA to remove extra reductant. The oxy form was concentrated by ultrafiltration to 2 mM. Formation of the complex and sample integrity were confirmed by the optical absorption spectra.
Myoglobin from horse heart was purchased from Sigma. Oxy-57Fe myoglobin were prepared as published18 and the protein samples were prepared in 50 mM KPi buffer pH 7.2 containing 20 v % glycerol.
Methods
Radiolytic cryoreduction of oxy hemoproteins was performed as described.5 EPR measurements were conducted on a Bruker 300 X-band EPR spectrometer at 77K. Mössbauer spectra were recorded either on a weak-field spectrometer using a permanent magnet of 50 mT or on a strong-field spectrometer that is equipped with an 8-T superconducting magnet. Both spectrometers have been described previously.19 The isomer shifts are referenced to that of a room-temperature metallic Fe foil. Analysis of the data was performed with the program WMOSS (WEB Research) according to the following spin Hamiltonian
| (1) |
All the symbols in equation 1 have their conventional meanings. Specifically, H represents the external applied field. S and I are, respectively, the electronic and nuclear spin of the heme Fe, and η = (Vxx − Vyy)/Vzz.
RESULTS
Complexity involved in the Analysis of the Mössbauer Data
The as-prepared oxygenated HO and Mb samples contain residual ferric protein in addition to the oxygenated protein, and cryoreduction yields only partial reduction of each component. As a result, Mössbauer spectra of cryoreduced samples are a summation of components arising from multiple Fe species, and analysis of such complex spectra is challenging. A unique solution cannot be obtained by analyzing any one single spectrum: all spectra recorded for all samples under different conditions have to be considered as a whole during analysis. In addition, the following has made our data analysis even more difficult. A standard approach employed in Mössbauer spectroscopy is to obtain ΔEQ and δ of a paramagnetic Fe center by recording spectra at high temperatures (> 200 K) where the magnetic hyperfine interaction is cancelled by fast electronic relaxation. Unfortunately, this approach cannot be applied here because the species produced by cryoreduction generally decay at such temperatures. We have recorded spectra up to 120 K and found that the electronic relaxation rates for both the high-spin and low-spin ferric species in these samples are still slower than or comparable to the 57Fe nuclear precession rate. Fortunately, extensive spectroscopic investigations have been performed on Mb and HO; in particular, Mössbauer parameters for several well studied Mb species are known.20 This has helped us in identifying the paramagnetic species detected in these samples. Thus, whenever applicable, previously reported parameters for certain established Mb and HO species are used in our global analysis, thereby decreasing the number of parameters to be fit. The results of such analysis are presented in Table 1, which summarizes the percent absorptions of various Fe species detected in the HO and Mb samples, and in Table 2, which lists the parameters determined for the various paramagnetic Fe species. The major observations resulting from the analysis are now described for each sample.
Table 1.
Percent Mössbauer absorptions of the Fe species detected in the as-prepared, cryoreduced and high-temperature annealed oxy-HO and oxy-Mb samples
| Oxy-HO
|
Oxy-Mb
|
||||
|---|---|---|---|---|---|
| Condition | Species | % absorptiona | Condition | Species | % absorptiona |
| As-prepared | FeII-O2 | 84(5) | As-prepared | FeII-O2 | 76(3) |
| FeIII-H2O | 16(5) | FeIII-H2O | 24(3) | ||
|
| |||||
| Reduced at 77K | FeII-O2 | 36(3) | Reduced at 77K | FeII-O2 | 27(3) |
| FeIII-H2O | 10(2) | FeIII-H2O | 10(2) | ||
| FeIII-O2H− | 34(6) | FeIII-O22− | 48(5) | ||
| S = 0 FeII | 14(3) | S = 0 FeII | 15(3) | ||
| S = 1 FeIV | 4(2) | ||||
|
| |||||
| Annealed at 180 K | Same as prior to annealing | Annealed at 180 K | FeII-O2 | 25(3) | |
| FeIII-H2O | 10(2) | ||||
| FeIII-O22− | 50(7) | ||||
| S = 0 FeII | 14(2) | ||||
|
| |||||
| Annealed at 220 K | FeII-O2 | 33(4) | Annealed at 195 K | FeII-O2 | 25(3) |
| FeIII-H2O | 9(5) | FeIII-H2O | 11(5) | ||
| FeIII-O2H− | 9(4) | FeIII-O22− | 5(5) | ||
| α-hydroxyhemin | 22(5) | FeIV=O2− | 27(3) | ||
| S = 0 FeII | 6(2) | FeIII-product | 18(5) | ||
| S = 2 FeII | 4(3) | Deoxy Mb | 14(2) | ||
| S = 1 FeIV | 6(2) | ||||
values in the parentheses are uncertainties estimated for the last significant digits.
Table 2.
Mössbauer parameters for the paramagnetic species detected in the as-prepared, cryoreduced and high-temperature annealed oxy-HO and oxy-Mb samples
| Species | (FeIII-O2 H−)HO | (FeIII-O22−)Mb | (FeIII-H2O)HOa | (FeIII-H2O)Mb | α-hydroxyhemina | FeIII Mb producta | (FeIV=O2−)Mb | deoxyMbd |
|---|---|---|---|---|---|---|---|---|
| Spin | 1/2 | 1/2 | 5/2 | 5/2 | 5/2 | 5/2 | 1 | 2 |
| Δ/λ | 6.9 | 9.4 | ||||||
| V/λ | 5.5 | 7.8 | ||||||
| D (cm−1) | 10.5 | 8.5 | 9.5 | 10.5 | 24c | −10 | ||
| E/D | 0.0025 | 0.0025 | 0.007b | 0.007 | 0c | 1/3 | ||
| gx | 1.93 | 1.97 | 2 | 2 | 2 | 2 | 2 | 2 |
| gy | 2.19 | 2.11 | 2 | 2 | 2 | 2 | 2 | 2 |
| gz | 2.37 | 2.22 | 2 | 2 | 2 | 2 | 2 | 2 |
| ΔEQ (mm/s) | 2.03 | 1.71 | 1.24 | 1.24 | 1.24 | 1.24 | 1.49 | −2.24 |
| η | 2.2 | 2.4 | 0 | 0 | 0 | 0 | 0 | 0.9 |
| δ(mm/s) | 0.29 | 0.29 | 0.42 | 0.42 | 0.42 | 0.42 | 0.10 | 0.92 |
| Axx/gnβn (T) | −6.5 | −5.7 | −19.6 | −19.9 | −20.0 | −19.8 | −19.4 | −6.4 |
| Ayy/gnβn (T) | −34.1 | −39.2 | −19.6 | −19.9 | −20.0 | −19.8 | −19.4 | −20.0 |
| Azz/gnβn (T) | 13.9 | 8.5 | −19.6 | −19.9 | −20.0 | −19.8 | −2.5 | −10.0 |
As-Prepared Oxy-Heme Oxygenase
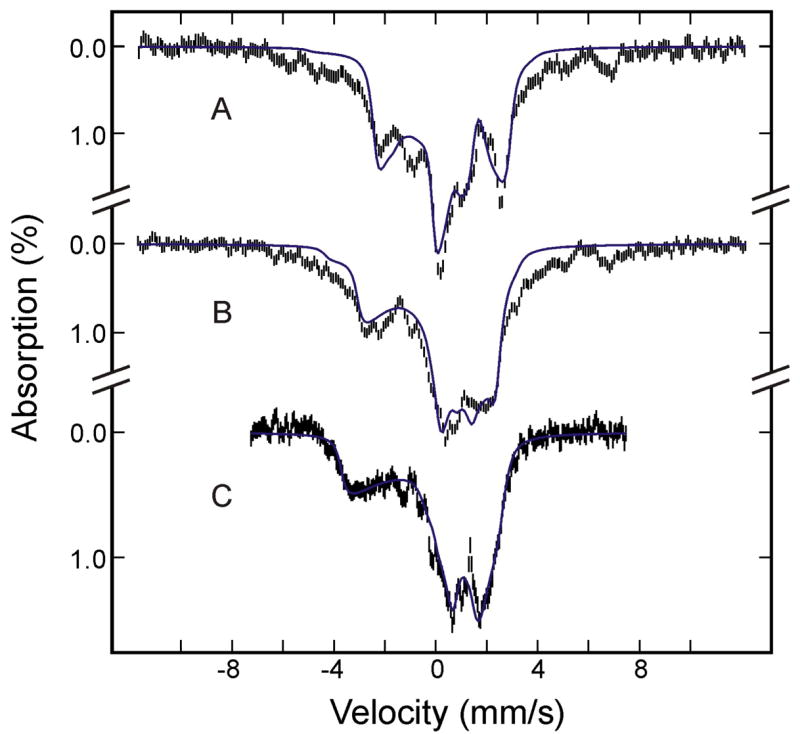
The Mössbauer spectra of the sample of as-prepared oxygenated HO recorded at 4.2 K in a magnetic field of 8 T and 50 mT applied parallel to the γ radiation (Figure 1, A and B, respectively) display two spectral components: A dominant diamagnetic S = 0 component (shown in red) that accounts for (84 ± 5)% of the total 57Fe Mössbauer absorption and a paramagnetic component (shown in cyan) that accounts for the remaining 57Fe absorption (also, see Table 1). Detailed analysis of these and other spectra recorded in various magnetic fields yields characteristic parameters for both components. Those for the diamagnetic component (δ = 0.26 ± 0.02 mm/s, ΔEQ = −2.28 ± 0.03 mm/s, and η = 0.25) are typical for O2-bound ferroheme complexes, particularly, the large and negative ΔEQ.20 Thus, this component is assigned to the O2-bound ferrous heme oxygenase, denoted as (FeII-O2)HO.
Figure 1.

Mössbauer spectra of the as-prepared oxygenated HO sample before (A and B) and after (C) radiolytic reduction at 77K. The spectra (hatched marks) were recorded at 4.2 K in a magnetic field of 8 T (A), or 50 mT (B and C) applied parallel to the γ beam. The theoretical spectra of the individual species are shown as color lines above the experimental spectra ((FeII-O2)HO, red; (FeIII-H2O)HO, cyan; (FeIII-O2H−)HO, blue; low-spin FeII HO, purple; (FeIV=O2−)HO, green), and the composite spectra are plotted as black solid lines overlaid with the experimental data.
The paramagnetic component exhibits an overall splitting and magnetic-field dependence that are consistent with the S = 5/2 axially-symmetric, high-spin ferric species of a ferriheme compound.20 Indeed, the spectral features of this paramagnetic component are very similar to those of the aquo-met myoglobin component, denoted as (FeIII-H2O)Mb, identified in the oxygenated Mb sample, presented below. Therefore, the parameters obtained for (FeIII-H2O)Mb (E/D = 0.0025, ΔEQ = 1.24 mm/s, η = 0, an isotropic A tensor)21–23 were used in the analysis of this component, except for D and A, which were allowed to vary. This is because the field-dependent Mössbauer spectra of this component are very sensitive to both D and A, and their values can be determined accurately from the analysis of spectra recorded at different applied fields. The resulting parameters are listed in Table 2 and the simulated spectra are plotted in Figure 1 (cyan lines).
To summarize, Mössbauer characterization of the as-prepared oxygenated HO sample indicates that the majority (84%) of the HO molecules in the sample are present in the desired O2-bound ferrous form ((FeII-O2)HO); a minor component of autooxidized oxy HO (16%) is present as high-spin ferric-aquo HO ((FeIII-H2O)HO).
77 K Radiolytically Reduced Oxy-Heme Oxygenase
After the as-prepared oxy-HO sample was characterized by Mössbauer spectroscopy, it was subjected to radiolytic reduction at 77 K, and the cryoreduced sample again was characterized by Mössbauer spectroscopy. Figure 1 compares the Mössbauer spectrum of the sample prior to cryoreduction recorded at 4.2 K in a parallel field of 50 mT (Figure 1B) to that of the cryoreduced HO sample recorded under the same experimental conditions (Figure 1C). Upon cryoreduction, the absorption intensities arising from (FeII-O2)HO/(FeIII-H2O)HO decreased from 84%/16% to 36%/10%. Most of the decrease (~50% of the total) in the intensity of (FeII-O2)HO is associated with the appearance of a broad paramagnetic component (34% of total; shown in blue in Figure 1C.) Previous EPR and ENDOR investigations established that radiolytic reduction of (FeII-O2)HO at 77 K yields the ferric-hydroperoxo intermediate, denoted as (FeIII-O2H−)HO, which exhibits a characteristic low-spin ferric EPR spectrum with g = [2.37, 2.19 and 1.93].3,5 Analysis of Mössbauer spectra of the cryoreduced sample recorded at various magnetic fields (presented below) indicates that this new paramagnetic component should be assigned to the (FeIII-O2H−)HO intermediate as the major product of cryoreduction of (FeII-O2)HO.
In addition, there are two new quadrupole doublets which account for 14% and 4% of the total absorption. The spectra of the cryoreduced sample recorded at various applied fields reveal that the more intense new quadrupole doublet (14%; purple line in Figure 1C) arises from a diamagnetic, S = 0, species. The parameters obtained for this S = 0 doublet (δ = 0.52 mm/s, ΔEQ = −1.45 mm/s, and η = 1.0) are within the ranges observed for low-spin ferrous heme compounds.20 This doublet is therefore assigned in part to a low-spin FeII HO that forms during cryoreduction of the (FeIII-H2O)HO and that is low spin because it retains a water molecule as its sixth axial ligand.24–26 However, the loss of (FeIII-H2O)HO upon cryoreduction is only ~6% of total, less than the amount of this low-spin FeII HO that forms (14%). Consequently, there must be an additional source of this low-spin FeII HO. We suggest that species is formed by a second reduction of (FeIII-O2H−)HO formed during the cryoreduction; we return to this issue immediately below.
The minor quadrupole doublet (4%; green line in Figure 1C) is paramagnetic. Its parameters (δ = 0.08 mm/s and ΔEQ = 1.40 mm/s) are typical for ferryl- (FeIV-O2−) heme compounds, and in particular are very similar to those determined for the compound II (FeIV-O2−)Mb, described below. Therefore, this component is assigned to a compound II (FeIV-O2−)HO. Since one-electron reduction of (FeIII-H2O)HO cannot generate a ferryl species, the presence of such a species in the cryoreduced sample indicates that it must be a minor co-product of the reduced (FeIII-O2H−)HO.
The data presented in Table 1 reveal that 50% of the total enzyme in the form of oxy HO is converted by γ-irradiation to 36% hydroperoxo HO intermediate, implying the conversion of 14% into other intermediates. This 14% discrepancy is likely due to further one-electron reduction of that amount of hydroperoxo intermediate (Davydov and Hoffman, unpublished data). The primary product of cryoreduction of hydroperoxo ferri HO intermediate should be the unstable, low-spin, hexacoordinate FeII-OOH-HO which at 77K may convert completely or in part into the ferryl HO intermediate, as observed here by Mössbauer spectroscopy.
Taken together, Mössbauer characterization of the cryoreduced oxy-HO sample reveals that one-electron reduction of (FeII-O2)HO produces a major product, the (FeIII-O2H−)HO intermediate, which has been identified previously,3,5 and a minor byproduct, a compound II-like (FeIV-O2−)HO that has not been reported previously.
The FeIII-Hydroperoxo Intermediate of Heme Oxygenase
To generate Mössbauer spectra of the (FeIII- O2H−)HO intermediate, itself, at various magnetic fields for detailed characterization, we removed the contributions of all other Fe species from the spectra of the cryoreduced sample by subtracting the theoretical spectra of other Fe species simulated with parameters mentioned above and listed in Tables 1 and 2. The results are presented in Figure 2. The shape of the spectra (a small overall magnetic splitting with broad absorption lines) is indicative of an S = 1/2 system with an extremely anisotropic magnetic hyperfine coupling tensor, A, and is consistent with a low-spin ferric heme species whose anisotropic A results from both the spin-dipolar interaction and the large unquenched d-orbital moments of the low-spin FeIII.20 To analyze these spectra of the (FeIII- O2H−)HO intermediate, we employed a crystal field model27–29 that has proven successful in correlating the experimental g values with the magnetic hyperfine A tensor of low-spin ferric complexes.30–34 In this one-electron hole formalism, the electronic state of a low-spin FeIII compound is treated as a single electron hole occupying the t2g orbitals, the separation of which are parameterized by the axial and rhombic field parameters, Δ and V, respectively. Mixing of these orbitals via the spin-orbit interaction, −λL·S, partially unquenches the orbital angular momentum and yields three low lying Kramers doublets. At 4.2 K, only the lowest doublet is occupied, and the observed g and A tensors arise from this ground doublet. Within the framework of this model, the crystal field parameters, Δ and V, along with a covalency factor, k, and the wave functions of the three Kramers doublets can be derived from the observed g values.27,28,35 The wave functions of the ground Kramers doublet can then be used to calculate the magnetic hyperfine A tensor.29
Figure 2.
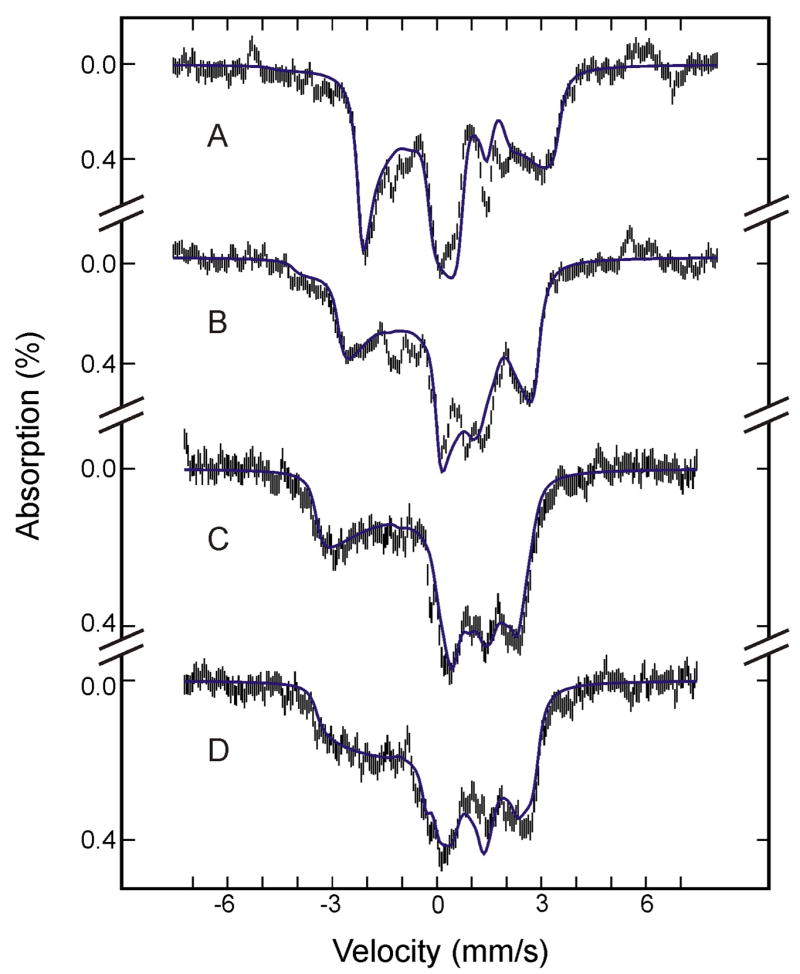
Mössbauer spectra of (FeIII-O2H−)HO prepared from the raw spectra recorded at 4.2 K in a parallel field of 8 T (A), 4 T (B) or 50 mT (C), and in a perpendicular field of 50 mT (D) (see text for details). The blue solid lines are theoretical spectra simulated with the parameters listed in Table 2.
Employing this crystal field model, with the electron hole in a dπ orbital (dxz/dyz), the observed g values (gx = 1.93, gy = 2.19, and gz = 2.37) of (FeIII- O2H−)HO3,5 yield Δ/λ = 6.9, V/λ = 5.5 and a covalency factor k = 1.01.27–29 For calculation of A, we first assumed a rhombic symmetry, appropriate for most of the low-spin FeIII heme compounds.20,36 However, the resulting A does not reproduce the experimental spectra well. Next, we assumed a monoclinic symmetry in which the rhombic field axis system is rotated about the z-axis of the tetragonal field axis system by an angle, α, of 45° (For such a specific angle of rotation, the principal-axis systems of the g and A tensors remain aligned.29) We then obtained an A that is compatible with the experimental data. In calculating A, there are two scaling factors: an overall scaling factor P = 2 gnβn〈 r−3〉 and a scaling factor, κ, for the Fermi contact term. In our analysis, κ is set at 0.36, a typical value for low-spin FeIII heme and non-heme compounds.20,29,30,33,37–39 Detailed analysis of the data indicates that the experimental spectra are very sensitive to the largest component of the A tensor and the component of the electric-field-gradient tensor along the same direction (Ayy and Vyy, respectively, in this case). This sensitivity has allowed us to determine accurately the values, Ayy/gnβn = −34.1 T and Vyy ~ −2.0 mm/s. To reproduce the experimental value of Ayy, we fixed P = 2gnβn〈 r−3〉 = 55 T, which is well within the range of values (49 T ≤ P ≤ 62 T) observed for low-spin FeIII complexes.20,30,34,37–40 The final set of spin-Hamiltonian parameters for the (FeIII- O2H−)HO determined from the analysis are listed in Table 2, and the simulated spectra are shown as blue lines in Figure 2.
Cryo-reduced Oxy-Heme Oxygenase annealed at 180 K and 220 K
Previous EPR and ENDOR investigations 3,5,41 have established that annealing the cryoreduced oxy-HO at temperatures between 77 K and 200 K allows the initially formed (FeIII-O2H−)HO intermediate to adopt a “relaxed” conformation. This relaxation process begins at 140 K and is complete at 180 K; the structural alteration is revealed by a slight broadening of the EPR spectrum and shifting of the g values (2.37, 2.18 and 1.92), along with some changes in proton ENDOR spectra. Upon annealing at temperatures above 200 K, the S = 1/2 (FeIII-O2H−)HO species converts to the FeIII-α-meso-hydroxyheme-HO,42 which exhibits a slightly rhombic S = 5/2 FeIII signal; for example, annealing at 214 K for 9 minutes causes an 80% conversion. The loss of the (FeIII-O2H−)HO EPR signal was paralleled by an increase of the S = 5/2 EPR signal, indicating that the “relaxed” (FeIII-O2H−)HO intermediate is kinetically competent intermediate for generation of the α-meso-hydroxylated product.5,41
To investigate this process, we performed a set of annealing/Mössbauer experiments on the primary product of cryoreduction of (FeII-O2)HO. Within experimental uncertainty, Mössbauer spectra of a “relaxed” sample generated by annealing for 5 minutes at 180K (data not shown) are indistinguishable from those recorded under the same conditions prior to the relaxation step. This is not surprising, as the changes observed in the EPR spectrum associated with annealing at 180 K are very small. Moreover, the Mössbauer spectra of the (FeIII- O2H−)HO are relatively broad and featureless, so the structural changes reflected in the EPR data are not expected to be observable by Mössbauer spectroscopy. However, the Mössbauer data do confirm the previous EPR finding that the amount of the (FeIII- O2H−)HO in the sample remains the same during annealing at 180 K. In fact, the Mössbauer data show that the annealing at this temperature causes no changes in the amounts of any of the various Fe species present in the sample.
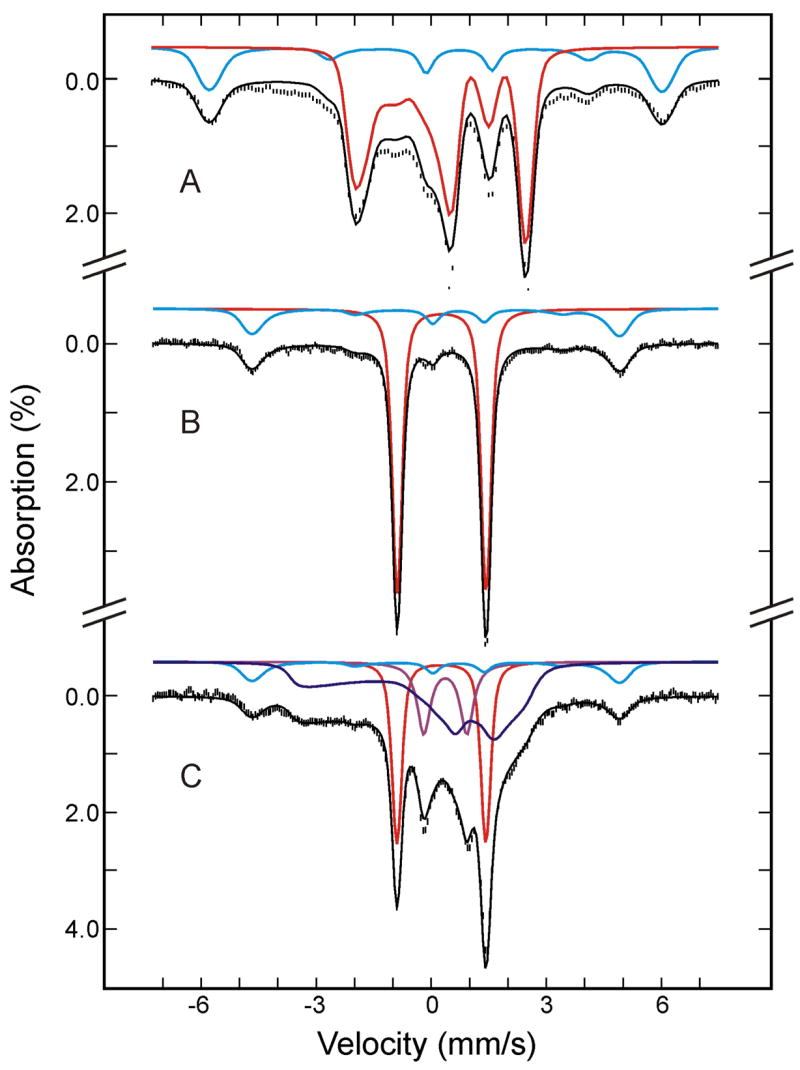
To further define the decay pathway of the relaxed (FeIII- O2H−)HO intermediate, the sample was next annealed at 220 K for 10 min, then subjected to Mössbauer characterization. Figure 3 shows the Mössbauer spectrum of the 220 K-annealed HO sample, recorded at 4.2 K in a parallel applied field of 50 mT (A) or 4 T (B). Analysis of these and other spectra recorded at various strong applied fields (2 T to 8T) yielded the absorption intensities for the various Fe species present in the annealed sample (listed in Table 1). The deconvoluted individual components and the composite spectrum, based on this analysis, also are shown in Figure 3. The major effects of annealing at 220 K are a substantial decrease in the amount of the (FeIII- O2H−)HO species (25%; from 34% to 9%) and the appearance of additional absorption (~ 22%) in the regions corresponding to the high-spin ferric heme, see Table 1 and Figure 3. This observation is consistent with the finding that at temperatures above 214 K the “relaxed” (FeIII-O2H−)HO intermediate converts in a single kinetic step to the high-spin FeIII-α-meso-hydroxyheme product. Within the experimental uncertainty, the amount of reduction in (FeIII-O2H−)HO equals to the amount of production in FeIII-α-meso-hydroxyheme, indicating that the conversion of (FeIII-O2H−)HO to FeIII-α-meso-hydroxyheme is indeed quantitative, as suggested previously by the EPR measurement.5,41 It is important to point out that the small increase in the amount of (FeIV-O2−)HO (from 4% to 6%) by annealing at 220 K is statistically insignificant. Taken together, the Mössbauer data indicate unambiguously that (FeIII-O2H−)HO converts quantitatively to FeIII-α-meso-hydroxyheme product and that the compound II (FeIV-O2−)HO is not likely a decay product of (FeIII-O2H−)HO nor does it generate the product.
Figure 3.
Mössbauer spectra of the cryoreduced oxygenated HO sample after annealing at 220 K. The data (hatched marks) were recorded at 4.2 K in a parallel applied field of 50 mT (A) or 4 T (B). The theoretical spectra of each individual species are shown as color lines above the experimental spectra ((FeII-O2)HO, red; FeIII-α-hydroxy-HO plus (FeIII-H2O)HO, cyan; (FeIII-O2H−)HO, blue; low-spin FeII, purple; (FeIV=O2−)HO, green; high-spin FeII HO, orange), and the composite spectra are shown as black solid line overlaid with the experimental spectra.
The α-meso-hydroxyheme exhibits a slightly rhombic EPR spectrum (E/D ~0.007) that is distinguishable from the nearly axial EPR spectrum of (FeIII-H2O)HO (E/D ~ 0.0025).5,42 While this difference in rhombicity is too small to be detected by Mössbauer spectroscopy, detailed analysis of the Mössbauer spectra reveals that the (FeIII-H2O)HO and the FeIII-α-meso-hydroxyheme-HO exhibit distinct, though similar, zero-field splitting parameters, D = 10.5 cm−1 for the (FeIII-H2O)HO and 9.5 cm−1 for the FeIII-α-meso-hydroxyheme-HO.
As-Prepared Oxy-Myoglobin
As with the as-prepared oxy-HO, the as-prepared oxy-Mb sample also contains two species identifiable by their Mössbauer spectra (Figure 4, A and B). The major species (shown in red) accounts for 76 ± 3 % of the Fe, exhibits spectroscopic properties (diamagnetic, ΔEQ = −2.32 ± 0.03 mm/s, δ = 0.27 ± 0.02 mm/s and η = 0.25) that are typical for oxygenated Mb,20 and is assigned to (FeII-O2)Mb. The minor species accounts for (24 ± 3)% of the Fe, is paramagnetic and can be assigned to the (FeIII-H2O)Mb forming during autooxidation of oxyMb. Detailed analysis of the data indicates that the parameters previously obtained for (FeIII-H2O)Mb (S = 5/2, D = 8.5 ± 0.5 cm−1, E/D = 0.0025, ΔEQ = 1.24 mm/s, η = 0, and A = −19.9 ± 0.5 T)20,22,23 can generate theoretical spectra (shown in cyan) that agree very well with the experimental spectra of the paramagnetic species (see Figure 4). In particular, D and A are determined very accurately from the field-dependent Mössbauer spectra and are found to agree with those reported for the (FeIII-H2O)Mb.20,23
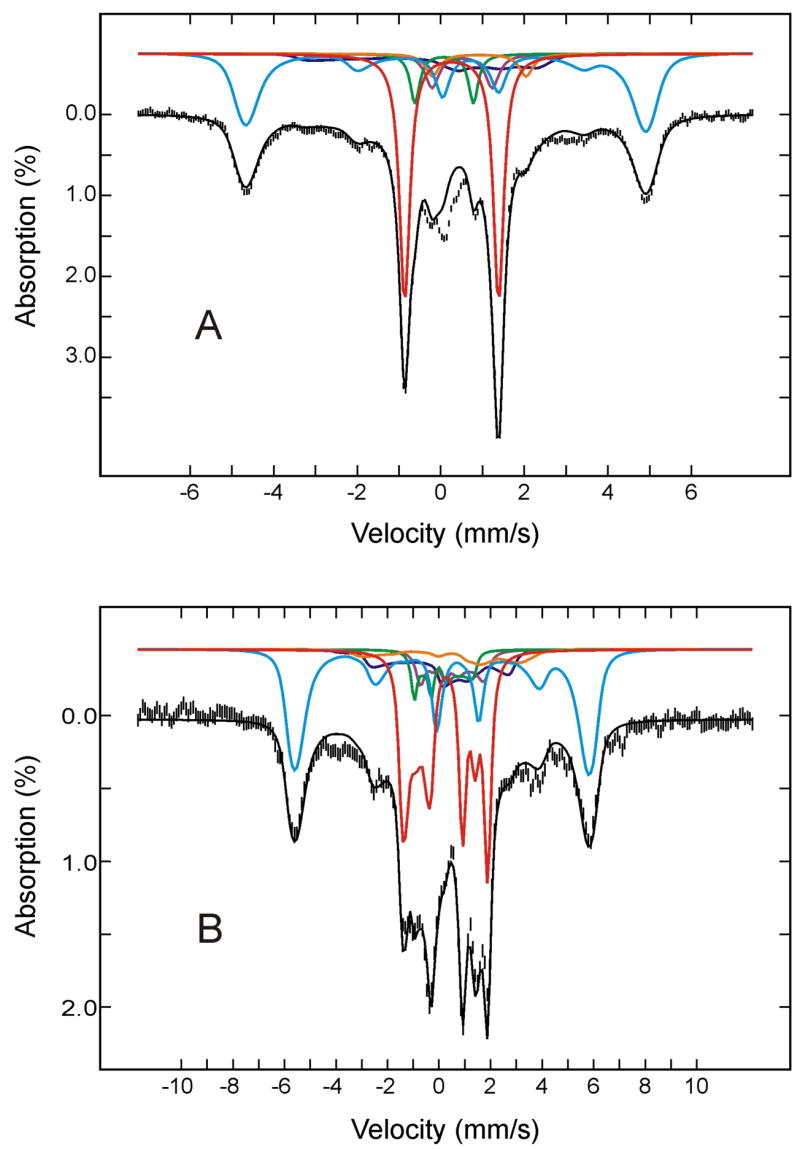
Figure 4.
Mössbauer spectra of the as-prepared oxygenated Mb sample before (A and B) and after (C) radiolytic reduction at 77K. The spectra (hatched marks) were recorded at 4.2 K in a parallel field of 8 T (A) or 50 mT (B and C). The theoretical spectra of the individual species are shown as color lines above the experimental spectra ((FeII- O2)Mb, red; (FeIII-H2O)Mb, cyan; (FeIII-O22−)Mb, blue; low-spin FeII Mb, purple), and the composite spectra are plotted as black solid lines overlaid with the experimental data.
77-K Radiolytically Reduced Oxy-Mb
The as-prepared 57Fe-enriched oxy-Mb sample was radiolytically reduced at 77 K and the reduced sample was characterized by both Mössbauer and EPR spectroscopy. When compared with the Mössbauer spectrum of the sample prior to irradiation (Figure 4B), the spectrum of the cryoreduced sample recorded at 4.2 K in a parallel field of 50 mT (Figure 4C) shows substantial decreases in the absorption intensities of both the (FeII-O2)Mb and the (FeIII-H2O)Mb species; the absorption of the (FeII-O2)Mb decreases by ~49% of the total (from 76% to 27%) and the (FeIII-H2O)Mb by ~14% (from 24% to 10%) (see Table 1). The loss of these two components is accompanied by the appearance of two new components: a paramagnetic component (shown in blue) that accounts for 48% of the total Fe absorption, and a diamagnetic component with a quadrupole doublet (shown in purple) that accounts for 15% of the Fe absorption. Previous EPR and ENDOR studies have established that radiolytic reduction of (FeII-O2)Mb at 77 K produces an S = 1/2 end-on ferric peroxo intermediate, denoted as (FeIII-O22−)Mb, which exhibited a characteristic EPR spectrum with g = [2.22, 2.11, 1.97].43,44 On the basis of the detection of an exchangeable proton by ENDOR,9 a hydrogen bond between the peroxo and the distal histidine was suggested to stabilize this end-on peroxo configuration. Consistent with these previous studies, the cryo-reduced 57Fe-enriched oxy-Mb sample exhibits an EPR spectrum showing the characteristic (FeIII-O22−)Mb signals at g = [2.22, 2.11, (1.97)] (see Figure 5A; the g = 1.97 feature is masked by the radical signals). In accord with this EPR observation, detailed analysis of the field-dependent Mössbauer spectra of the cryo-reduced oxy-Mb sample indicates that the new paramagnetic component (shown in blue) originates from a low-spin ferric species with spectroscopic properties that are in agreement with the EPR characterized (FeIII-O22−)Mb intermediate (see below). Parameters that describe the minority quadrupole doublet (shown in purple), ΔEQ = 1.12 ± 0.03 mm/s, δ = 0.37 ± 0.02 mm/s, are indicative of a low-spin ferrous heme complex with water as 6-th axial ligand.20 Spectra of the cryo-reduced sample recorded at different applied fields (not shown) confirm that the doublet indeed arises from a diamagnetic species. Note, that in contrast to oxyHO no compound II or FeIV-O2− species are detected in irradiated oxyMb. This observation shows that the peroxy-ferric-Mb is not further cryoreduced at 77K, unlike hydroperoxy-ferric-HO.
Figure 5.
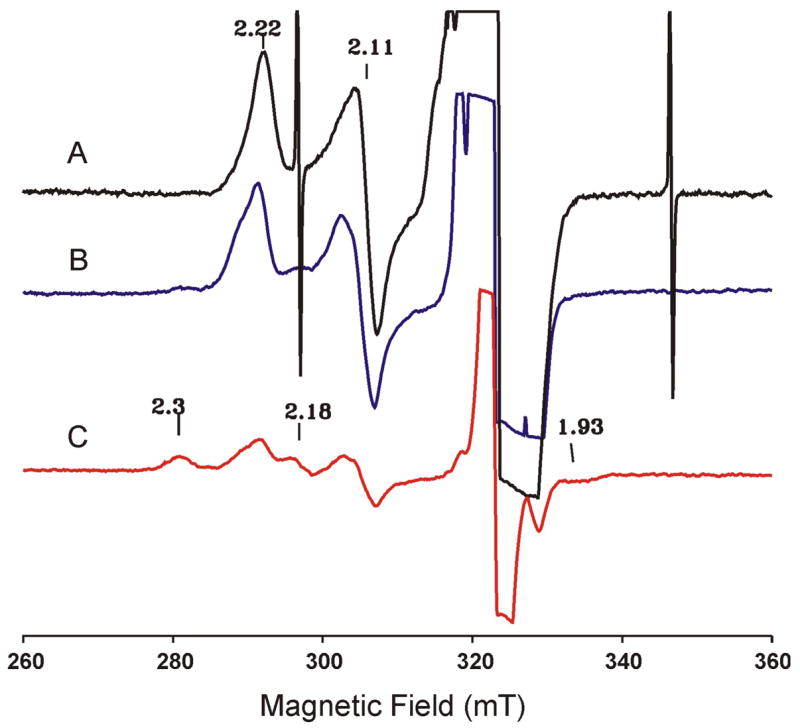
EPR spectra of cryoreduced oxy Mb (A). (B) and (C) are spectra of this same sample after annealing at 180 K and 190 K, respectively. The spectra are recorded at 77 K, 9.10 GHz, 10 mW microwave power, 100 kHz modulation frequency and 0.5 mT modulation amplitude.
In summary, the above observations demonstrate that radiolytic reduction of (FeII-O2)Mb at 77 K quantitatively yields an S = 1/2 (FeIII-O22−)Mb intermediate, supporting previous EPR/ENDOR findings. Concomitantly, a portion of the residue (FeIII-H2O)Mb has also picked up an electron and converted to a low-spin FeII species during cryoreduction.
The FeIII-Peroxo Mb Intermediate
To characterize the (FeIII-O22−)Mb intermediate in detail, we prepared the various-field Mössbauer spectra of the (FeIII-O22−)Mb (Figure 6) by removing the contributions of other Fe species from the raw spectra using theoretical spectra simulated with parameters mentioned above and listed in Tables 1 and 2. These spectra also were analyzed by use of the crystal field model for low-spin ferric complexes with one electron-hole in a dπ orbital, mentioned above.28,29,35 Within the framework of this model, the observed g values (gx = 1.97, gy = 2.11, and gz = 2.22) of (FeIII-O22−)Mb yields Δ/λ = 9.4, V/λ = 7.8, and a covalency factor k = 0.86, analogous to but noticeably different from those of the (FeIII-O2H−)HO. Similar to the results that we found for (FeIII-O2H−)HO, assuming a rhombic symmetry for (FeIII-O22−)Mb yields an A tensor that does not reproduce the prepared experimental spectra. Assuming monoclinic symmetry with the rhombic-field axis system rotated about the z-axis of the tetragonal frame by an angle of 45°, on the other hand, yields an A tensor (listed in Table 2) that reproduces the experimental spectra (see Figure 6). In this analysis, the scaling factors, P and κ, were taken to be the same as those used for the analysis of the (FeIII-O2H−)HO (i.e., P = 55 T and κ = 0.36). Because all three principal g values are within range of 1.9–2.3, the Mössbauer spectra are insensitive to the relative orientation between the g and A tensors. However, it is important to note that the assumed monoclinic symmetry for (FeIII-O22−)Mb results in an A tensor having its largest component (−39.2 T) aligned with the gy = 2.11 axis. This prediction is in perfect agreement with a previous EPR measurement of a 57Fe-enriched and cryoreduced oxy-Mb single crystal, which showed that the maximum hyperfine interaction was detected along the gy = 2.11 direction.43
Figure 6.
Mössbauer spectra of (FeIII-O22−)Mb prepared from the raw spectra recorded at 4.2 K in a parallel field of 8 T (A), 4 T (B) or 50 mT (C) (see text for details). The blue solid lines are theoretical spectra simulated with the parameters listed in Table 2.
Cryo-reduced Oxy-Mb annealed at temperatures between 180 K and 200 K
To investigate the effects of annealing the (FeIII-O22−)Mb intermediate to temperatures higher than 77 K, the cryoreduced EPR and Mössbauer oxy-Mb samples were first annealed at 180 K and then characterized by both techniques. The EPR spectrum of the annealed sample (Figure 5B) shows the appearance of a second S = 1/2 ferric species with gz = 2.25 and a decrease in intensity of the gz = 2.22 species. This second low-spin ferric species was observed previously,9,43 and was suggested to represent a different conformational substate of the (FeIII-O2 2−)Mb.9,43 The Mössbauer spectrum of the 180-K annealed sample recorded at 4.2 K in a parallel field of 50 mT is shown in Figure 7A. In comparison with the spectrum of this sample prior to annealing recorded under the same experimental condition (Figure 4C), the only discernible difference is a slight modification of the central quadrupole doublet assigned to the low-spin FeII Mb (purple line shown in Figure 4C). Analysis of spectra of the annealed sample recorded at various fields confirms this observation (see Table 1) and yields modified parameters for the low-spin FeII species (ΔEQ = 1.01 ± 0.03 mm/s, and δ = 0.31 ± 0.02 mm/s, purple line in Figure 7A). The subtle changes involving the (FeIII-O22−)Mb species observed in the EPR spectrum are not detectable by Mössbauer spectroscopy. To illustrate this point we show the individual (FeIII- O22−)Mb spectra of the 180-K annealed sample in two fields, 50 mT and 8 T (hatched marks in Figure S1, Supporting Information) and compare them with the corresponding spectra of (FeIII- O22−)Mb prior to annealing (solid lines in Figure S1). It can be seen that within experimental error, the before-and-after annealing spectra recorded under the same experimental conditions are indistinguishable. This result is not surprising since it is well established that EPR spectroscopy is more sensitive than Mössbauer spectroscopy to small structural modifications of an EPR-active Fe center. On the other hand, the unique capability of Mössbauer spectroscopy to detect and to quantify every Fe species in a given sample has revealed that annealing at 180 K does not produce any changes in the amounts, oxidation and spin states of any of the Fe species present in the cryoreduced oxy-Mb sample.
Figure 7.
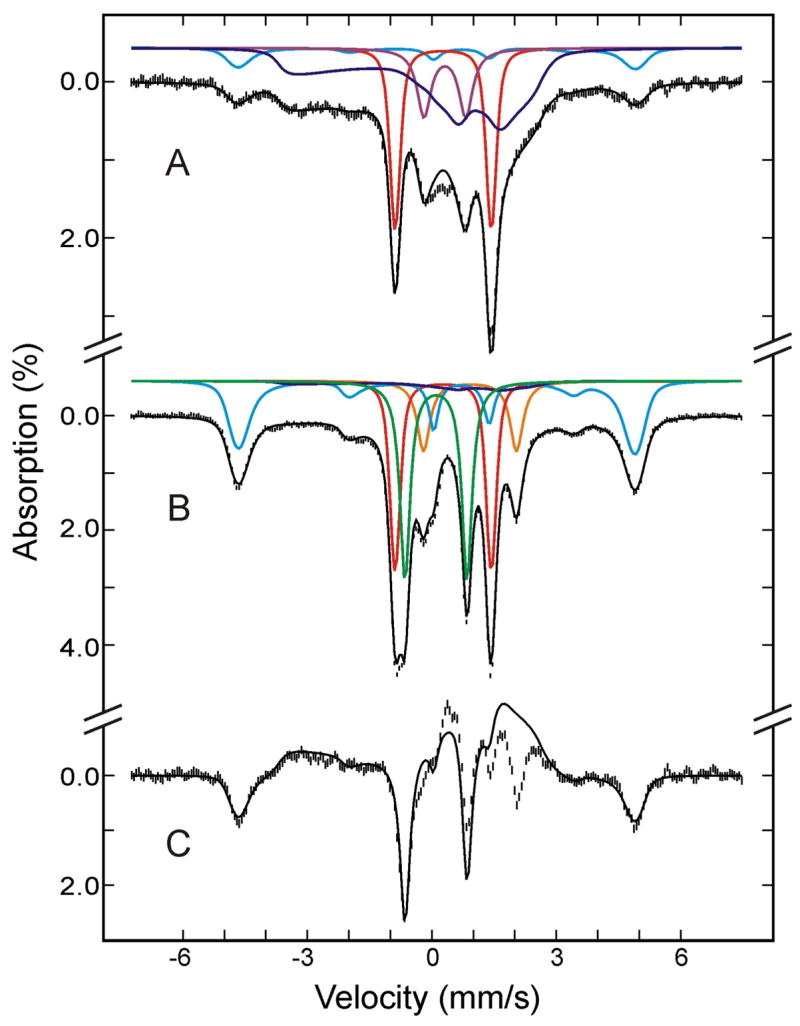
Mössbauer spectra of the cryoreduced oxygenated HO sample after annealing at 180 K (A) and at 195 K (B). The data (hatched marks) were recorded at 4.2 K in a parallel applied field of 50 mT. The theoretical spectra of each individual species are shown as color lines above the experimental spectra ((FeII-O2)Mb, red; high-spin FeIII Mb, cyan in A; (FeIII-O2 2−)Mb, blue; low-spin FeII Mb, purple; (FeIV=O2−)Mb, green; deoxy FeII Mb, orange; the cyan line in B is the sum of (FeIII-H2O)Mb and FeIII Mb product.), and the composite spectra are shown as black solid lines overlaid with the experimental spectra. A difference spectrum of B minus A is shown in C (hatched marks). The black solid line in C is the theoretical difference spectrum of (FeIV=O2−)Mb plus FeIII Mb product minus (FeIII-O22−)Mb.
Previous EPR investigations9,43,45 showed that annealing oxy-Mb at temperatures between 190 and 200 K leads to protonation of a fraction of the (FeIII-O22−)Mb to form a ferric hydroperoxo species, denoted as (FeIII-O2H−)Mb, whose EPR spectrum is characterized by g = [2.31, 2.18, 1.93]. Thus, this annealing yields an EPR spectrum (Figure 5C) displaying the characteristic signals of both (FeIII-O22−)Mb and (FeIII-O2H−)Mb. However, the combined intensity of these signals is substantially less than that of the as-reduced oxy-Mb (Figure 5A) and of the sample annealed at 180 K (Figure 5B).
The effects of such annealing at temperatures between 190 K and 200 K now have been investigated by Mössbauer spectroscopy. Following the completion of the Mössbauer characterization of the cryoreduced oxy-Mb sample annealed at 180-K, the sample was annealed at 195 K for approximately 5 minutes. Figure 7B shows the Mössbauer spectrum of the 195 K annealed sample recorded at 4.2 K in a parallel applied field of 50 mT. Compared to the spectrum of the 180-K annealed sample (Figure 7A), the absorption of the low-spin (FeIII-O22−)Mb is decreased substantially by annealing at 195 K, in accord with the EPR finding. According to the EPR study, both the (FeIII-O22−)Mb and (FeIII-O2H−)Mb should be present in this 195 K annealed sample, but unfortunately, only ~5% of the total Fe absorption can be attributed to these low-spin ferric species combined. The low Mössbauer absorption intensities associated with these two low-spin ferric species, together with the presence of intense overlapping absorptions arising from other Fe species, prevented us from making a meaningful attempt to identify the Mössbauer spectrum of the (FeIII-O2H−)Mb. To simplify our analysis, the absorption of the low-spin ferric species in this 195 K annealed sample was approximated by the spectrum of (FeIII-O22−)Mb described above.
The decrease in intensity of (FeIII-O22−)Mb is accompanied by the appearance of a new quadrupole doublet (shown in green) and additional absorptions peaks at ~ −5 mm/s and +5 mm/s, indicating that (FeIII-O22−)Mb has converted to two new species. This conversion is best illustrated by a difference spectrum (Figure 7C) between the spectra shown in Figure 7, A and B. The loss of (FeIII-O22−)Mb, accounting for approximately 40–45% of total Fe, appears as a broad magnetic spectrum in the negative absorption direction (upward direction), while the two new species appear as a quadrupole doublet and a magnetic spectrum in the positive direction (downward direction). The two outermost lines of the magnetic spectrum are clearly observable as peaks at ~ −5 mm/s and +5mm/s. The doublet, accounting for ~27% of the total Fe, displays parameters (ΔEQ = 1.48 ± 0.03 mm/s and δ = 0.10 ± 0.02 mm/s) of ferryl heme complexes,20 while the magnetic spectrum, accounting for ~18% of total Fe, is characteristic of a high-spin ferric heme complex. Spectra recorded at various applied fields indicate that this high-spin ferric component exhibits a field-dependence (D = 10.5 cm−1) that is different from that of residual high-spin (FeIII-H2O)Mb (D = 8.5 cm−1), and it is therefore designated as a product high-spin FeIIIMb. This finding is supported by the EPR spectrum of high-spin form of ferric Mb formed during annealing at 200 K, which is discernibly broader than that of the resting state (Figure S2, Supporting Information). Symons44 explained formation of high-spin ferric Mb by dissociation the hydroperoxo ligand. Under this assumption the spectrum may be associated with an unstable pentacoordinate ferric Mb intermediate or a nonequilibrium conformation of water coordinate ferric Mb.
Most interestingly, the various field spectra indicate that the doublet is paramagnetic and provide evidence supporting the conclusion that this annealing formed a compound II. Figure 8 shows the 8 T (A) and 50 mT (B) spectra of this species prepared from the raw data by removing the contributions of all other Fe species (see Tables 1 and 2 for information on other Fe species). As mentioned above, the ΔEQ and δ values are characteristic of a FeIV=O2− species, which is consistent with either a compound I or compound II assignment. The sharp line width (0.27 mm/s) observed for the 50 mT spectrum indicates the absence of spin-spin interaction between the FeIV and a nearby porphyrin radical as expected for compound I, and thus eliminates the possibility that this species is a compound I. Further, the 8-T spectrum can be reproduced by using the fine and hyperfine parameters (see Table 2) that are practically identical to those determined for the S = 1 compound II observed in myoglobin and peroxidases 46. Consequently, the Mössbauer data presented above indicate unambiguously that 195 K annealing converts the (FeIII-O22−)Mb intermediate into a compound II plus some high-spin FeIII heme. In the following, the sequence of steps involved in these conversions will be discussed. Finally, analysis of the Mössbauer spectra also shows that 195 K annealing converts the low-spin FeII species observed in the cryoreduced sample into a high-spin FeII species (see Table 1) that exhibits spectroscopic properties (see Table 2) that are characteristics of deoxy-Mb,47 presumably by loss of the sixth ligand.
Figure 8.
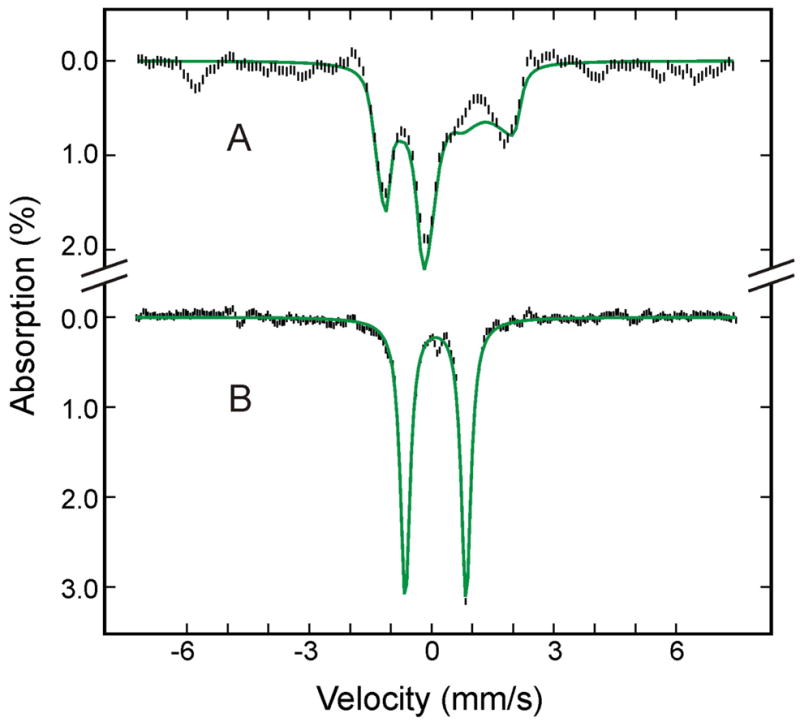
Mössbauer spectra of (FeIV=O2−)Mb prepared from the raw spectra recorded at 4.2 K in a parallel field of 8 T (A) or 50 mT (C) (see text for details). The green solid lines are theoretical spectra simulated with the parameters listed in Table 2.
DISCUSSION
Electronic Structure Analysis
Because of the diverse and important biological functions of heme proteins, and the well-defined equatorial environment provided by the porphyrin ligand, considerable effort had been made to correlate EPR g values with the axial ligands of low-spin ferriheme proteins.48,49 Since then, extensive and systematic efforts have been made to correlate g values with planar ligand orientations and ligand π-donor/acceptor properties of a series of bis-imidazole/bis-pyridine/bis-cyanide heme model complexes.36 On the basis of the spread of the three principal g values, three types of complexes are identified.30,36 Types I and II are characterized by a (dxy)2(dxz, dyz)3 = dπ ground state configuration (the z-axis is defined as the heme normal) and a sum of the squares of the g values, Σg2, close to 16. For these two types of compounds, the g spread was found to correlate with the angle between the two axial ligand planes. Type III compounds are few and exhibit axial EPR signals with small g spreads (Δg < 0.5) and Σg2 < 14. It has been proposed that these model complexes are characterized by an unusual (dxz, dyz)4(dxy)1 = dxy configuration.50,51 It has been argued that such an unusual electronic configuration, with the unpaired electron residing in the dxy orbital, is a result of extensive ruffling of the porphyrin core.52 We have previously assigned the low-spin ferric peroxo/hydroperoxo heme intermediate to a type I/II complex, with the pyrrole 14N quadrupole coupling indicating that g1 (the largest principal g value) axis is normal to the heme plane.2,5,45 The fact that all the low-spin ferric-peroxo/hydroperoxo heme intermediates studied so far exhibit EPR signals with small g spread and Σg2 ≈ 14 might be suggested to raise the question of whether these reactive intermediates have their unpaired electrons in the dxy orbital with g1 lying in plane.53 However, our analysis of the Mössbauer spectra of the (FeIII-O2H−)HO and (FeIII-O22−)Mb intermediates indicates that the magnetic properties of these intermediates can be explained properly with the normal dπ configuration on the basis of the Griffith’s crystal field model28 and assuming a monoclinic symmetry in which the rhombic field axis system is rotated by 45° about the z-axis of the tetragonal axis system. Mössbauer spectra of powder samples do not contain information concerning the orientations of the g and A tensors with respect to the molecular axis system, but confirmation for the dπ assignment in fact comes from a single crystal EPR measurement of the (FeIII-O2 2−)Mb,43 in which g1(=2.22) was found to be normal to the heme plane, the gy = 2.11 axis was found in the heme plane, and the largest magnetic hyperfine interaction was found to be aligned with this gy = 2.11 axis. In agreement with this single crystal measurement, the above assignment yields the largest A component, Ayy, aligned with gy = 2.11. Furthermore, several low-spin ferric hydroperoxo model complexes of pentadentate N ligands have been characterized structurally and spectroscopically.38–40 These complexes also exhibit EPR signals with small g spreads and Σg2 ≈ 14. Here, too, analysis of the Mössbauer spectra of these complexes revealed a monoclinic symmetry and dπ ground state configuration. It should be noted that in the studies of Simaan et al.38 and Horner et al.,40 the electronic configuration was identified as dxy, but their y-axis was defined along the Fe-axial ligand direction and thus the assignments are identical. Interestingly, DFT calculations of one of these model complexes39 indicates that the bent hydroperoxo ligand is oriented in a direction bisecting an equatorial N-Fe-N angle and that interaction between the πv* orbital of the hydroperoxo ligand with one of the metal dπ orbitals then defines the 45°-rotated rhombic frame. Our analysis of the (FeIII-O2H−)HO Mössbauer spectra is consistent with this DFT interpretation as the x-ray crystallographic structure of oxy-HO has revealed an O-O orientation bisecting the equatorial N-Fe-N angle and pointing toward the α-meso carbon that is to be hydroxylated.54
Thus, it can be concluded that in the case of low-spin ferric peroxo/hydroperoxo hemes, the observed EPR spectra with small g spread and Σg2 ≈ 14 do not indicate a dxy ground state configuration, but in fact reflect a dπ configuration with a monoclinic symmetry surrounding the heme Fe. Furthermore, our Mössbauer analysis, which indicates a dπ configuration for the (FeIII-O2H−)HO intermediate, does not support the proposal by Rivera and coworkers16,53,55 that the dxy state is a signature of the HO distal cavity. This conclusion likewise was reached in a recent NMR study of a ferric hydroxo-HO.56 The proposal by Rivera was mainly based on the detection of unusual 13C NMR spectra of the hydroxide complex of HO from Pseudomonas aeroginosa reconstituted with 13C labeled heme.55 However, a recent proton NMR investigation of the ferric hydroxide complex of a homologous HO from Neisseria meningitidis has demonstrated unambiguously a dπ ground state for the hydroxide complex.56
Reaction Pathways for Reduced Oxy-Ferrous Hemes
In the present study, we have used 77 K cryoreduction to generate the one-electron reduced O2-bound ferrous heme in heme oxygenase for Mössbauer characterization. The reaction of this one-electron reduced intermediate was then initiated by annealing the frozen sample at temperatures above 77 K and the decay pathway was investigated by Mössbauer and EPR spectroscopies. For comparison, a parallel study has also been performed on myoglobin, a tacit mimic of monooxygenase heme enzymes. The results show that one-electron reduction of the O2 bound ferrous hemes of HO and Mb generates spectroscopically distinct intermediates that decay via different reaction pathways. One-electron reduction of (FeII-O2)HO is accompanied by protonation of the bound O2 to generate a low-spin ferric-hydroperoxo intermediate, (FeIII-O2H−)HO, that undergoes self hydroxylation to form the α-meso-hydroxyhemin HO product. Mössbauer quantification further establishes that conversion of the (FeIII-O2H−)HO to the α-meso-hydroxyhemin product is quantitative and that no other intermediates are detected during this conversion.
In contrast, one-electron reduction of (FeII-O2)Mb yields a low-spin ferric-peroxo intermediate, (FeIII-O22−)Mb, that exhibits characteristic Mössbauer and EPR properties different from those of the (FeIII-O2H−)HO (see Table 2). In accordance with previous EPR/ENDOR investigations,2,9,43 a subsequent protonation of this ferric-peroxo complex generates a ferric-hydroperoxide, (FeIII-O2H−)Mb, that displays EPR resonances similar to those of the (FeIII-O2H−)HO (see Figure 5). Unfortunately, due to the low concentration of this ferric-hydroperoxo intermediate present in the Mössbauer sample, characterization of this species by Mössbauer spectroscopy was not possible. But, interestingly, the Mössbauer data show that a ferryl complex, (FeIV=O2−)Mb, has accumulated following the disappearance of the low-spin ferric-peroxo/hydroperoxo species. This ferryl complex exhibits magnetic properties that are characteristic of the compound II species generated in the reactions of peroxides with heme peroxidases and with myoglobin.20,46 The absence of a detectable accumulation of compound I is consistent with the fact that compound I is unstable in wild-type Mb.10,13
Generation of reactive high-valent ferryl species within a Compound I via ferric-peroxo and hydroperoxo intermediates is believed to be the key oxygen-activation steps involved in the catalytic cycles of P450-type monooxygenases.1 The Mössbauer data presented here provide direct spectroscopic evidence supporting the idea that ferric-hydroperoxo heme complexes are indeed the precursors of the reactive ferryl intermediates. The fact that a ferryl intermediate does not accumulate in HO underscores the determining roles of protein structure in controlling the reactivity of reaction intermediates. In this particular case, the presence of an extensive hydrogen bond network involving H2O at the distal heme pocket of HO and the differences in the basicity and orientation of the proximal histidine ligands of the two proteins54,57,58 could be at the root of the observed distinct reactivities. Very recently, employing a combination of Mössbauer, DFT and resonance Raman approaches, Green and coworkers59–61 demonstrated that the ferryl species in Compound II of chloroperoxidase and P450 are protonated FeIV-OH complexes at physiological pH.
In summary, we have demonstrated that Mössbauer spectroscopy in conjunction with cryoreduction/annealing techniques is a useful approach for the study of reaction pathways involving reactive iron intermediates in proteins. Here, we have used this approach to characterize the decay pathways of the one-electron reduced oxyheme intermediates in HO and Mb. The results reveal in details that distinct steps are taken by this active-oxygen intermediate within the two proteins, giving emphasis to the importance of protein structural control on the reactivity of metal cofactors in enzymes.
Supplementary Material
: Figures S1 and S2. This material is free of charge via the Internet at http://pubs.acs.org.
Acknowledgments
This work was supported by grants from the National Institutes of Health (GM47295 to B.H.H. and GM51084 to B.M.H.) and the Grants-in-aid for Scientific Research from the Ministry of Education, Science, Culture and Sport, Japan (18770103 to T.M. and 18370052 to M.I.S.)
References
- 1.Sono M, Roach MP, Coulter ED, Dawson JH. Chem Rev. 1996;96:2841–2887. doi: 10.1021/cr9500500. [DOI] [PubMed] [Google Scholar]
- 2.Davydov R, Macdonald IDG, Makris TM, Sligar SG, Hoffman BM. J Am Chem Soc. 1999;121:10654–10655. [Google Scholar]
- 3.Davydov RM, Yoshida T, Ikeda-Saito M, Hoffman BM. J Am Chem Soc. 1999;121:10656–10657. [Google Scholar]
- 4.Davydov R, Makris TM, Kofman V, Werst DE, Sligar SG, Hoffman BM. J Am Chem Soc. 2001;123:1403–1415. doi: 10.1021/ja003583l. [DOI] [PubMed] [Google Scholar]
- 5.Davydov R, Kofman V, Fujii H, Yoshida T, Ikeda-Saito M, Hoffman BM. J Am Chem Soc. 2002;124:1798–1808. doi: 10.1021/ja0122391. [DOI] [PubMed] [Google Scholar]
- 6.Davydov RM, Perera R, Jin S, Yang TC, Bryson TA, Sono M, Dawson JH, Hoffman BM. J Am Chem Soc. 2005;127:1403–1413. doi: 10.1021/ja045351i. [DOI] [PubMed] [Google Scholar]
- 7.Jin S, Makris TM, Bryson TA, Sligar SG, Dawson JH. J Am Chem Soc. 2003;125:3406–3407. doi: 10.1021/ja029272n. [DOI] [PubMed] [Google Scholar]
- 8.Matsui T, Kim SH, Jin H, Hoffman BM, Ikeda-Saito M. J Am Chem Soc. 2006;126:1090–1091. doi: 10.1021/ja057578z. [DOI] [PubMed] [Google Scholar]
- 9.Kappl R, Höhn-Berlage M, Hüttermann J, Bartlett N, Symons MCR. Biochim Biophys Acta. 1985;827:327–343. [Google Scholar]
- 10.Cooper CE, Jurd M, Nicholls P, Wankasi MM, Svistunenko DA, Reeder BJ, Wilson MT. Dalton Trans. 2005:3483–3488. doi: 10.1039/b505786h. [DOI] [PubMed] [Google Scholar]
- 11.Egawa T, Yoshioka S, Takahashi S, Hori H, Nagano S, Shimada H, Ishimori I, Suematsu M, Ishimura Y. J Biol Chem. 2003;278:41597–41606. doi: 10.1074/jbc.M210383200. [DOI] [PubMed] [Google Scholar]
- 12.Egawa T, Shimada H, Ishimura Y. J Biol Chem. 2000;275:34858–34866. doi: 10.1074/jbc.M004026200. [DOI] [PubMed] [Google Scholar]
- 13.Matsui T, Ozaki SI, Watanabe Y. J Biol Chem. 1997;272:32735–32738. doi: 10.1074/jbc.272.52.32735. [DOI] [PubMed] [Google Scholar]
- 14.Foote N, Gadsby PMA, Greenwood C, Thomson AJ. Biochem J. 1989;261:515–522. doi: 10.1042/bj2610515. [DOI] [PMC free article] [PubMed] [Google Scholar]
- 15.George P, Irvine DH. Nature. 1951;168:164–165. doi: 10.1038/168164b0. [DOI] [PubMed] [Google Scholar]
- 16.Rivera M, Zeng Y. J Inorg Biochem. 2005;99:337–354. doi: 10.1016/j.jinorgbio.2004.09.016. [DOI] [PubMed] [Google Scholar]
- 17.Matera KM, Zhou H, Migita CT, Hobert SE, Ishikawa K, Katakura K, Maeshima H, Yoshida T, Ikeda-Saito M. Biochemistry. 1997;36:4909–4915. doi: 10.1021/bi962321m. [DOI] [PubMed] [Google Scholar]
- 18.Hayashi T, Matsuo T, Hitomi Y, Okawa K, Suzuki A, Shiro Y, Iizuka T, Hisaeda Y, Ogoshi H. J Inorg Biochem. 2002;91:94–100. doi: 10.1016/s0162-0134(02)00423-3. [DOI] [PubMed] [Google Scholar]
- 19.Ravi N, Bollinger JM, Jr, Huynh BH, Stubbe J, Edmondson DE. J Am Chem Soc. 1994;116:8007–8014. [Google Scholar]
- 20.Debrunner PG. In: Phys Bioinorg Chem Series: Iron Porphyrins Part III. Lever ABP, Gray HB, editors. Vol. 4. VCH Publishers; New York: 1989. pp. 137–234. [Google Scholar]
- 21.Dickinson LC, Symons MCR. Chem Soc Rev. 1983;12:387–414. [Google Scholar]
- 22.Feher G, Isaacson RA, Scholes CP, Nagel R. Ann N Y Acad Sci. 1973;222:86–101. doi: 10.1111/j.1749-6632.1973.tb15254.x. [DOI] [PubMed] [Google Scholar]
- 23.Thomanek UF, Parak F, Formanek S, Kalvius GM. Biophys Struct Mech. 1977;3:207. doi: 10.1007/BF00535697. [DOI] [PubMed] [Google Scholar]
- 24.Magonov SN, Davydov RM, Blyumenfeld LA, Vilu RO, Sharonov YA. Mol Biol (Russian) 1978;12:913–919. [Google Scholar]
- 25.Prusakov VE, Steyer J, Parak FG. Biophys J. 1995;68:2524–2530. doi: 10.1016/S0006-3495(95)80435-2. [DOI] [PMC free article] [PubMed] [Google Scholar]
- 26.Della-Longa S, Arcovito A, Benfatto M, Congiu-Castellano A, Girasole M, Hazemann JL. Biophys J. 2003;85:549–558. doi: 10.1016/S0006-3495(03)74499-3. [DOI] [PMC free article] [PubMed] [Google Scholar]
- 27.Kotani M. Adv Chem Phys. 1965;7:159–181. [Google Scholar]
- 28.Griffith JS. Mol Phys. 1971;21:135–139. [Google Scholar]
- 29.Oosterhuis WT, Lang G. Phys Rev. 1969;178:439–456. [Google Scholar]
- 30.Benda R, Schuenemann V, Trautwein AX, Cai S, Reddy Polam J, Watson CT, Shokhireva TK, Walker FA. J Biol Inor Chem. 2003;8:787–801. doi: 10.1007/s00775-003-0472-5. [DOI] [PubMed] [Google Scholar]
- 31.Nasri H, Wang Y, Huynh BH, Walker FA, Scheidt WR. Inorg Chem. 1991;30:4682. [Google Scholar]
- 32.Costa C, Moura JJG, Moura I, Liu MY, Peck HD, Jr, LeGall J, Wang Y, Huynh BH. J Biol Chem. 1990;265:14382–14387. [PubMed] [Google Scholar]
- 33.Walker FA, Huynh BH, Scheidt WR, Osvath SR. J Am Chem Soc. 1986;108:5288–5297. [Google Scholar]
- 34.Huynh BH, Emptage MH, Münck E. Biochim Biophys Acta. 1978;534:295–306. doi: 10.1016/0005-2795(78)90012-0. [DOI] [PubMed] [Google Scholar]
- 35.Taylor CPS. Biochim Biophys Acta. 1977;491:137–149. doi: 10.1016/0005-2795(77)90049-6. [DOI] [PubMed] [Google Scholar]
- 36.Walker FA. Chem Rev. 2004;104:589–615. doi: 10.1021/cr020634j. [DOI] [PubMed] [Google Scholar]
- 37.Rhynard D, Lang G, Spartalian K, Yonetani T. J Chem Phys. 1979;71:3715–3721. [Google Scholar]
- 38.Simaan AJ, Banse F, Girerd JJ, Wieghardt K, Bill E. Inor Chem. 2001;40:6538–6540. doi: 10.1021/ic010635e. [DOI] [PubMed] [Google Scholar]
- 39.Roelfes G, Vrajmasu V, Chen K, Ho RYN, Rohde JU, Zondervan C, la Crois RM, Schudde EP, Lutz M, Spek AL, Hage R, Feringa BL, Münck E, Que L., Jr Inor Chem. 2003;42:2639–2653. doi: 10.1021/ic034065p. [DOI] [PubMed] [Google Scholar]
- 40.Horner O, Jeandey C, Oddou JL, Bonville P, McKenzie CJ, Latour JM. Eur J Inor Chem. 2002:3278–3283. [Google Scholar]
- 41.Davydov RM, Matsui T, Fujii H, Ikeda-Saito M, Hoffman BM. J Am Chem Soc. 2003;125:16208–16209. doi: 10.1021/ja038923s. [DOI] [PubMed] [Google Scholar]
- 42.Matera KM, Takahashi S, Fujii H, Zhou H, Ishikawa K, Yoshimura T, Rousseau DL, Yoshida T, Ikeda-Saito M. J Biol Chem. 1996;271:6618–6624. doi: 10.1074/jbc.271.12.6618. [DOI] [PubMed] [Google Scholar]
- 43.Leibl W, Nitschke W, Hüttermann J. Biochim Biophys Acta. 1986;870:20–30. doi: 10.1016/0167-4838(86)90004-x. [DOI] [PubMed] [Google Scholar]
- 44.Symons MCR, Petersen RL. Proc R Soc London B. 1978;201:285–300. doi: 10.1098/rspb.1978.0046. [DOI] [PubMed] [Google Scholar]
- 45.Davydov RM, Kofman V, Nocek JM, Noble RW, Hui H, Hoffman BM. Biochemistry. 2004;43:6330–6338. doi: 10.1021/bi036273z. [DOI] [PubMed] [Google Scholar]
- 46.Schulz CE, Chiang R, Debrunner PG. J Physique. 1979;40:C2–534. [Google Scholar]
- 47.Winkler H, Ding XQ, Burkardt M, Trautwein AX, Parak F. Hyperfine Interaction. 1994;91:875–878. [Google Scholar]
- 48.Blumberg WE, Peisach J. In: Probes of Structure and Function of Macromolecules and Membranes. Chance B, Yonetani T, Mildvan AS, editors. Vol. 2. Academic Press; New York: 1971. pp. 215–229. [Google Scholar]
- 49.Peisach J, Blumberg WE, Adler A. Ann N Y Acad Sci. 1973;206:310–327. doi: 10.1111/j.1749-6632.1973.tb43219.x. [DOI] [PubMed] [Google Scholar]
- 50.Walker FA, Nasri H, Turowska-Tyrk I, Mohanrao K, Watson CT, Shokhireva NV, Debrunner PG, Scheidt WR. J Am Chem Soc. 1996;118:12109–12118. [Google Scholar]
- 51.Simonneaux G, Schünemann V, Morice C, Carel L, Toupet L, Winkler H, Trautwein AX, Walker FA. J Am Chem Soc. 2000;122:4366–4377. [Google Scholar]
- 52.Safo MK, Walker FA, Raitsimring AM, Walters WP, Dolata DP, Debrunner PG, Scheidt WR. J Am Chem Soc. 1994;116:7760–7770. [Google Scholar]
- 53.Rivera M, Caignan GA, Astashkin AV, Raitsimring AM, Shokhireva TK, Walker FA. J Am Chem Soc. 2002;124:6077–6089. doi: 10.1021/ja017334o. [DOI] [PubMed] [Google Scholar]
- 54.Unno M, Matsui T, Chu GC, Couture M, Yoshida T, Rousseau DL, Olson JS, Ikeda-Saito M. J Biol Chem. 2004;279:21055–21061. doi: 10.1074/jbc.M400491200. [DOI] [PubMed] [Google Scholar]
- 55.Caignan GA, Deshmukh R, Zeng Y, Wilks A, Bunce RA, Rivera M. J Am Chem Soc. 2003;125:11842–11852. doi: 10.1021/ja036147i. [DOI] [PubMed] [Google Scholar]
- 56.Ma LH, Liu Y, Zhang X, Yoshida T, La Mar GN. J Am Chem Soc. 2006;128:6657–6668. doi: 10.1021/ja0584626. [DOI] [PMC free article] [PubMed] [Google Scholar]
- 57.Hirotsu S, Chu GC, Unno M, Lee DS, Yoshida T, Park SY, Shiro Y, Ikeda-Saito M. J Biol Chem. 2004;279:119337–111947. doi: 10.1074/jbc.M311631200. [DOI] [PubMed] [Google Scholar]
- 58.Matsui T, Furukawa M, Unno M, Tomita T, Ikeda-Saito M. J Biol Chem. 2005;280:2981–2989. doi: 10.1074/jbc.M410263200. [DOI] [PubMed] [Google Scholar]
- 59.Stone KL, Hoffart LM, Behan RK, Krebs C, Green MT. J Am Chem Soc. 2006;128:6147–6153. doi: 10.1021/ja057876w. [DOI] [PubMed] [Google Scholar]
- 60.Behan RK, Hoffart LM, Stone KL, Krebs C, Green MT. J Am Chem Soc. 2006 doi: 10.1021/ja057876w. ASAP. [DOI] [PubMed] [Google Scholar]
- 61.Stone KL, Behan RK, Green MT. Proc Natl Acd Sci. 2006;103:12307–12310. doi: 10.1073/pnas.0603159103. [DOI] [PMC free article] [PubMed] [Google Scholar]
Associated Data
This section collects any data citations, data availability statements, or supplementary materials included in this article.
Supplementary Materials
: Figures S1 and S2. This material is free of charge via the Internet at http://pubs.acs.org.