Abstract
The hydraulic conductivity of a connective tissue is determined both by the fine ultrastructure of the extracellular matrix and the effects of larger particles in the interstitial space. In this study, we explored this relationship by examining the effects of 30- or 90-nm-diameter latex nanospheres or low-density lipoproteins (LDL) on the hydraulic conductivity of Matrigel, a basement membrane matrix. The hydraulic conductivity of Matrigel with latex nanospheres or LDL particles added at 4.8% weight fraction was measured and compared with the hydraulic conductivity of Matrigel alone. The LDL-derived lipids in the gel were visualized by transmission electron microscopy and were seen to have aggregated into particles up to 500 nm in size. The addition of these materials to the medium markedly decreased its hydraulic conductivity, with the LDL-derived lipids having a much larger effect than did the latex nanospheres. Debye-Brinkman theory was used to predict the effect of addition of particles to the hydraulic conductivity of the medium. The theoretical predictions matched well with the results from adding latex nanospheres to the medium. However, LDL decreased hydraulic conductivity much more than was predicted by the theory. The validation of the theoretical model for rigid particles embedded in extracellular matrix suggests that it could be used to make predictions about the influence of particulates (e.g., collagen, elastin, cells) on the hydraulic conductivity of the fine filamentous matrix (the proteoglycans) in connective tissues. In addition, the larger-than-predicted effects of lipidlike particles on hydraulic conductivity may magnify the pathology associated with lipid accumulation, such as in Bruch's membrane of the retina during macular degeneration and the blood vessel wall in atherosclerosis.
Keywords: Brinkman, gel, LDL, microspheres
the hydraulic conductivities of connective tissues are primarily determined by the ultrastructure of their extracellular matrixes. The concentration and molecular dimensions of the glycosaminoglycans, proteoglycans, glycoproteins, and/or collagen microfibrils in these tissues control the extent to which these tissues are permeable (21). However, the hydraulic conductivity can also be influenced by larger structures that are embedded in these matrixes such as cells, elastin, and collagen fibers. With aging and in disease, lipids accumulate in tissues such as blood vessel walls (12, 33) and in the human eye, in Bruch's membrane behind the retina (4, 29, 32). This lipid accumulation can reduce transport through these tissues and, in some tissues, can have pathological implications (1, 22, 29). Here we investigate how the inclusion of such material modifies the hydraulic conductivity of an extracellular matrix.
Matrigel basement membrane matrix is a solubilized basement membrane preparation extracted from the Engelbreth-Holm-Swarm (EHS) mouse sarcoma. The major constituents of Matrigel (including collagen type IV, laminin, and heparin sulfate) are the same as those found in basement membranes in general, such as Bruch's membrane. We previously used this matrix as a model for transport through basement membranes and determined its hydraulic conductivity as a function of perfusion pressure (24).
In the present study, we added latex nanospheres or low-density lipoprotein (LDL) to Matrigel preparations and determined the hydraulic conductivity as a function of perfusion pressures. By comparing our results to the hydraulic conductivity of these preparations without these materials, we determined the extent to which the hydraulic conductivity was reduced by such inclusions. We also compared our results to predictions using the Debye-Brinkman theory.
EXPERIMENTAL METHODS
Materials.
Matrigel (20.2 or 20.6 mg/ml) was obtained from BD Biosciences (San Jose, CA). These samples were thawed to 4°C in a refrigerator and transferred by pipette into individual 150-μl aliquots, each in a 0.50-ml plastic microcentrifuge tube, and then refrozen at −20°C. This process was done to minimize the need to thaw and refreeze the Matrigel samples. The night before use of a sample, an aliquot of Matrigel for each trial was taken out of the freezer and allowed to thaw in a beaker in the refrigerator.
For control samples (no particulates), the Matrigel was diluted to approximately a 1% weight fraction with water that was filtered through a Nanopure Infinity Ultrapure water system (Barnstead, Dubuque, IA). The resulting solutions were mixed by hand with a small metal bar and by pipetting up and down until they appeared uniform. These solutions were equilibrated with Dulbecco's phosphate-buffered saline (PBS) (Sigma, St. Louis, MO) before the start of an experiment.
Latex nanospheres with diameters of 30 or 90 nm at a 10% weight fraction in water were obtained (5000 Series Latex Microspheres; Duke Scientific, Fremont, CA). Equal volumes (150 μl each) of 30- or 90-nm nanospheres in solution and Matrigel at 4°C were combined and then mixed together as described above. This resulted in a solution with ∼1% Matrigel and 5% nanospheres (weight fractions). The volume fraction of nanospheres in this solution was 4.8% based on an average density for the nanospheres of 1.05 g/ml (matched to LDL, see below in this section).
Lyophilized human plasma LDL samples were obtained from Sigma-Aldrich (St. Louis, MO). Each vial of LDL contained between 17.3 and 21.3 mg of lipid, associated proteins, and 0.3 mg of EDTA (23). The lyophilized powder from five to six vials was combined with 1 ml of purified water (with ∼1 mg/ml of sodium azide) in a beaker to make a 100 mg/ml lipid solution. The solution was mixed with a stir bar at a medium setting for 4–5 h, until the solids had completely dissolved. As with the nanosphere solutions, 150-μl samples of the lipid solution were mixed together with 150-μl aliquots of Matrigel at 4°C and stirred both manually and with a pipette until the solution appeared homogenous. This resulted in a solution with ∼1% Matrigel and 5% LDL (weight fractions). The volume fraction of LDL in this solution was 4.8%, based on an average density for LDL of 1.05 g/ml reported by the supplier.
Apparatus and perfusion procedure.
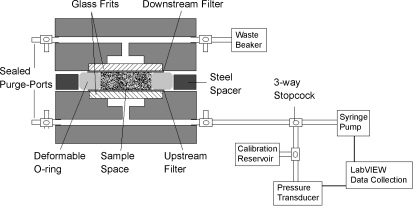
Our methods closely follow those previously described (24). Briefly, a computer-controlled perfusion system was used to maintain a constant perfusion pressure while determining the flow rate passing through the system (Fig. 1). The gel preparations were placed into a custom-made acrylic flow chamber, between two 50-nm pore-size, 13-mm-diameter polycarbonate filters (Millipore, Billerica, MA) that were supported by two porous glass frit discs, 12 mm in diameter (Adams & Chittenden Scientific Glass, Berkeley, CA). These filters were used to trap the gel within the flow chamber. A rubber O-ring, 1.75 mm thick with an inner diameter of 9 mm, provided the lateral walls of the sample space surround the gel. Surrounding this O-ring, a flat steel washer, 1.25 mm thick with outer diameter 47 mm and inner diameter 32 mm, acted as a solid spacer that determined the initial thickness of the gel. Leakage testing was done on the system to ensure that flow channeling around the gel samples did not occur during our measurement process (23, 24).
Fig. 1.
Schematic of experimental system and flow chamber.
The perfusion procedure involved placing the sample to be tested into one-half of the flow chamber, on top of one of the filters and inside the O-ring. The sample was allowed to solidify for 45 min at room temperature. The two halves of the flow chamber were then clamped together until each half rested against the steel spacer, preventing further clamping. The volume of sample used in the experiment was chosen such that when the two halves of the flow chamber were clamped together, being separated only by the spacer, the sample would be compressed by ∼10%. This was done to ensure a tight seal and prevent leaks. The device was allowed to sit until the pressure, built up during the clamping process, returned to a stabilized value for ∼15 min, which typically took 4 h.
The perfusion fluid was Dulbecco's PBS (Sigma). For each perfusion pressure to be investigated, the system was perfused with PBS at constant pressure until the flow rate had stabilized at a constant value over the previous hour. It typically took at least 5 h to ensure that the flow rate had in fact reached a constant value. The experiment was continued for an additional 5–10 h at this stabilized value to determine the hydraulic conductivity. A variety of pressures between 3 and 100 mmHg were investigated, with each gel preparation used to make measurements at 1–3 perfusion pressures.
The flow resistance (Rgel) of a gel sample was found by determining the total flow resistance of the system (pressure drop divided by flow rate: ΔP/Q) and then subtracting off the resistance of the system without the gel. This latter resistance was found to be 23.6 ± 5.7 mmHg·min−1·μl−1 (mean ± SD, n = 5) (24). Resistance values of the gel samples were typically greater than 150 mmHg·min−1·μl−1, making the resistance of the system without the gel less than 15% of the total measured resistance. Hydraulic conductivity (Lp) was determined as
 |
(1) |
where A (0.64 cm2) is the cross-sectional area of the gel facing flow. Typical variability in the measured hydraulic conductivity during an experiment was ∼10%.
Specific hydraulic conductivity, necessary for comparison with our theoretical model, was determined as (21)
 |
(2) |
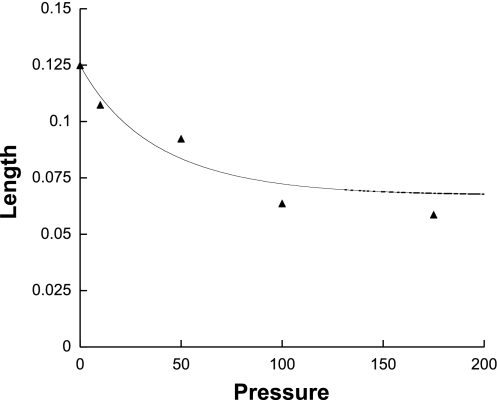
where μ was the viscosity of the perfusion fluid and L was the flowwise length of the medium. The flowwise length as a function of perfusion pressure was determined in our previous study on Matrigel (24), and is shown in Fig. 2 (the compaction was shown to be reversible). The curve shown is the best fit of the data (24) and was used to determine L for the present study.
Fig. 2.
Length of 1% Matrigel in flow-wise direction (cm) as a function of perfusion pressure (mmHg).
In addition to measurements on Matrigel preparations, thickness tests were performed on a 1% Matrigel sample with 90-nm nanospheres (4.8% volume fraction) included. The gel was compressed at 175 mmHg, and thickness measurements for deformation of the gel with nanospheres were compared with thickness measurements for a 1% Matrigel sample perfused at the same pressure.
Electron microscopic examination.
To characterize further the effects of lipid accumulation on the hydraulic conductivity of Matrigel, images of the gels with the lipids were obtained using the osmium-thiocarbohydrazide-osmium, tannic acid- paraphenylenediamine (OTAP) method. This postfixation method for thin-section transmission electron microscopy was pioneered by Guyton and Klemp (14) to better visualize lipids in extracellular matrix and to distinguish lipid vesicles composed of phospholipids and unesterified cholesterol from neutral lipid droplets containing cholesteryl esters in atherosclerotic arterial tissue. Membranous material is uniformly stained black, whereas lipid droplets are typically translucent, usually with a black border (5, 19).
Gels were fixed in 1% glutaraldehyde in PBS overnight and then washed in PBS. They were then rinsed and treated with 1% osmium in 0.1 M PBS (2.5 h), 1% tannic acid (gallotannin, C14H10O9, 30 min), 1% sodium sulfate (Na2SO4, 5 min), 70% ethanol (3×5 min), and 1% paraphenylenediamine in 70% ethanol for 30 min. Gels were dehydrated, infiltrated, and embedded in PolyBed 812 (Polysciences, Warrington, PA). Thin sections were examined via a JEOL1200 EXII transmission electron microscope (JEOL USA, Peabody, MA). Images were taken (Kodak EM film 4489), scanned at 600 dpi, and analyzed for particle sizes and area fraction via NIH Image. Volume fractions were estimated by assuming them equal to the measured area fractions, appropriate for a medium with randomly dispersed components (27).
Statistical methods.
The thickness measurements for 1% Matrigel (8 measurements on 1 gel) were compared with those for 1% Matrigel with 4.8% 90-nm nanospheres (6 measurements) perfused at the same rate and pressure using a t-test for two samples assuming unequal variances.
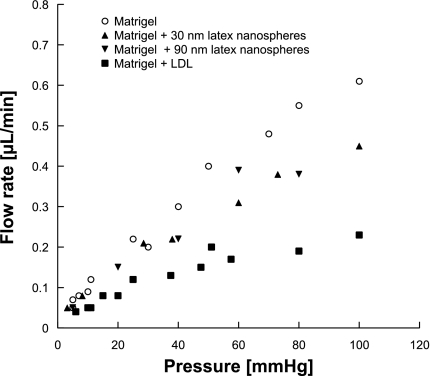
A linear regression analysis was used to fit the flow rate vs. pressure drop data (Fig. 4) for Matrigel, Matrigel + 30-nm particles, Matrigel + 90-nm particles, and Matrigel + LDL. The slopes were compared and were considered to be significantly different from one another if the P value for this comparison was <0.05.
Fig. 4.
Flow rate of Matrigel, Matrigel with 4.8% latex nanospheres, or Matrigel with LDL added as a function of perfusion pressure (mmHg). Each data point represents 1 experiment.
THEORETICAL MODEL
A theoretical description of the effect of solid particles within a gel on that medium's hydraulic conductivity was developed to better understand the experimental data. We used Darcy's law
 |
(3) |
to describe the superficial velocity field (V→) around a set of spheres embedded in a matrix of specific hydraulic conductivity Km driven by a pressure P. Darcy's law has been used to characterize transport through macromolecular networks in a variety of geometries (7, 21, 28, 39).
We used the unit cell approach in which a single particle surrounded by matrix is modeled in a finite domain such that the fraction of this domain occupied by the sphere is the same as the volume fraction of spheres in the medium. A spherical domain is chosen for analytical simplicity (15).
The continuity equation is introduced into Eq. 3, with Km assumed to be constant over the small length of an individual unit cell, resulting in Laplace's equation for the pressure distribution:
 |
(4) |
Boundary conditions are chosen such that 1) there is no flow normal to the surface of the particle, and 2) a uniform flow is entering and leaving the domain at the periphery:
 |
(5a) |
 |
(5b) |
where V0 is the mean superficial fluid velocity in the medium.
Equations 4 and 5 can be solved by introducing spherical harmonics with the result that
 |
(6) |
where φ = ra3/rb3 is the solid fraction of particles in the medium.
The mean pressure gradient in the medium in the direction of flow can be found as
 |
(7) |
Comparing this with Darcy's law (in 1-D), we can conclude that the effective specific hydraulic conductivity (K) of a porous medium of specific hydraulic conductivity Km containing a solid fraction φ of impermeable particulates is
 |
(8) |
Darcy's law does not allow the no-slip boundary condition at the particle surface to be satisfied, and thus shear forces at the surface of the particle have been neglected in this approach. To include these forces, it is convenient to rewrite Eq. 8 in terms of the net force acting on each solid particle (Fp). By integrating the pressure force (Eq. 6) acting on the surface of a particle to find Fp, we can then determine that
 |
(9) |
Brinkman's equation allows the no-slip condition to be satisfied and has been successfully used to model transport through macromolecular networks (6, 8, 9, 31, 39, 40). Brinkman determined the force acting on a sphere of radius ra in a porous medium of specific hydraulic conductivity K through which a fluid passes at an interstitial velocity V and found (2)
 |
(10) |
The terms in the brackets in Eq. 10 represent, respectively, the Stokes drag on the particle, the additional shear forces acting on the particle due to the presence of the porous medium (including other particles in the medium), and the additional pressure forces acting on the particle due to the presence of the porous medium (again, including other particles in the medium). Note that we will use K rather than Km in Eq. 10, since hydrodynamic interactions between the particles are included in this approach. If the limit of particles much larger than the matrix interfiber spacing is considered (ra ≫  ), we find that
 |
(11) |
This is the same as Eq. 8 to order φ. The difference between the two equations is that Eq. 11 includes hydrodynamic interactions between nearby particles, where this small correction is not included in Eq. 8. To account for the viscous effects at the surface of the particle, Eq. 10 is substituted into Eq. 9. Recognizing that V = V0/(1 − φ), we find that
 |
(12) |
Note that Eq. 12 is an implicit equation for K, as originally pointed out by Brinkman. This arises because the particles alter the specific hydraulic conductivity of the medium that in turn affects the drag force acting on the particles themselves.
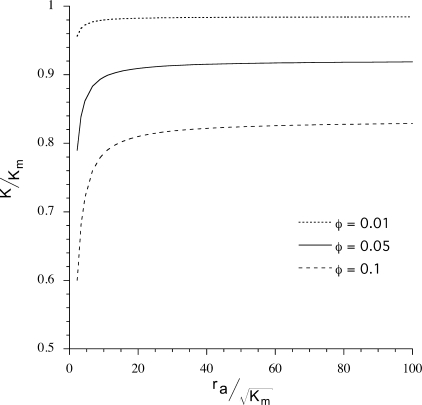
Solutions to Eq. 12 as a function of particle radius ra are shown in Fig. 3. The figure shows that when ra is much greater than  (a length scale characterizing fluid flow through a porous medium), particle size has little effect on hydraulic conductivity. For our gels,
  is ∼4 nm, and thus for φ = 0.05, hydraulic conductivity becomes insensitive to particle size for particles larger than ∼100 nm.
Fig. 3.
Specific hydraulic conductivity (K) of gel with added round particles as a function of particle radius (ra) for 3 particle volume fractions in the gel of φ = 0.01, 0.05, and 0.1. Km is the specific hydraulic conductivity without added particles (φ = 0) and  is the characteristic hydrodynamic length scale of the gel. Using Km ≈ 2 × 10⁻¹³ cm2, the effect of particle size on K becomes constant for radii greater than ∼100 nm.
Equation 12 can be written as a quadratic equation for K. To solve this equation as a function of perfusion pressure requires values of φ and Km as functions of pressure. The φ increases with increasing perfusion pressure due to compression of the gel in the flowwise direction (Fig. 2). To account for this effect, we let φ = φ0 (L0/L) where L0 is the unpressurized length of the gel and φ0 is the original volume fraction of nanospheres in the gels (4.8%).
We have previously determined Km as a function of pressure (24). We use the biphasic model that we developed (24) to fit these data. This model characterizes Matrigel in terms of three parameters: the nondeformed specific hydraulic conductivity, K0; the confined compression modulus, HA; and a parameter M that characterizes the dependence of the specific hydraulic conductivity of the gel on the extent of tissue compaction. We used HA = 36 mmHg (24) and M = 1.17 (24) and then did a best fit to the 1% Matrigel (diluted from 2%) data to find K0 = 2.6 × 10⁻¹³ cm2. The result of this fit is shown on Figs. 5 and 6 (see below in this section).
Fig. 5.
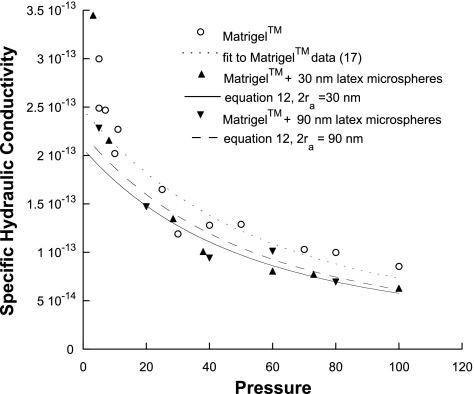
Specific hydraulic conductivity (K: cm2) of Matrigel or Matrigel with 4.8% latex nanospheres added as a function of perfusion pressure (mmHg) along with theoretical predictions. Each data point represents 1 experiment.
Fig. 6.
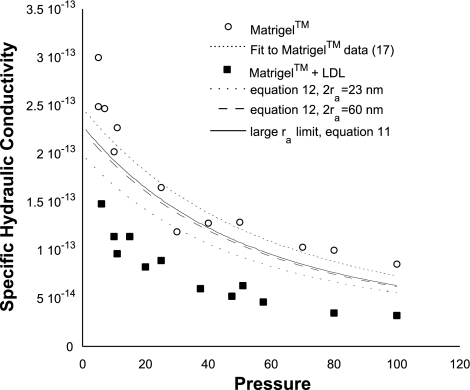
Specific hydraulic conductivity (K: cm2) of Matrigel or Matrigel with 4.8% LDL added as a function of perfusion pressure (mmHg) along with theoretical predictions. Each data point represents 1 experiment.
The suspensions that were prepared included 1% Matrigel and either 4.8% nanospheres or 4.8% LDL (by volume). Thus, in the compartment around the particulate material, the actual concentration of Matrigel will be higher than 1%. This higher concentration of Matrigel (1.049%) will decrease the value of Km compared with 1% Matrigel. In our previous study of Matrigel (24), we used a fiber matrix model that allowed us to predict the dependence of Km on concentration of Matrigel. Using this model, we find that 1.049% Matrigel will have a value of Km ∼1.067 times smaller than will 1% Matrigel. Thus we reduced the fitted values of Km by a factor of 1.067 and used these values in Eqs. 11 and 12, as appropriate.
RESULTS
Figure 4 shows the measured flow rate of the different preparations at perfusion pressures from 3 to 100 mmHg. All preparations showed an increase in flow rate and a decrease in specific hydraulic conductivity (Fig. 5) as the perfusion pressure was increased. Statistical comparisons of the four groups (Table 1) showed significant differences in slope except for the Matrigel + 30 nm particles vs. the Matrigel + 90 nm particles.
Table 1.
P values for the statistical comparisons between slopes of flow rates vs. pressure for different Matrigel preparations
| M30 | M90 | LDL | |
|---|---|---|---|
| M | P=0.0019 | P=0.0416 | P < 0.0001 |
| M30 | P=0.4081 | P < 0.0001 | |
| M90 | P = 0.0011 |
M, Matrigel; M30, Matrigel with 30-nm nanoparticles added; M90, Matrigel with 90-nm nanoparticles added; LDL, Matrigel with low-density lipoprotein added.
Addition of latex nanospheres decreased the hydraulic conductivity of the Matrigel modestly, with the effect being most apparent at the higher perfusion pressures. At lower perfusion pressures, there was considerable scatter in the data, making it more difficult to determine whether the latex particles affected the hydraulic conductivity. No difference was seen when comparing the effects of the 30-nm latex nanospheres with those of the 90-nm latex nanospheres. The pressure-induced compressions in Matrigel and Matrigel + 4.8% 90-nm nanospheres samples were measured, and no significant difference was found (P > 0.05).
LDL added to the gels had a much larger effect on the specific hydraulic conductivity of the Matrigel (Fig. 6) than did the latex nanospheres (Fig. 5), even though the volume of LDL added to the gels was similar to the volume of latex nanospheres added. This effect was easily apparent at all perfusion pressures and similar in magnitude at all pressures. The addition of 4.8% LDL typically reduced the specific hydraulic conductivity by 40–60%.
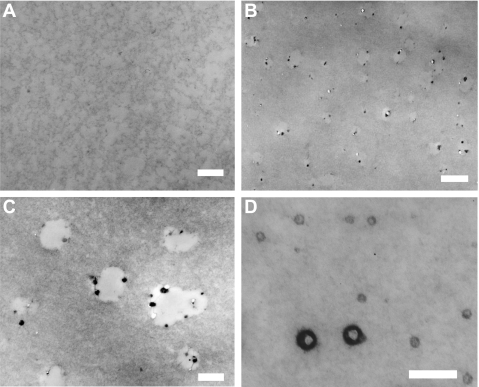
Figure 7A shows a micrograph of Matrigel alone, whereas Fig. 7, B–D shows micrographs of a preparation containing Matrigel and 4.8% LDL. Although Matrigel appeared relatively uniform, typically the images of Matrigel and 4.8% LDL showed elliptical translucent spaces in the gel and small, electron-dense particulate material. The sizes of the translucent spaces were variable, with most spaces between 400 and 500 nm in diameter, and their total area covering ∼5.1% of the micrographs. These translucent spaces are presumed to be composed of the cholesteryl esters that make up the interior of native LDL particles (see discussion).
Fig. 7.
Micrographs of a preparation containing Matrigel (A) and one containing Matrigel with 4.8% LDL (7, B–D). Although Matrigel was relatively homogenous (A), typically the images of Matrigel with LDL (B and C) showed elliptical translucent spaces in the gel and small, electron-dense particulate material. These translucent spaces are presumed to be composed of the cholesteryl esters that make up the interior of native LDL particles (see discussion). Less typically, much smaller particulates were seen in the gel (D). Scale bars: 400 nm (A and C), 1,000 nm (B), and 200 nm (D).
The particulate material was usually found on the edges of the open spaces, but it could also be found in the center of the spaces (Fig. 7C) and had an average diameter of ∼60 nm. Occasionally, but not often, regions were seen with particles as small as 30 nm in diameter (Fig. 7D) that were more heavily stained on their periphery and less stained in their center, reminiscent of the appearance of neutral lipid droplets (13). This electron-dense particulate material may be derived from the outer shell of native LDL, including apolipoproteins, phospholipids, and unesterified cholesterol (see discussion). These results suggested that nearly all of the LDL, which is 23 nm in diameter in its native state (3, 37), had aggregated into larger particles.
Comparison of theory with data.
For the Matrigel with nanospheres, the theory generally showed good agreement with the experimental measurements, except at the lowest pressures (Fig. 5). As expected, the theory predicted similar but lower K values for the 30-nm particles than for the 90-nm ones. Although the predictions show good agreement with all the experimental measurements, the small difference between 30- and 90-nm predictions is not apparent in the experimental data and statistical tests did not indicate a significant difference between those groups (P > 0.05).
Model predictions for effects of addition of LDL to the Matrigel preparations are shown in Fig. 6. We made predictions for three cases: 23-nm particles using Eq. 12, 60-nm particles using Eq. 12, and the large particle limit as found in Eq. 11. We chose to examine model predictions for the effects of 23-nm particles on hydraulic conductivity since this is the size of individual LDL particles, and the effects of 60-nm particles were examined because electron-dense particles of this size were observed in the micrographs. We also examined the large particle size limit (Eq. 11) because our morphological results suggested that most of the LDL had formed aggregates 400–500 nm in size.
The most surprising feature of Fig. 6 is that the data showed a much larger effect of the lipid particles on K than predicted by the theory, regardless of particle size used in the theory. This large effect was seen across the entire range of pressures investigated.
DISCUSSION
The hydraulic conductivity of connective tissues is important to the normal function of a variety of organs and tissues including cartilage (25), the kidneys (7), the aqueous humor outflow pathways in the eye (18), and the interstitium (21). Although the hydraulic conductivity of these tissues is primarily determined by the ultrastructure of the small fibrils making up these connective tissues, larger structures such as cells, collagen fibrils, and elastin fibers can also influence hydraulic conductivity. In aging and disease, accumulation of lipids in a tissue can decrease the hydraulic conductivity of a tissue. Such lipid accumulation has been hypothesized to limit transport to and from the retina, thus contributing importantly to age-related macular degeneration (1, 11, 34).
Bruch's membrane is a connective tissue in the eye through which nutrients must pass to reach the retinal pigment epithelium, the layer of cells underlying the retina that support photoreceptor function. Bruch's membrane accumulates lipoprotein-like particles with age (17). The hydraulic conductivity of Bruch's membrane decreases significantly with age, a phenomenon hypothesized to have pathological implications (34). The role of lipid accumulation in this decreased hydraulic conductivity has not yet been established.
Accumulation of particles in a porous medium can decrease the hydraulic conductivity of this medium in three ways. First, they reduce the available area for flow, thereby increasing the interstitial velocity and thus decreasing the effective hydraulic conductivity of the medium. Second, because of the mean pressure gradient in the porous medium, there will be a net drag force on a particle due to the flow through the porous medium. Neither of these two effects depends on the radius of the particle. Their combined effects on hydraulic conductivity are described by Eq. 11. Finally, when particles are particularly small (when ra/ is of order one or smaller), then shear forces on the particle further reduce the hydraulic conductivity of the medium as described by Eq. 12.
By combining Matrigel, as a model of a connective tissue, with either 30-nm or 90-nm nanospheres and measuring the specific hydraulic conductivity, we were able to validate Eqs. 11 and 12. Only at low perfusion pressures did the model fail to give good agreement with theory. In our previous study, we found considerable variability in our results at low perfusion pressures (24).
Further experimental validation of these equations could be conducted using a larger range of volume fractions of solid particles. However, lower volume fractions would be expected to have a smaller effect than the 4.8% solutions used in this study, and even at 4.8% volume fraction only a modest effect was seen. Larger fractions would be ideal to investigate, but we did not find commercially available weight fractions >10% (that yields a 4.8% volume fraction when mixed with Matrigel), likely due to nanosphere aggregation at higher weight fractions.
In a similar vein, the effects of the radius of particles could be investigated over a larger range of radii. Figure 3 shows that there is a negligible additional effect on K as the particle size is increased past 100 nm for φ = 0.05, a prediction that our nanosphere results are consistent with (Fig. 5). Particles smaller than 30 nm would be predicted to have an increased effect, but as the size of the particle decreases with respect to the interfiber spacing of the matrix, the particles will become too small to be retained in the matrix,1 a situation our theory is not developed for.
Given the generally good agreement between the theory and experimental nanosphere data, the larger-than-expected effect of lipids on the specific hydraulic conductivity was surprising. To have the theory predict as much of a decrease as seen in the experimental data for the lipids, either the particle size would have to be much smaller than expected or the volume fraction would have to be much larger than expected. On the basis of Eq. 12, a large fraction of the particles would have to be less than 8 nm in diameter to account for the measured flow resistance. This size is much too small to be the native LDL particles, which are typically 23 nm in diameter.
The possibility that LDL particles could be broken down to form smaller particles is unlikely due to the self-aggregation tendencies of LDL. Khoo et al. (20) describe the self-aggregation of LDL subjected to brief vortexing, which results in the formation of particle clumps up to 400 nm in diameter. This observation indicates that LDL particles should be aggregated and larger after their rehydration, because of the mixing involved, rather than smaller than their initial diameter. Further evidence of aggregation in our experiments was obtained through electron micrographs of the Matrigel with lipids added.
The micrographs of Matrigel with LDL (Fig. 7, B–D) show two main features: small electron-dense particulate matter that is ∼60 nm in diameter, and larger, irregularly shaped areas of electron translucence, up to 500 nm in diameter. We interpret the translucent spaces as being originally composed of cholesteryl esters that constituted the bulk of the interior of native LDL particles, with some of this material being lost in processing for electron microscopy. The OTAP methodology is designed to minimize this loss but is only partially successful (19). The electron-dense particulate matter is interpreted as arising preferentially from the outer shell of native LDL particles, consistent with reports by other investigators using the OTAP methodology (4, 5, 14, 16, 19). Further evidence supporting this interpretation is that the area fraction of the translucent areas (and including the small volume of particulate matter) in the micrographs was 5.1% of the total area, close to the volume fraction of lipids initially put into the gel.
To match our theory to the experimental data for Matrigel with LDL, the volume fraction of lipids would have to be ∼15%. We can suggest no mechanism by which the lipids might affect such a large volume fraction of the gel. However, our results do suggest that lipids are very efficient at blocking flow through a connective tissue. This could have significant implications to the understanding of the pathophysiology of aging and age-related macular degeneration.
A different application of our theoretical model relates to the forces generated on a cell in an interstitial flow. These forces include both the shear forces and pressure forces. Investigations into these forces have focused on the effects of shear stress (10, 31, 35) such as on smooth muscle cells (36, 38). As indicated in our discussion following Eq. 10, the shear forces and pressure forces can be separately identified in this equation. Using physiological values for the radius of a smooth muscle cell and the specific hydraulic conductivity of the arterial wall, such as those used by Tada and Tarbell (36), r0 = 1 × 10⁻⁴ cm and K = 1.5 × 10⁻¹⁴ cm2, one can compute the relative importance of the pressure and shear stress terms in the this equation. Using these values, the contribution to the force on the cell from the pressure term is nearly 300 times larger than the contribution from the shear stress. This suggests that pressure forces should be considered when examining the effects of interstitial flow on interstitial cells, a conclusion recently reached by another group (30).
In conclusion, our results have demonstrated that Brinkman's equation well describes the effects of particulates on the hydraulic conductivity of fibrous porous media such as are found in the extracellular matrix. This model could be used to determine the influence of larger particulates (e.g., collagen, elastin, cells) on the hydraulic conductivity of the fine filamentous matrix (the proteoglycans) in connective tissues. Our results also show that lipids have a larger effect on hydraulic conductivity than solid latex beads, although the mechanism by which this additional hydraulic resistance is generated is not yet understood. This effect may be magnifying pathologies associated with lipid accumulation in extracellular matrixes. These findings may shed new light into the physiology of aging and the pathophysiology of age-related macular degeneration and atherosclerosis.
GRANTS
This study is supported by grants from National Eye Institute EY-014662 and The American Health Assistance Foundation.
The costs of publication of this article were defrayed in part by the payment of page charges. The article must therefore be hereby marked “advertisement” in accordance with 18 U.S.C. Section 1734 solely to indicate this fact.
Footnotes
REFERENCES
- 1.Bird AC, Marshall J. Retinal pigment epithelial detachments in the elderly. Trans Ophthalmol Soc UK 105: 674–682, 1986. [PubMed] [Google Scholar]
- 2.Brinkman HC On the permeability of media consisting of closely packed porous particles. Appl Sci Res A1: 81–86, 1948. [Google Scholar]
- 3.Chang MY, Potter-Perigo S, Wight TN, Chait A. Oxidized LDL bind to nonproteoglycan components of smooth muscle extracellular matrices. J Lipid Res 42: 824–833, 2001. [PubMed] [Google Scholar]
- 4.Curcio CA, Millican CL, Bailey T, Kruth HS. Accumulation of cholesterol with age in human Bruch's membrane. Invest Ophthalmol Vis Sci 42: 265–274, 2001. [PubMed] [Google Scholar]
- 5.Curcio CA, Presley JB, Millican CL, Medeiros NE. Basal deposits and drusen in eyes with age-related maculopathy: evidence for solid lipid particles. Exp Eye Res 80: 761–775, 2005. [DOI] [PubMed] [Google Scholar]
- 6.Debye P, Buche AM. Intrinsic viscosity, diffusion, and sedimentation rate of polymers in solution. J Chem Phys 16: 573–579, 1948. [Google Scholar]
- 7.Deen WM, Lazzara MJ, Myers BD. Structural determinants of glomerular permeability. Am J Physiol Renal Physiol 281: F579–F596, 2001. [DOI] [PubMed] [Google Scholar]
- 8.Ethier CR The hydrodynamic resistance of hyaluronic acid: estimates from sedimentation studies. Biorheology 23: 99–113, 1986. [DOI] [PubMed] [Google Scholar]
- 9.Feng J, Ganatos P, Weinbaum S. Motion of a sphere near planar confining boundaries in a Brinkman medium. J Fluid Mech 375: 265–296, 1998. [Google Scholar]
- 10.Ferko MC, Bhatnagar A, Garcia MB, Butler PJ. Finite-element stress analysis of a multicomponent model of sheared and focally-adhered endothelial cells. [erratum appears in Ann Biomed Eng 35: 858–859, 2007]. Ann Biomed Eng 35: 208–223, 2007. [DOI] [PMC free article] [PubMed] [Google Scholar]
- 11.Grindle CFJ, Marshall J. Ageing changes in Bruch's membrane and their functional implications. Trans Ophthalmol Soc UK 98: 172–175, 1978. [PubMed] [Google Scholar]
- 12.Guyton JR, Bocan TMA, Schifani TA. Quantitative ultrastructural analysis of perifibrous lipid and its association with elastin in nonatherosclerotic human aorta. Arteriosclerosis 5: 644–652, 1985. [DOI] [PubMed] [Google Scholar]
- 13.Guyton JR, Klemp KF. Development of the atherosclerotic core region. Chemical and ultrastructural analysis of microdissected atherosclerotic lesions from human aorta. Arterioscler Thromb 14: 1305–1314, 1994. [DOI] [PubMed] [Google Scholar]
- 14.Guyton JR, Klemp KF. Ultrastructural discrimination of lipid droplets and vesicles in atherosclerosis: value of osmium-thiocarbohydrazide-osmium and tannic acid-paraphenylenediamine techniques. J Histochem Cytochem 36: 1319–1328, 1988. [DOI] [PubMed] [Google Scholar]
- 15.Happel J, Brenner H. Low Reynolds Number Hydrodynamics. The Hague, the Netherlands: Nijhoff, 1983, p. 153.
- 16.Huang JD, Presley JB, Chimento MF, Curcio CA, Johnson M. Age-related changes in human macular Bruch's membrane as seen by quick-freeze/deep-etch. Exp Eye Res 85: 202–218, 2007. [DOI] [PMC free article] [PubMed] [Google Scholar]
- 17.Huang J-D, Presley JB, Chimento MF, Curcio CA, Johnson M. Morphometric analysis of lipoprotein-like particle accumulation in aging macular Bruch's membrane. Invest Ophthalmol Vis Sci 49: 2721–2727, 2008. [DOI] [PMC free article] [PubMed] [Google Scholar]
- 18.Johnson M, Erickson K. Mechanisms and routes of aqueous humor drainage. In: Principles and Practice of Ophthalmology, edited by Albert DM and Jakobiec FA. Philadelphia, PA: Saunders, 2000, p. 2577–2595.
- 19.Johnson M, Huang JD, Presley JB, Chimento MF, Curcio CA. Comparison of morphology of human macular and peripheral Bruch's membrane in older eyes. Curr Eye Res 32: 791–799, 2007. [DOI] [PMC free article] [PubMed] [Google Scholar]
- 20.Khoo JC, Miller E, McLoughlin P, Steinberg D. Enhanced macrophage uptake of low density lipoproteins after self-aggregation. Arteriosclerosis 8: 348–358, 1988. [DOI] [PubMed] [Google Scholar]
- 21.Levick JR Flow through interstitium and other fibrous matrices. Q J Exp Physiol 72: 409–437, 1987. [DOI] [PubMed] [Google Scholar]
- 22.Marshall J, Hussain AA, Starita C, Moore DJ, Patmore AL. Aging and Bruch's membrane. In: The Retinal Pigment Epithelium: Function and Disease, edited by Marmor MF and Wolfensberger TJ. New York: Oxford Univ. Press, 1998, p. 669–692.
- 23.McCarty WJ A Matrigel Model of the Hydraulic Conductivity of Bruch's Membrane in Age-Related Maculopathy (M.S. thesis). Evanston, IL: Northwestern Univ., 2006.
- 24.McCarty WJ, Johnson M. The hydraulic conductivity of Matrigel. Biorheology 44: 303–317, 2007. [PMC free article] [PubMed] [Google Scholar]
- 25.Mow VC, Holmes MH, Lai WM. Fluid transport and mechanical properties of articular cartilage: a review. J Biomech 17: 377–394, 1984. [DOI] [PubMed] [Google Scholar]
- 26.Ogston AG The spaces in a uniform random suspension of fibers. Trans Faraday Soc 54: 1754–1757, 1958. [Google Scholar]
- 27.Overby D, Johnson M. Studies of depth-of-field effects in microscopy supported by numerical simulations. J Microsc 220: 176–189, 2005. [DOI] [PubMed] [Google Scholar]
- 28.Overby D, Ruberti J, Gong H, Freddo T, Johnson M. Specific hydraulic conductivity of corneal stroma as seen by quick-freeze/deep-etch. J Biomech Eng 123: 154–161, 2001. [DOI] [PubMed] [Google Scholar]
- 29.Pauleikhoff D, Harper CA, Marshall J, Bird AC. Aging changes in Bruch's membrane: a histochemical and morphological study. Ophthalmology 97: 171–178, 1990. [PubMed] [Google Scholar]
- 30.Pedersen J The Role of Extracellular Matrix Fibers in Modifying Pericellular Flow Fields in Interstitial Flow (Ph.D. thesis). Evanston, IL: Northwestern Univ, 2007.
- 31.Pedersen JA, Boschetti F, Swartz MA. Effects of extracellular fiber architecture on cell membrane shear stress in a 3D fibrous matrix. J Biomech 40: 1484–1492, 2007. [DOI] [PubMed] [Google Scholar]
- 32.Sheraidah G, Steinmetz R, Maguire J, Pauleikhoff D, Marshall J, Bird AC. Correlation between lipids extracted from Bruch's membrane and age. Ophthalmology 100: 47–51, 1993. [DOI] [PubMed] [Google Scholar]
- 33.Smith E The relationship between plasma and tissue lipids in human atherosclerosis. Adv Lipid Res 12: 1–49, 1974. [DOI] [PubMed] [Google Scholar]
- 34.Starita C, Hussain A, Pagliarini S, Marshall J. Hydrodynamics of ageing Bruch's membrane: implications for macular disease. Exp Eye Res 62: 565–572, 1996. [DOI] [PubMed] [Google Scholar]
- 35.Swartz MA, Fleury ME. Interstitial flow and its effects in soft tissues. Annu Rev Biomed Eng 9: 229–256, 2007. [DOI] [PubMed] [Google Scholar]
- 36.Tada S, Tarbell JM. Interstitial flow through the internal elastic lamina affects shear stress on arterial smooth muscle cells. Am J Physiol Heart Circ Physiol 278: H1589–H1597, 2000. [DOI] [PubMed] [Google Scholar]
- 37.Tsukamoto H, Takei I, Ishii K, Watanabe K. Simplified method for the diameter sizing of serum low-density lipoprotein using polyacrylamide gradient gel electrophoresis. Clin Chem Lab Med 42: 1009–1012, 2004. [DOI] [PubMed] [Google Scholar]
- 38.Wang DM, Tarbell JM. Modeling interstitial flow in an artery wall allows estimation of wall shear stress on smooth muscle cells. J Biomech Eng 117: 358–363, 1995. [DOI] [PubMed] [Google Scholar]
- 39.Weinbaum S, Zhang X, Han Y, Vink H, Cowin SC. Mechanotransduction and flow across the endothelial glycocalyx. Proc Natl Acad Sci USA 100: 7988–7995, 2003. [DOI] [PMC free article] [PubMed] [Google Scholar]
- 40.Zhang XY, Luck J, Dewhirst MW, Yuan F. Interstitial hydraulic conductivity in a fibrosarcoma. Am J Physiol Heart Circ Physiol 279: H2726–H2734, 2000. [DOI] [PubMed] [Google Scholar]


