Abstract
The ankle plantar flexor muscles, gastrocnemius (Gas) and soleus (Sol), have been shown to play important roles in providing body support and forward propulsion during human walking. However, there has been disagreement about the relative contributions of Gas and Sol to these functional tasks. In this study, using independent manipulations of body weight and body mass, we examined the relative contribution of the individual plantar flexors to support and propulsion. We hypothesized that Gas and Sol contribute to body support, whereas Sol is the primary contributor to forward trunk propulsion. We tested this hypothesis by measuring muscle activity while experimentally manipulating body weight and mass by 1) decreasing body weight using a weight support system, 2) increasing body mass alone using a combination of equal added trunk load and weight support, and 3) increasing trunk loads (increasing body weight and mass). The rationale for this study was that muscles that provide body support would be sensitive to changes in body weight, whereas muscles that provide forward propulsion would be sensitive to changes in body mass. Gas activity increased with added loads and decreased with weight support but showed only a small increase relative to control trials when mass alone was increased. Sol activity showed a similar increase with added loads and with added mass alone and decreased in early stance with weight support. Therefore, we accepted the hypothesis that Sol and Gas contribute to body support, whereas Sol is the primary contributor to forward trunk propulsion.
Keywords: biomechanics, locomotion, electromyogram, muscle function
during walking, leg muscles generate force to perform a number of subtasks, such as supporting body weight, moving the body forward, and swinging the legs. Understanding how individual muscles contribute to these specific tasks can provide important insights into neuromuscular control and walking mechanics. This understanding can also aid in developing improved prosthetic, orthotic, and other assistive devices to mitigate neuromuscular impairments and designing more effective rehabilitation strategies. However, understanding how individual muscles contribute to specific tasks is challenging because of complex musculoskeletal system dynamics.
Studies have shown during walking that the net ankle joint moment produced by the ankle plantar flexors during stance acts to support the body as well as propel the body forward in late stance (13, 15, 25, 31). In addition to providing forward propulsion, other functions of the plantar flexors during late stance, including control of forward momentum (28) and acceleration of the leg into swing (13, 19), have been proposed. These functions are not necessarily mutually exclusive, and studies have shown that each of the plantar flexor muscles can contribute independently to forward propulsion and acceleration of the leg into swing (14, 22). Although there is agreement that the plantar flexors may have different functions during walking, there is not always consensus on which function each muscle performs (10, 13, 14, 22, 27).
A number of experimental perturbation (e.g., load carrying, weight support and other externally applied forces, and functional electrical stimulation) and computer modeling and simulation studies have been used to explore the individual roles of the plantar flexors. In general, the results of these studies agree that the gastrocnemius (Gas) and soleus (Sol) make substantial contributions to body support (1, 7, 16, 18, 22, 27). However, the relative contribution of Gas and Sol to forward propulsion is not well understood. Recent perturbation studies in which a constant aiding horizontal force (AHF) was applied to the waist during walking examined the relative changes in muscle activity, measured using electromyography (EMG), and concluded that Gas, but not Sol, is a major contributor to forward propulsion (9, 10). In contrast, predictions from computer modeling and simulation studies suggest that Gas and Sol act to accelerate the center of mass forward in late stance (14, 18, 22, 23), where Sol accelerates the trunk while Gas accelerates the leg into swing (14, 22).
The discrepancy between the experimental perturbation and computer simulation studies may be related to the experimental design of the perturbations, which applied a constant horizontal force to the pelvis over the entire gait cycle (20). During normal walking, the propulsive ground reaction force (GRF) occurs in the second half of stance. The application of an external propulsive force when one is not expected (i.e., during the braking phase) may challenge postural balance in the sagittal plane. Thus Sol may not have been able to decrease its activity because it is required to maintain postural balance in response to the applied forward horizontal force.
In the present study, we employed an experimental design that manipulates the external demands placed on the body during walking in a novel way. By using combinations of increased trunk loads and weight support, we were able to experimentally manipulate each subject's body weight and/or body mass. Trunk loading alone increased the weight that had to be supported and the mass that had to be accelerated forward. An equal combination of added trunk load and weight support increased the mass each subject had to accelerate forward, but not the weight supported. Finally, weight support alone reduced the weight that had to be supported but did not change the body mass that had to be accelerated forward.
On the basis of the predictions from computer modeling and simulation studies, we tested the hypotheses that Gas and Sol contribute to body support and that Sol is the primary contributor to forward trunk propulsion. Because our hypotheses are based on predictions from computer simulations, this study also serves as an experimental validation of those simulation results. The rationale for our hypotheses was that, given similar kinematics, EMG from muscles that play a major role in body support would be sensitive to changes in body weight, but not body mass. Alternatively, EMG from muscles that play a major role in providing forward propulsion would be sensitive to increases in body mass. This rationale assumes that if the kinematics are similar, the muscles of interest are operating at similar lengths and shortening velocities, and thus muscle activity can be used as a reasonable proxy for interpreting mechanical output. Following this rationale, we used EMG and inverse dynamics analyses to examine the relative contributions of Gas and Sol to body support and forward propulsion during normal steady-state walking.
METHODS
Ten healthy adults [5 men and 5 women, 21–45 yr old, 67.1 ± 8.5 kg (SD) average body mass] participated in the study. All subjects volunteered for the study and gave informed consent. The experimental protocol was approved by the University of Colorado Human Research Committee.
Experimental protocol.
The experimental equipment and protocol used in the present study were similar to those used in previous studies analyzing the effects of weight and mass during walking and running (4, 9, 29). Subjects walked at a constant speed (1.3 ms−1) on a dual-belt force treadmill while surface EMG and sagittal plane kinematics were recorded. In addition to walking normally while wearing the harness without weight support (control), subjects walked with loads that increased body weight and mass by 25% and 50% (+25W&M and +50W&M), with 25% and 50% weight support (−25W and −50W) and with combinations of loads and equal weight support that increased body mass alone by 25% and 50% (+25M and +50M). The experimental protocol was implemented in a specific order to minimize the adjustments to the experimental apparatus. A total of seven trials were conducted in the following order: control, +25W&M, +25M, +50W&M, +50M, −25W, and −50W. To ensure that subjects had reached steady-state walking patterns, all trials lasted for ≥3 min and data were collected in the final 30 s of the trial. Previous studies showed that subjects acclimatize to normal treadmill walking almost immediately and within 1 min on a treadmill with weight support (6).
Loading and weight support.
Increases in body weight and mass were accomplished by addition of symmetrical loads to the trunk. The loads consisted of thin lead strips that were secured around a padded waist belt worn tightly at the subject's hips near the body's center of mass. Positioning the load at the hips minimized its movement relative to the center of mass and did not interfere with normal walking movements such as arm swing. Symmetrical loads were used to minimize increased demands for balance that may be caused by asymmetrical loading (2).
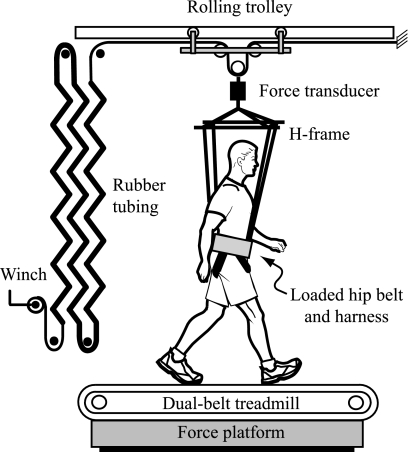
Decreases in body weight were accomplished by application of a nearly constant upward force to the body's center of mass. The experimental apparatus used to provide weight support has been described elsewhere in detail (11). Briefly, subjects wore a padded hip and leg harness that was supported equally at four points by an H-shaped lightweight frame connected to a rolling trolley (Fig. 1). The trolley had a small mass and rolled in the fore-aft direction with low-friction bearings, so that the force applied to the harness was only in the vertical direction. A nearly constant upward force was applied to the frame by a long, low-stiffness rubber tubing spring. The magnitude of the support force was measured with a force transducer mounted in series between the spring and the frame.
Fig. 1.
Experimental apparatus. Experimental conditions included walking with the harness only, added loads, weight support, and equal combinations of added load and weight support. Level of weight support was monitored with a force transducer and controlled by adjustment of the length of the spring using the winch. Trunk loads were added with lead strips secured to a weight harness.
Increases in mass alone were accomplished by application of an equal combination of increased trunk loading and weight support. Trunk loading and weight support protocols were as described above, with the weight belt being worn over the weight support harness.
Kinematics and kinetics.
Sagittal plane high-speed video (JC Labs; 200 Hz) and GRFs were recorded from the right leg as subjects walked on the instrumented treadmill. The treadmill was a dual-belt design (modified from Ref. 17), custom built to measure three-dimensional GRFs from a single leg during walking. The vertical and horizontal GRF components were sampled at 2,000 Hz and low pass filtered with a zero-lag, fourth-order digital Butterworth filter (25-Hz cutoff frequency). Mean GRFs and impulses were calculated from 15 consecutive strides and used to examine differences among experimental conditions. Joint centers of rotation for the right leg were palpated, and lightweight reflective markers were placed over the following bony landmarks: fifth metatarsal-phalangeal joint, lateral malleolus, a point midway between the lateral epicondyle of the femur and the head of the fibula, and the greater trochanter. Joint marker positions were digitized (Peak Motus, version 5.0) and filtered with a fourth-order Butterworth digital filter with a 6-Hz cutoff frequency (30). Hip, knee, and ankle joint angles were calculated for five consecutive strides from each condition. Subject means for the five strides were used to create group means for all experimental conditions. To determine differences in joint kinematics, we compared the relative timing and magnitude of peak joint flexion and extension angles and peak angular velocities. Step time, stride time, and duty factor were calculated from the vertical GRF.
To determine whether the ankle muscle forces were changing as expected on the basis of the EMG measurements (see below), we calculated ankle joint moments for a subset of the subjects (n = 7) using standard inverse dynamics techniques (30). The inverse dynamics analysis could not be conducted on three of the subjects because of problems with synchronization between the kinematics and force treadmill data. Ankle joint moments were normalized to body weight and integrated with respect to time in 10% increments of the gait cycle to determine the moment impulse during periods of the stance phase.
EMG measurements.
Surface EMG was used to quantify the effects of changes in body weight and/or body mass on Gas and Sol activity. We placed bipolar, Ag-AgCl surface electrodes (1 cm diameter; Blue Sensor, Ambu, DK) over the medial Gas and Sol of the right leg, with an interelectrode distance of 2 cm. Gas electrodes were placed at approximately the center of the muscle belly, and Sol electrodes were placed on the distal third of the muscle, distal to Gas and lateral to the Achilles tendon (5, 24). Before electrode placement, the skin was shaved and prepared with alcohol and an abrasive conductive paste (Nuprep, Weaver, Aurora, CO). EMG signals were collected at 2 kHz via a telemetered amplifier system (Noraxon, Scottsdale, AZ) with a gain of 1,700 and built-in band-pass filter (16–500 Hz).
All EMG processing was implemented in Matlab 7.0 (MathWorks, Natick, MA). The raw EMG data were band-pass filtered from 10 to 500 Hz using a zero-lag, second-order digital Butterworth filter and rectified. For each subject, we selected 15 consecutive strides from each experimental condition and used them to calculate mean EMG waveforms for each muscle. We normalized the EMG data by dividing by the mean EMG amplitude of each subject's control trial, calculated over the entire stride. We used normalized EMG data to calculate group means for each experimental condition and integrated the group means with respect to time as a measure of muscle activity. For assessment of contributions to body support, EMGs were integrated over the support phase of the gait cycle. For assessment of contributions to forward propulsion, EMGs were integrated over the propulsive phase of the gait cycle (i.e., when the anterior/posterior GRF was positive).
Statistics.
Statistical differences in the force, kinematic, and EMG variables of interest due to the experimental conditions were determined using a repeated-measures AVOVA in Systat 12 (SYSTAT Software, San Jose, CA). When a significant effect was identified, a post hoc Tukey's pairwise comparison was performed to determine which conditions were significantly different. Statistical significance was defined as P < 0.05. Values are means ± SE, unless otherwise noted.
RESULTS
Our results showed that Gas activity was sensitive to changes in body weight and relatively insensitive to changes in body mass, whereas Sol activity was sensitive to changes in body weight and body mass. Therefore, we accept our hypotheses that Gas and Sol contribute to body support and that Sol is the primary contributor to forward trunk propulsion.
Kinematics.
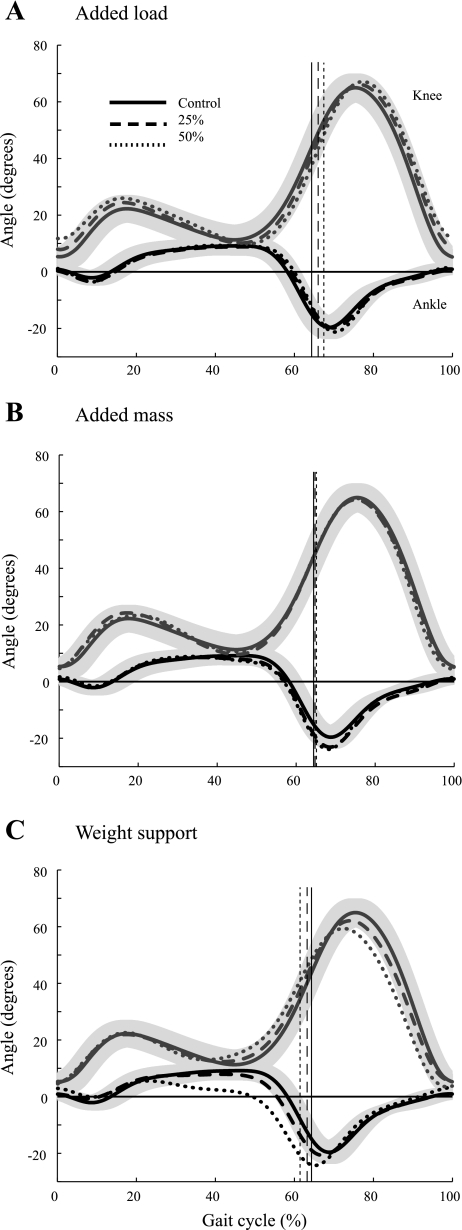
In general, differences in kinematics between the experimental and control conditions were small. Although statistically significant differences were found for several of the variables (Table 1; P < 0.05 by ANOVA), these differences did not exceed 6% relative to the control condition. Added mass resulted in increases in all timing variables, whereas added load produced an increase in the support phase of gait. Weight support produced an increase in stride times. Changes in duty factor were also <6%, but duty factors were significantly greater with added load and significantly lower with the highest weight support (−50W). The propulsive phase began earlier in the gait cycle with weight support and later in the gait cycle with added load. Ankle and knee angles were also similar between experimental and control conditions (Fig. 2). During the stance phase, only the ankle angle during the −50W trial differed from that during the control condition, specifically in the timing and magnitude of peak ankle dorsiflexion (P < 0.001).
Table 1.
Stride timing
| Stride, s | Support, s | Braking, s | Propulsion, s | Propulsive Phase, % of stride |
||
|---|---|---|---|---|---|---|
| Start | End | |||||
| Control | 1.04±0.05 | 0.67±0.04 | 0.36±0.03 | 0.31±0.02 | 34.7±0.02 | 64.3±0.02 |
| Added weight | ||||||
| 25% | 1.03±0.04 | 0.68±0.04 | 0.37±0.03 | 0.31±0.02 | 35.5±0.02 | 65.9±0.02† |
| 50% | 1.03±0.05 | 0.69±0.04† | 0.37±0.02 | 0.32±0.02 | 36.0±0.01 | 67.5±0.02*† |
| Added mass | ||||||
| 25% | 1.07±0.05† | 0.69±0.04† | 0.38±0.03 | 0.32±0.01 | 35.0±0.02 | 64.8±0.02 |
| 50% | 1.09±0.04† | 0.71±0.04† | 0.38±0.02† | 0.32±0.02 | 35.4±0.02 | 65.1±0.01 |
| Weight support | ||||||
| 25% | 1.07±0.05† | 0.67±0.04 | 0.36±0.03 | 0.31±0.02 | 33.7±0.01 | 63.2±0.02 |
| 50% | 1.10±0.05† | 0.67±0.04 | 0.35±0.03 | 0.32±0.03 | 31.8±0.02† | 61.4±0.01*† |
Values are means ± SE.
Significantly different from 25% (P < 0.05).
Significantly different from control (P < 0.05).
Fig. 2.
Knee (gray lines) and ankle (black lines) joint angles. Positive values for knee angle are joint flexion. Positive values for ankle angle are dorsiflexion, and negative values are plantar-flexion. Shaded regions represent ±1 SD for control data. Heel strike corresponds to 0% of the gait cycle, and thin vertical lines indicate the end of the support phase.
GRFs and joint moments.
The vertical and horizontal GRFs were consistent with the expectations of the experimental design, and there was a significant effect for all variables (P < 0.001 by ANOVA). Added load produced significant increases in all variables (Table 2), whereas weight support produced significant decreases in all variables. Added mass alone resulted in no change in mean vertical force but produced significant increases in peak vertical force, peak propulsive force, and propulsive impulse for +25M and +50M trials. The +50M trial also resulted in small, but significant, increases in vertical impulse and peak braking force.
Table 2.
Ground reaction forces
| Peak Vertical Force, N | Vertical Impulse, N·s | Mean Vertical Force/Stride, N | Peak Braking Force, N | Peak Propulsive Force, N | Propulsive Impulse, N·s | |
|---|---|---|---|---|---|---|
| Control | 729.4±30.6 | 339.5±16.8 | 653.4±27.0 | 111.3±6.1 | 125.9±6.4 | 17.9±1.4 |
| Added weight | ||||||
| 25% | 892.6±32.4† | 423.6±19.5† | 819.3±33.5† | 140.4±6.8 | 158.8±5.8† | 23.4±1.3† |
| 50% | 1,037.5±41.1*† | 504.0±23.4*† | 978.1±39.5*† | 162.8±8.4*† | 184.6±6.3*† | 28.0±1.4*† |
| Added mass | ||||||
| 25% | 813.6±32.1† | 358.1±17.0 | 666.3±24.9 | 127.5±8.5 | 143.3±5.9† | 20.6±1.5† |
| 50% | 857.0±35.2*† | 362.2±18.6† | 664.9±28.4 | 124.1±8.7† | 149.1±6.8† | 21.4±1.6† |
| Weight support | ||||||
| 25% | 618.7±28.0† | 266.5±13.3† | 497.9±20.4† | 92.1±5.3† | 106.9±4.0† | 15.3±1.0† |
| 50% | 522.9±23.8*† | 188.8±10.6*† | 343.4±15.9*† | 74.9±4.2*† | 77.2±3.1*† | 11.3±0.7*† |
Values are means ± SE.
Significantly different from 25% (P < 0.05).
Significantly different from control (P < 0.05).
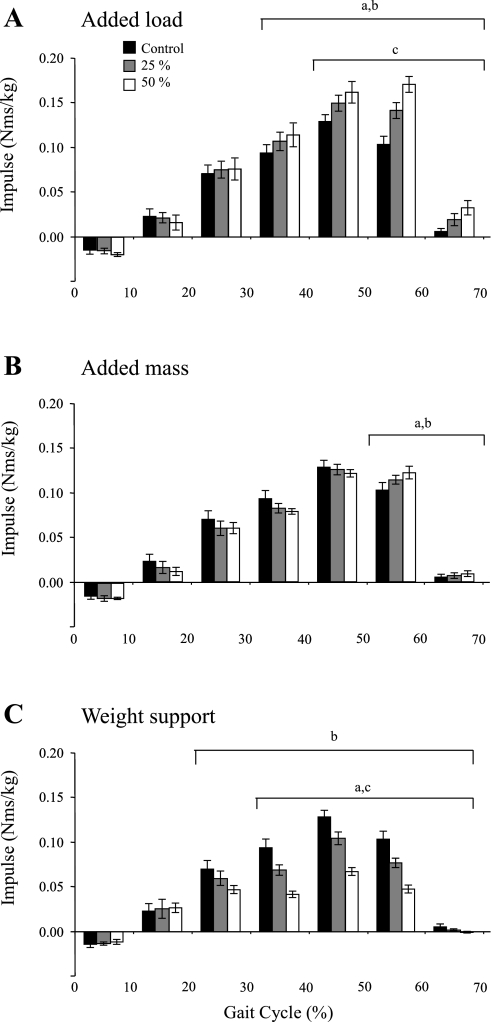
Ankle joint moment impulses were also consistent with the expectations of the experimental design, and there was a significant effect due to the experimental conditions (P < 0.01 by ANOVA). Added load produced significant increases in impulses from 30% to 70% of the gait cycle relative to the control condition, which corresponds to the second half of the support phase (Fig. 3A). There were also significant increases between +25W&M and +50W&M trials for 40–50% of the gait cycle. Added mass alone produced significant increases in impulse from 50% to 70% of the gait cycle relative to the control condition (Fig. 3B). However, there were no differences in impulse between +25M and +50M trials. Weight support reduced ankle moment impulse (Fig. 3C). During −25W trials the impulse was reduced from 30% to 70% of the gait cycle, whereas during −50W trials the impulse was reduced from 20% to 70% of the gait cycle. There were also significant decreases between −25W and −50W trials from 30% to 70% of the gait cycle.
Fig. 3.
Ankle joint moment impulses for control, 25%, and 50% conditions. Impulses were calculated in 10% increments of the gait cycle. Only the support portion of the gait cycle is shown. Error bars, SD. aSignificant difference between 25% and control; bsignificant difference between 50% and control; csignificant difference between 25% and 50% (P < 0.05).
Muscle activity.
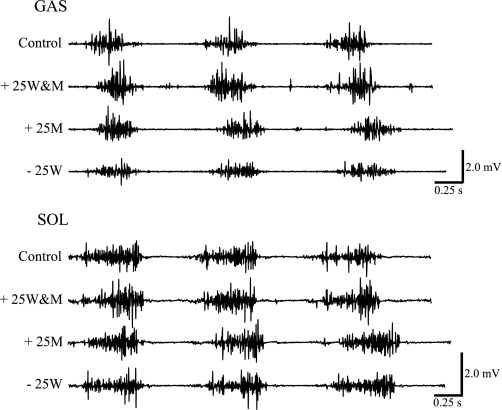
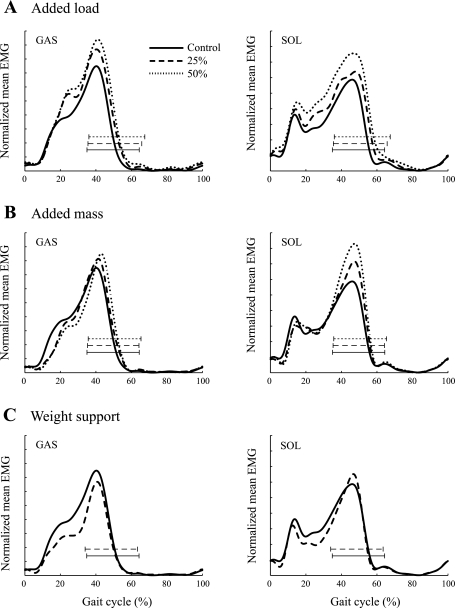
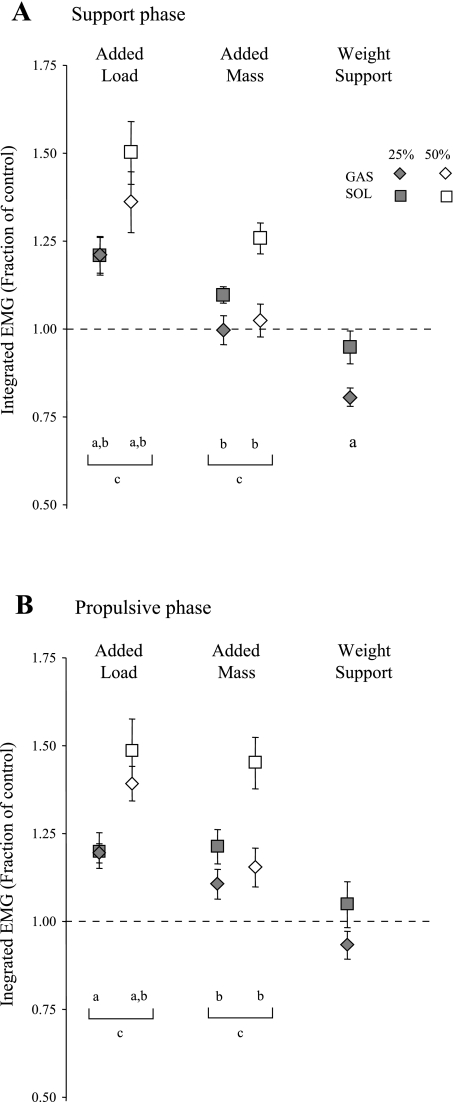
Representative EMG data from a single subject are shown in Fig. 4. The experimental conditions had a significant effect on Gas and Sol activity during stance (P < 0.01 by ANOVA). Added load significantly increased Gas and Sol activity during +25W&M and +50W&M trials (Figs. 5A and 6A) relative to the control condition. There was also a significant increase between the +25W&M and +50W&M trials. Added mass alone did not change Gas activity relative to the control condition. Sol activity, however, increased significantly during +25M and +50M trials, and there was a significant increase between the +25M and +50M trials (Figs. 5B and 6A). In −25W trials, Gas activity decreased significantly relative to the control condition, whereas Sol activity did not change (Figs. 5C and 6A). Because ankle joint kinematics differed significantly between the control condition and the −50W trial (Fig. 2C), this trial was excluded from EMG analysis (see discussion).
Fig. 4.
Representative raw electromyogram (EMG) data from gastrocnemius (Gas) and soleus (Sol) from a single subject during control, 25% added load (+25W&M), 25% added mass (+25M), and 25% weight support (−25W) trials. Gas and Sol traces are from the same trials.
Fig. 5.
Mean rectified and enveloped EMG traces for Gas and Sol. All traces are normalized by the mean EMG amplitude for the control condition calculated over the support phase of the gait cycle. Horizontal brackets indicate propulsive phase of the gait cycle ending at toe off. Heel strike corresponds to 0% of the gait cycle.
Fig. 6.
Mean integrated EMG calculated for support (A) and propulsive (B) phases, plotted as a fraction of control data (dashed line). aSignificant difference between Gas and control; bsignificant difference between Sol and control; csignificant difference between Sol 25% trial and 50% (P < 0.05).
There was also a significant effect of the experimental conditions on muscle activity during the propulsive phase of the gait cycle (P < 0.01 by ANOVA). Added loads resulted in significant increases in Gas and Sol activity (Figs. 5A and 6B). Added mass alone (+25M and +50M trials) produced a small increase in Gas activity, but the increase was significantly greater than the control condition only with the +50M trial (Figs. 5B and 6B). Sol activity increased significantly during +25M and +50M trials, and the relative increase between the +25M and +50M trials was also significant.
DISCUSSION
The relationship between muscle activity and mechanical output, such as force, is highly complex. Nonlinear intrinsic muscle properties (e.g., force-length and force-velocity relationships) influence the amount of force developed by muscles. In the present study, we made the assumption that if kinematics were similar among conditions, then the muscles were likely operating under similar force-length-velocity conditions and, thus, the effects of intrinsic muscle properties were similar. Thus the relative changes in muscle activity can provide a reasonable proxy for mechanical output. Our data showed that joint angle kinematics and stride-timing variables where nearly identical among all experimental conditions. The only exception was during the −50W trial: because the ankle angle differed significantly from the control condition, EMG data for this trial were not analyzed.
Contributions to weight support.
Activity of Gas during stance increased significantly with added load (21% and 35% increases for +25W&M and +50W&M, respectively) and decreased significantly with weight support (20% and 33% decreases for −25W and −50W, respectively). However, added mass did not change Gas activity relative to the control condition (Fig. 6A). We conclude that Gas plays a primary role in providing body support, but not forward propulsion, because it was more sensitive to manipulations of body weight than body mass (Figs. 5 and 6).
The contribution of Sol to body support was somewhat less clear. Sol activity during stance increased significantly with added load (21% and 52% increases for +25W&M and +50W&M, respectively) but did not decrease significantly with weight support (5% decrease for −25W; Fig. 6A). The response of Sol to the added loads is consistent with the functional role of Sol in providing body support and trunk propulsion (1, 14, 22), inasmuch as addition of a load near the whole body center of mass not only increases the weight that must be supported but also the mass that must be accelerated. The lack of Sol response to weight support is most likely related to its role in providing forward propulsion. Although weight support reduces the need for body support, it does not reduce the mass that has to be accelerated forward. Thus it appears that Sol was constrained by the continued need for forward propulsion and could not decrease its activity in response to the decreased need for body support. Modeling studies have shown that Sol contributes to body support during early and late stance and provides trunk propulsion in late stance (14, 22). Analysis of only the first half of stance shows that Sol activity is clearly sensitive to changes in body weight as well as mass (Fig. 5) when Sol provides body support, but not forward propulsion. On the basis of these results, we conclude that Sol also contributes to body support. The conclusion that Sol and Gas provide body support is consistent with previous experimental and simulation studies of human walking (1, 7, 14, 16, 18, 22).
Contributions to forward propulsion.
Sol activity was clearly sensitive to changes in mass (inertia) and showed similar increases in activity with added load (17% and 43% increases for +25W&M and +50W&M, respectively) and added mass alone (21% and 44% increases for +25M and +50M, respectively). Furthermore, Sol activity did not decrease during the propulsive phase of stance with weight support. Conversely, Gas activity was not substantially affected by changes in body mass alone. The increases in Gas activity with added mass were not significantly different from those in the control condition and were significantly less than those with added load (20% at +25W&M vs. 11% at +25M and 40% at +50W&M vs. 23% at +50M, P < 0.05). Thus we conclude that Sol, but not Gas, is the primary contributor to forward trunk propulsion.
Our results for the relative contributions of the individual plantar flexors to forward propulsion are consistent with previous computer modeling and simulation studies (14, 22, 23). Those studies showed that Sol contributes to forward propulsion by accelerating the trunk segment forward, whereas Gas primarily contributes to forward propulsion of the whole body center of mass by accelerating the leg into swing, although Gas does accelerate the trunk segment forward by a small amount in late stance. On the basis of these simulation results, we would predict that Sol activity would increase substantially with added mass, whereas Gas activity would only increase slightly. This is exactly the response we observed in our experiments. The role of Gas in initiating leg swing is further supported by a recent experimental study in which loads were added to the legs during walking (3). Browning et al. (3) showed that foot loads of 4 and 8 kg significantly increased Gas activity, whereas only the heaviest foot load (8 kg) significantly increased Sol activity.
Our results do not concur with the conclusions of previous perturbation experiments: Gottschall and Kram (9, 10) consistently showed that a constantly applied AHF decreased muscle activity in Gas, but not Sol. They concluded that Gas plays an important role in forward propulsion, whereas Sol does not. One possible explanation for this discrepancy is that the experimental apparatus used by Gottschall and Kram may have introduced additional confounding factors. For example, a constant AHF applied at the waist creates an additional moment about the ankle that must be resisted by the plantar flexors to maintain balance. Therefore, Sol activity may have been constrained from decreasing during the AHF experimental condition, because it was required to resist the additional moment. Previous studies showed that an ankle strategy is a common control mechanism used by the nervous system to restore postural balance in the sagittal plane during normal walking (26). Additionally, Gottschall and Kram do not include measures of joint kinematics; therefore, it is not known whether changes in the muscle length or shortening velocity also contributed to the results.
Joint kinetics.
We also examined how net ankle joint moments were influenced by the experimental perturbations. Net joint moments determined from inverse dynamics cannot be used to distinguish between individual muscle contributions, but given similar kinematics, joint moments can provide a relative measure of changes in force for all muscles crossing that joint. Not surprisingly, we found that adding a trunk load increased the ankle joint moment (Fig. 3A), whereas providing weight support decreased the ankle joint moment (Fig. 3C). More interestingly, increases in body mass alone resulted in only small increases in ankle moments and only at the very end of stance when the foot was pushing off (Fig. 3B). In a similar study of independent manipulations of weight and mass, albeit during running, Chang et al. (4) found that subjects maintained the orientation of the GRF vector, despite large changes of weight and/or mass. The authors suggest that this occurs to maintain alignment of the force with the leg, which minimizes joint moments and, thus, muscle forces. The GRFs and joint moments measured in our study of walking support that conclusion. Thus the joint moment data were consistent with the EMG data and support our conclusions.
Experimental validation of simulation studies.
Our hypotheses were based on predictions from forward dynamical simulations; therefore, our results provide an important experimental validation of those simulation results. Forward dynamical simulations provide a theoretical framework for assessing how individual muscles contribute to movements of the body (32). As forward dynamical simulations become more widely used, debate remains as to their validity. Because it is often not feasible to experimentally measure various simulation quantities of interest (hence, the reason for using simulations in the first place), validation of models and simulations is extremely challenging. Only one other study has experimentally tested the predictions from forward dynamical simulations for plantar flexor function during walking: Stewart et al. (27) used functional electrical stimulation to perturb the force produced by Gas or Sol during normal walking, and their results were consistent with the predictions from modeling and simulation analyses (14, 22, 23). The study by Stewart et al. (27) and the present study represent two completely different experimental paradigms, but both support predictions made from forward dynamical simulations. These and other studies (12) provide more validation of predictions derived from modeling and simulation analyses and increase confidence in their use for analyzing various aspects of human movement.
Potential limitations.
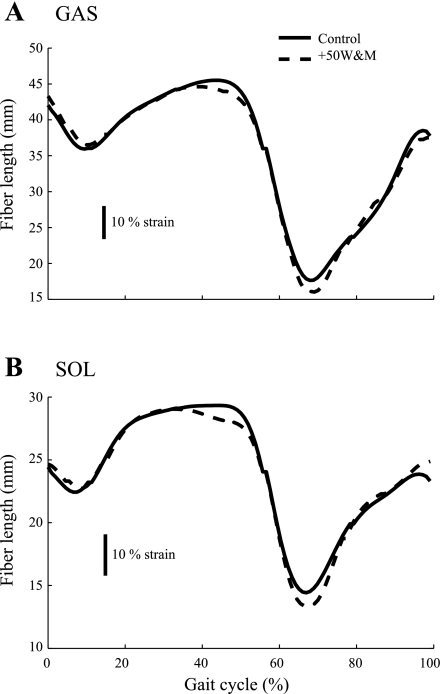
The experimental design of the present study was relatively simple and facilitated a straightforward interpretation of the results. However, a number of potential limitations are worth noting. The conclusions we draw from our EMG results relied on the assumption that Gas and Sol are operating at the same muscle lengths and shortening velocities among conditions. Although there were no significant differences in kinematic patterns (Fig. 2), we performed a post hoc analysis to determine what effect even small differences in joint angles or angular velocities could have on muscle states. We used a previously described detailed musculoskeletal model (21) to estimate muscle fiber lengths and fiber velocities from experimental joint kinematics using SIMM (MusculoGraphics, Evanston, IL). Fiber length and velocity were calculated with the assumption that muscle activation was maximal and, thus, represent the greatest length changes possible. Differences in muscle fiber length during the greatest deviation from the control (+50W&M) did not exceed 5% of muscle fiber resting length (Fig. 7). During the stance phase of normal walking, the muscles are likely operating on or near the plateau region of the force-length curve (8); thus a shift of 5% would only have a small effect on the amount of force the muscle can produce. Differences in muscle fiber shortening velocity were also very small (<5% of maximal shortening velocity) and would not substantially alter the force produced by a muscle for a given level of activation. Thus, on the basis of the results of this post hoc analysis, we concluded that, under our experimental conditions, differences in muscle fiber length and velocity were negligible and use of EMG as a proxy for muscle mechanical output is reasonable.
Fig. 7.
Muscle fiber lengths for Gas and Sol calculated from a detailed musculoskeletal model for control and +50W&M trials. Greatest differences in joint angles compared with control were observed during +50W&M trial.
Another potential limitation was that EMG was only recorded from the medial head of Gas. Although previous studies showed that muscle activity in the medial and lateral heads of Gas is similar during normal walking (28), it is possible that changes in muscle activity in response to the present perturbations could be different between the medial and lateral Gas. However, we expect that any differences would be small, given that the perturbations primarily altered the demands in the sagittal plane, and there were no noticeable changes in out-of-plane movements between conditions.
Finally, we used external perturbations to infer muscle function during normal walking. We assumed that by increasing or decreasing the mechanical demand for a specific task (body support or forward propulsion), EMG activity in the muscles that normally perform these tasks will increase or decrease in response to the perturbation. Although we believe that this is a reasonable assumption, it is possible that change or lack of change in muscle activity during the experimental perturbations was due to additional demands or constraints for which were we were not able to account. Because of the exceedingly complex nature of the neuromuscular and musculoskeletal systems, it was difficult to know precisely how a particular perturbation affects all of the system elements involved. However, our results and interpretations are consistent with predictions from forward dynamical simulations, which do account for many of the complex interactions; thus we have confidence that our simple interpretation of the results is correct. Future studies involving additional modeling and simulation analyses of the experimental perturbation conditions would provide further confirmation that our interpretations are indeed correct.
Conclusions.
The goal of the present study was to determine the relative contributions of the ankle plantar flexors to body support and forward propulsion via independent manipulations of body weight and/or body mass. Our rationale was that muscles that play a prominent role in providing body support would be more sensitive to manipulations of body weight, but not body mass. Conversely, muscles that play a prominent role in providing forward propulsion would be more sensitive to manipulations of body mass, but not body weight. It should be noted that these proposed functions are not necessarily mutually exclusive (e.g., Sol provides body support and trunk propulsion and cannot modulate them independently). Our hypotheses were based on the predictions of previous musculoskeletal modeling and simulation results; thus this study also serves as an experimental validation of those simulation results. On the basis of the changes observed in muscle activity and joint moments, we conclude that Sol and Gas contribute to body support, whereas Sol is the primary contributor to forward trunk propulsion.
GRANTS
This work was supported by National Institute of Arthritis and Musculoskeletal and Skin Diseases National Research Service Award F32-AR-054245-01 to C. P. McGowan.
Acknowledgments
We thank Josh Talbot for tireless efforts during the experimental design refinement and data collection. We also thank the members of the Locomotion Lab at the University of Colorado and the Neuromuscular Biomechanics Lab at the University of Texas at Austin for insightful comments on earlier versions of the manuscript and for stimulating conversations about this work.
The costs of publication of this article were defrayed in part by the payment of page charges. The article must therefore be hereby marked “advertisement” in accordance with 18 U.S.C. Section 1734 solely to indicate this fact.
REFERENCES
- 1.Anderson FC, Pandy MG. Individual muscle contributions to support in normal walking. Gait Posture 17: 159–169, 2003. [DOI] [PubMed] [Google Scholar]
- 2.Bobet J, Norman RW. Effects of load placement on back muscle activity in load carriage. Eur J Appl Physiol Occup Physiol 53: 71–75, 1984. [DOI] [PubMed] [Google Scholar]
- 3.Browning RC, Modica JR, Kram R, Goswami A. The effects of adding mass to the legs on the energetics and biomechanics of walking. Med Sci Sports Exerc 39: 515–525, 2007. [DOI] [PubMed] [Google Scholar]
- 4.Chang YH, Huang HWC, Hamerski CM, Kram R. The independent effects of gravity and inertia on running mechanics. J Exp Biol 203: 229–238, 2000. [DOI] [PubMed] [Google Scholar]
- 5.Cram JR, Kasman GS. Electrode placements. In: Introduction to Surface Electromyography, edited by Cram JR, Kasman GS, Holz J. Gaithersburg, MD: Aspen, 1998, p. 371–375.
- 6.Donelan JM, Kram R. The effect of reduced gravity on the kinematics of human walking: a test of the dynamic similarity hypothesis for locomotion. J Exp Biol 200: 3193–3201, 1997. [DOI] [PubMed] [Google Scholar]
- 7.Ferris DP, Aagaard P, Simonsen EB, Farley CT, Dyhre-Poulsen P. Soleus H-reflex gain in humans walking and running under simulated reduced gravity. J Physiol 530: 167–180, 2001. [DOI] [PMC free article] [PubMed] [Google Scholar]
- 8.Fukunaga T, Kubo K, Kawakami Y, Fukashiro S, Kanehisa H, Maganaris CN. In vivo behaviour of human muscle tendon during walking. Proc R Soc Lond B Biol Sci 268: 229–233, 2001. [DOI] [PMC free article] [PubMed] [Google Scholar]
- 9.Gottschall JS, Kram R. Energy cost and muscular activity required for leg swing during walking. J Appl Physiol 99: 23–30, 2005. [DOI] [PubMed] [Google Scholar]
- 10.Gottschall JS, Kram R. Energy cost and muscular activity required for propulsion during walking. J Appl Physiol 94: 1766–1772, 2003. [DOI] [PubMed] [Google Scholar]
- 11.Griffin T, Tolani N, Kram R. Walking in reduced gravity: mechanical energy fluctuations (Abstract). FASEB J 12: A679, 1998. [Google Scholar]
- 12.Hernandez A, Dhaher Y, Thelen DG. In vivo measurement of dynamic rectus femoris function at postures representative of early swing phase. J Biomech 41: 137–144, 2008. [DOI] [PMC free article] [PubMed] [Google Scholar]
- 13.Hof AL, Geelen BA, Vandenberg J. Calf muscle moment, work and efficiency in level walking: role of series elasticity. J Biomech 16: 523–537, 1983. [DOI] [PubMed] [Google Scholar]
- 14.Hof AL, Otten E. Assessment of two-dimensional induced accelerations from measured kinematic and kinetic data. Gait Posture 22: 182–188, 2005. [DOI] [PubMed] [Google Scholar]
- 15.Kepple TM, Siegel KL, Stanhope SJ. Relative contributions of the lower extremity joint moments to forward progression and support during gait. Gait Posture 6: 1–8, 1997. [Google Scholar]
- 16.Knapik J, Harman E, Reynolds K. Load carriage using packs: a review of physiological, biomechanical and medical aspects. Appl Ergonomics 27: 207–216, 1996. [DOI] [PubMed] [Google Scholar]
- 17.Kram R, Griffin TM, Donelan JM, Chang YH. Force treadmill for measuring vertical and horizontal ground reaction forces. J Appl Physiol 85: 764–769, 1998. [DOI] [PubMed] [Google Scholar]
- 18.Liu MQ, Anderson FC, Pandy MG, Delp SL. Muscles that support the body also modulate forward progression during walking. J Biomech 39: 2623–2630, 2006. [DOI] [PubMed] [Google Scholar]
- 19.Meinders M, Gitter A, Czerniecki JM. The role of ankle plantar flexor muscle work during walking. Scand J Rehabil Med 30: 39–46, 1998. [DOI] [PubMed] [Google Scholar]
- 20.Neptune R Individual plantar flexor contributions to forward propulsion in normal walking. Proc XX Congr Int Soc Biomech, Cleveland, OH, 2005.
- 21.Neptune RR, Burnfield JM, Mulroy SJ. The neuromuscular demands of toe walking: a forward dynamics simulation analysis. J Biomech 40: 1293–1300, 2007. [DOI] [PubMed] [Google Scholar]
- 22.Neptune RR, Kautz SA, Zajac FE. Contributions of the individual ankle plantar flexors to support, forward progression and swing initiation during walking. J Biomech 34: 1387–1398, 2001. [DOI] [PubMed] [Google Scholar]
- 23.Neptune RR, Zajac FE, Kautz SA. Muscle force redistributes segmental power for body progression during walking. Gait Posture 19: 194–205, 2004. [DOI] [PubMed] [Google Scholar]
- 24.Perotto AO Anatomical Guide for the Electromyographer: The Limbs and Trunk. Springfield, IL: Thomas, 1994.
- 25.Perry J Gait Analysis: Normal and Pathological Function. Thorofare, NJ: SLACK, 1992.
- 26.Runge CF, Shupert CL, Horak FB, Zajac FE. Ankle and hip postural strategies defined by joint torques. Gait Posture 10: 161–170, 1999. [DOI] [PubMed] [Google Scholar]
- 27.Stewart C, Postans N, Schwartz MH, Rozumalski A, Roberts A. An exploration of the function of the triceps surae during normal gait using functional electrical stimulation. Gait Posture 26: 482–488, 2007. [DOI] [PubMed] [Google Scholar]
- 28.Sutherland DH, Cooper L, Daniel D. The role of the ankle plantar flexors in normal walking. J Bone Joint Surg Am 62: 354–363, 1980. [PubMed] [Google Scholar]
- 29.Teunissen LPJ, Grabowski A, Kram R. Effects of independently altering body weight and body mass on the metabolic cost of running. J Exp Biol 210: 4418–4427, 2007. [DOI] [PubMed] [Google Scholar]
- 30.Winter D Biomechanics and Motor Control of Human Movement. New York: Wiley, 1990.
- 31.Winter DA Energy generation and absorption at the ankle and knee during fast, natural, and slow cadences. Clin Orthop Related Res 147–154, 1983. [PubMed]
- 32.Zajac FE, Neptune RR, Kautz SA. Biomechanics and muscle coordination of human walking. I. Introduction to concepts, power transfer, dynamics and simulations. Gait Posture 16: 215–232, 2002. [DOI] [PubMed] [Google Scholar]


