Abstract
Caveolin-1 was discovered as a major substrate for v-Src, but the effect of its tyrosine phosphorylation has not been known. We generated a specific antibody (PY14) to caveolin-1 phosphorylated at tyrosine 14 and studied the significance of the modification. By Western blotting of lysates of v-Src–expressing cells, PY14 recognized not only a 22-kDa band (the position of nonphosphorylated caveolin-1) but bands at 23–24 and 25 kDa. Bands of slower mobility were diminished by dephosphorylation and were also observed for mutant caveolin-1 lacking tyrosine 14. By immunofluorescence microscopy, PY14 did not label normal cells but detected large dots in v-Src–expressing cells. Immunoelectron microscopy revealed that the dots corresponded to aggregated caveolae and/or vesicles of various sizes; besides, the label was observed in intramembrane particle-free areas in the plasma membrane, which appeared to have been formed by fusion of flattened caveolae. A positive reaction with PY14 was found in normal cells after vanadate or pervanadate treatment; it occurred mainly at 22 kDa by Western blotting and was not seen as large dots by immunofluorescence microscopy. Detergent solubility, oligomerization, and association with caveolin-2 were observed similarly for caveolin-1 in normal and v-Src–expressing cells. The results indicate that phosphorylation of caveolin-1 in v-Src–expressing cells occurs at multiple residues and induces flattening, aggregation, and fusion of caveolae and/or caveolae-derived vesicles.
INTRODUCTION
Caveolae are cell surface indentations found in many cell types. Caveolae have been reported to contain various receptors, intracellular signaling molecules, and proteins related to Ca2+ transport (for reviews, see Anderson, 1993; Lisanti et al., 1994; Fujimoto et al., 1998). They are also thought to be related to intracellular cholesterol transport (Smart et al., 1996), endocytosis (Montesano et al., 1982), transcytosis (Milici et al., 1987), and potocytosis (Anderson et al., 1992). It is beginning to unfold that these diverse functions are correlated with each other (Furuchi and Anderson, 1998). Importantly, many of the putative caveolae functions are related to caveolin-1 in one way or another; thus analyzing its molecular characteristics appears indispensable for an understanding of the function of caveolae.
Caveolin-1 is a principal protein of caveolae (Rothberg et al., 1992), and when cells without caveolae are transfected with its cDNA, de novo caveolae formation ensues (Fra et al., 1995). This molecule is assumed to take a hairpin loop conformation with both N and C termini exposed to the cytoplasm (for review, see Parton, 1996). Other characteristics of the molecule are the following: existence of two isoforms (α and β) with different lengths (Scherer et al., 1995), binding to cholesterol (Murata et al., 1995), oligomerization (Monier et al., 1995), and serine and/or threonine phosphorylation by protein kinase C (Smart et al., 1994). All of these properties may influence the structure and function of caveolae, but most notable is that caveolin-1 is phosphorylated in cells transformed by v-Src (Glenney and Zokas, 1989) and is copurified with Src family tyrosine kinases from normal cells (Sargiacomo et al., 1993). But the direct consequence of tyrosine phosphorylation of caveolin-1 has not been analyzed in detail.
There are nine tyrosine residues in the human caveolin-1 molecule, three of which exist only in the α-isoform. It was shown previously that the α isoform is selectively phosphorylated in v-Src–expressing cells and that tyrosine 14 is the major phosphorylation site of c-Src in vitro (Li et al., 1996b). In the present study, we generated an antibody that specifically recognizes caveolin-1 phosphorylated at tyrosine 14. By using the antibody, we performed immunohistochemical and biochemical characterization of the tyrosine-phosphorylated caveolin-1. We found that caveolin-1 is phosphorylated in multiple residues in v-Src–expressing cells and that the modification leads to flattening, aggregation, and fusion of caveolae and/or caveolae-derived vesicles; we also observed that a similar but distinct molecular modification occurs in normal cells after vanadate or pervanadate treatment. We assume that phosphorylation of caveolin-1 by v-Src and other src family kinases could affect caveolar functions through the morphological changes.
MATERIALS AND METHODS
Cells
Normal rat fibroblasts (3Y1) and their Rous sarcoma virus transformant (SR-3Y1) were obtained from Kimura’s 3Y1 Library at RIKEN Cell Bank (Tsukuba, Japan). Normal rat kidney (NRK) cells were also obtained from RIKEN Cell Bank. The cells were grown in DMEM (Nihonseiyaku, Tokyo, Japan) supplemented with 10% FBS, 50 U/ml penicillin, and 0.05 mg/ml streptomycin at 37°C in 5% CO2. Temperature-sensitive v-Src (srcts) NRK cells (Uehara et al., 1984) were kindly donated by Dr. Yoshimasa Uehara (National Institute of Health, Tokyo, Japan) and cultured in DMEM added to 10% calf serum at either 39°C (nonpermissive temperature) or 33°C (permissive temperature).
Antibodies
Anti–tyrosine 14–phosphorylated caveolin-1 antibody (PY14) was raised by injecting rabbits with a tyrosine-phosphorylated peptide (EGHLYTVPIRC) conjugated to keyhole limpet hemocyanin. The obtained antiserum was purified by an affinity column bound with the antigen peptide and then absorbed with a phosphotyrosine column to remove nonspecific binding activity to other tyrosine-phosphorylated proteins. Rabbit anti-phosphotyrosine antibody was kindly provided by Dr. Elena Pasquale (Burnam Institute, La Jolla, CA). Rabbit polyclonal anti–caveolin-1 antibodies (sc-894; Santa Cruz Biotechnology, Santa Cruz, CA; C13630; Transduction Laboratories, Lexington, KY) and mouse monoclonal anti–caveolin-1 antibodies (clones 2234, 2297, and C060; Transduction Laboratories; clone Z034, Zymed Laboratories, South San Francisco, CA) were also used; among these, two antibodies (sc-894 and clone 2234) react with the α isoform alone, whereas the rest recognize both α and β isoforms. Mouse anti–caveolin-2 antibody (Transduction Laboratories), fluorescein- and rhodamine-conjugated donkey antibodies (Jackson ImmunoResearch, West Grove, PA), and colloidal gold–conjugated goat antibodies (Amersham, Buckinghamshire, United Kingdom) raised against mouse and rabbit immunoglobulin Gs were obtained from the sources indicated.
Immunoprecipitation and Western Blotting
For immunoprecipitation, cells were treated with an ice-cold lysis buffer [1% Triton X-100, 60 mM octylglucoside, 25 mM Tris-HCl, 150 mM NaCl, 5 mM EDTA, 1 mM (p-amidinophenyl)methanesulfonyl fluoride (APMSF), 1 mM sodium orthovanadate, pH 7.5], precleared, and precipitated by antibodies prebound to agarose beads. Total cell lysates and immunoprecipitates were solubilized in an SDS-containing sample buffer, electrophoresed in acrylamide gels (13 or 5–15% gradient), and transferred to nitrocellulose paper. In some experiments, immunoprecipitated material or nitrocellulose paper after blotting was treated with 100 U/ml alkaline phosphatase (Takara Shuzo, Otsu, Japan) for 1 h at 33°C to examine the effect of dephosphorylation on antibody reactivity.
Production and Transfection of Mutant and Epitope-tagged Caveolin-1
The cDNA encoding human α-caveolin-1 was cloned by PCR and inserted into pcDNA3.1 vector (Invitrogen, San Diego, CA). By using the plasmid as a template, a point mutation to change tyrosine 14 to asparagine was generated by a QuikChange site-directed mutagenesis kit (Stratagene, La Jolla, CA) according to the manufacturer’s protocol. The product was further tagged with a c-myc epitope at the C terminus and then used to transfect to 3Y1 and SR-3Y1 cells by lipofection. Stably transfected cell lines were selected with G418 (Life Technologies, Rockville, MD).
Immunofluorescence Microscopy
Cells cultured on glass coverslips were fixed with 3% formaldehyde in 0.1 M sodium phosphate buffer for 5 min, permeabilized with 1% Triton X-100 for 5 min, and pretreated with 3% BSA for 10 min. Some cells were treated with either 100 μM sodium orthovanadate for 2–8 h or 1 mM sodium orthovanadate plus 3 mM hydrogen peroxide (pervanadate) for up to 30 min before fixation. They were incubated with various primary antibodies, either singly or doubly, followed by fluorescein- and/or rhodamine-conjugated secondary antibodies. F-actin was labeled by rhodamine-phalloidin (Sigma Chemical, St. Louis, MO). The samples were observed under a Zeiss (Thornwood, NY) Axiophot 2 microscope.
Immunoelectron Microscopy
For immunolabeling of ultrathin cryosections, cells were fixed with buffered 1% formaldehyde for 15 min, scraped, and embedded in 10% gelatin. They were then infiltrated with sucrose-polyvinyl pyrrolidone mixture, frozen, and sectioned (Tokuyasu, 1986). For immunolabeling of freeze-fractured replicas, cells cultured on thin gold foil were rapidly frozen by the metal sandwich method (Fujimoto and Fujimoto, 1997). The cell sandwich sample was freeze fractured in a Balzers BAF060 apparatus (Balzers High Vacuum, Balzers, Liechtenstein), and the obtained platinum and carbon replicas were then treated with SDS (Fujimoto, 1995) and incubated with BSA for blocking. Both cryosections and freeze replicas were incubated with primary and colloidal gold–conjugated secondary antibodies and observed under a Jeol (Tokyo, Japan) 100CX electron microscope. Distribution of gold particles was analyzed quantitatively on printed micrographs.
Analysis of Triton X-100 Solubility, Oligomer Formation, and Association with Caveolin-2
To study solubility of tyrosine-phosphorylated caveolin-1 in Triton X-100, cells were treated with 1% Triton X-100 in [N-morpholino]ethanesulfonic acid (MES)-buffered saline (25 mM MES, 150 mM NaCl, 1 mM APMSF, 1 mM sodium orthovanadate, pH 6.5) for 30 min on ice; after centrifugation at 15,000 rpm for 10 min, the pellet and supernatant were dissolved in the same amount of SDS sample buffer for gel electrophoresis and Western blotting. Oligomer formation was examined according to a published procedure with some modification (Sargiacomo et al., 1995). Briefly, the Triton X-100–insoluble pellet was treated by a lysis buffer (1% Triton X-100, 60 mM octylglucoside, 25 mM MES, 150 mM NaCl, 1 mM APMSF, 1 mM sodium orthovanadate, pH 6.5) for 20 min on ice and centrifuged at 100,000 × g for 30 min. The supernatant was layered onto a 5–30% linear sucrose gradient in the lysis buffer, and centrifuged in an SW41 rotor (Beckman Instruments, Palo Alto, CA) at 100,000 × g for 20 h at 4°C. Fractions were collected, precipitated with cold acetone, and analyzed by Western blotting. Association of caveolin-2 was examined by Western blotting of materials immunoprecipitated by anti–caveolin-1 antibody.
RESULTS
Specificity of PY14
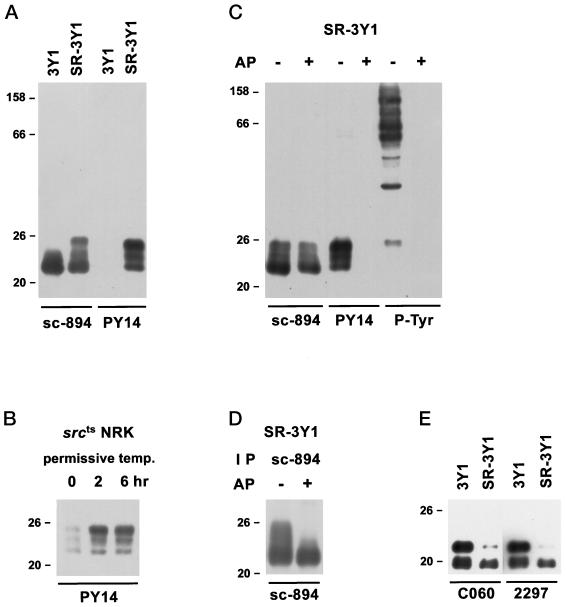
The credibility of the present study depends on the specificity of the antibody to tyrosine-phosphorylated caveolin-1 (PY14). It was necessary to show that the antibody recognizes only caveolin-1 phosphorylated at tyrosine 14 but not nonphosphorylated caveolin-1 or other tyrosine-phosphorylated proteins. In Western blotting using anti–α-caveolin-1 polyclonal antibody (sc-894), an intense band was seen at 22 kDa for both normal fibroblast (3Y1) and its v-Src–expressing counterpart (SR-3Y1); in addition, a broad reaction with prominent bands at 23–24 and 25 kDa were observed only for SR-3Y1 (Figure 1A). In contrast, with PY14, no reaction was seen for 3Y1, but an intense one occurred for SR-3Y1. The bands ranged from 22 to 25 kDa and matched with those obtained with sc-894 (22, 23–24, and 25 kDa). Notably, the most intense reaction occurred at 22 kDa for sc-894, whereas it was at 25 kDa for PY14. In srcts NRK cells, the reaction with PY14 became apparent only after a few hours of culture at the permissive temperature (Figure 1B). Furthermore, when the nitrocellulose membrane blot with the total lysate of SR-3Y1 was treated with alkaline phosphatase, reactivity with PY14 and anti-phosphotyrosine was lost, but reaction with sc-894 remained (Figure 1C). In Western blotting of the SR-3Y1 sample immunoprecipitated with sc-894, several bands between 22 and 25 kDa were labeled, but when the precipitate was dephosphorylated before electrophoresis, the 23- to 24- and 25-kDa bands were lost, and only the 22-kDa band was detected (Figure 1D). These results show that PY14 recognizes caveolin-1 only when phosphorylated at tyrosine 14 and that other residues were also phosphorylated in the upper bands.
Figure 1.
Western blots using anti–caveolin-1 antibodies and/or PY14. (A) Comparison of 3Y1 and SR-3Y1. Anti–α-caveolin-1 antibody (sc-894) reacted with both samples, but PY14 labeled the latter sample alone. The reaction for SR-3Y1 was broad but with prominent bands at 22, 23–24, and 25 kDa. (B) srcts NRK cells. Reaction with PY14 became detectable only after the cell had been transferred to the permissive temperature. (C) Effect of alkaline phosphatase treatment of nitrocellulose blots of SR-3Y1 lysate. After dephosphorylation, the reactivity with PY14 and anti-phosphotyrosine was lost, whereas the reaction with sc-894 remained. (D) Effect of alkaline phosphatase treatment on immunoprecipitates from SR-3Y1 lysate. Immunoprecipitates obtained with sc-894 were dephosphorylated before being subjected to SDS-PAGE and reacted with sc-894 on blots. Bands above 22 kDa were lost after dephosphorylation. (E) Reactivity of monoclonal anti–caveolin-1 antibodies (clones C060 and 2297) with 3Y1 and SR-3Y1. The antibodies recognize both α and β isoforms in 3Y1 samples, but in SR-3Y1 ones the reaction with the α isoform is much weaker than that with the β isoform.
Notably several anti–caveolin-1 mAbs (clones 2297, C060, and Z034) recognizing both α and β isoforms did not react well with the α isoform of v-Src–expressing cells (Figure 1E). When the 3Y1 and SR-3Y1 samples were loaded to show an equivalent reaction to sc-894, the α and β isoforms of 3Y1 were detected with equal intensity by the mAbs; in contrast, the β isoform label was much denser than the α isoform one in SR-3Y1.
Localization of Tyrosine-phosphorylated Caveolin-1
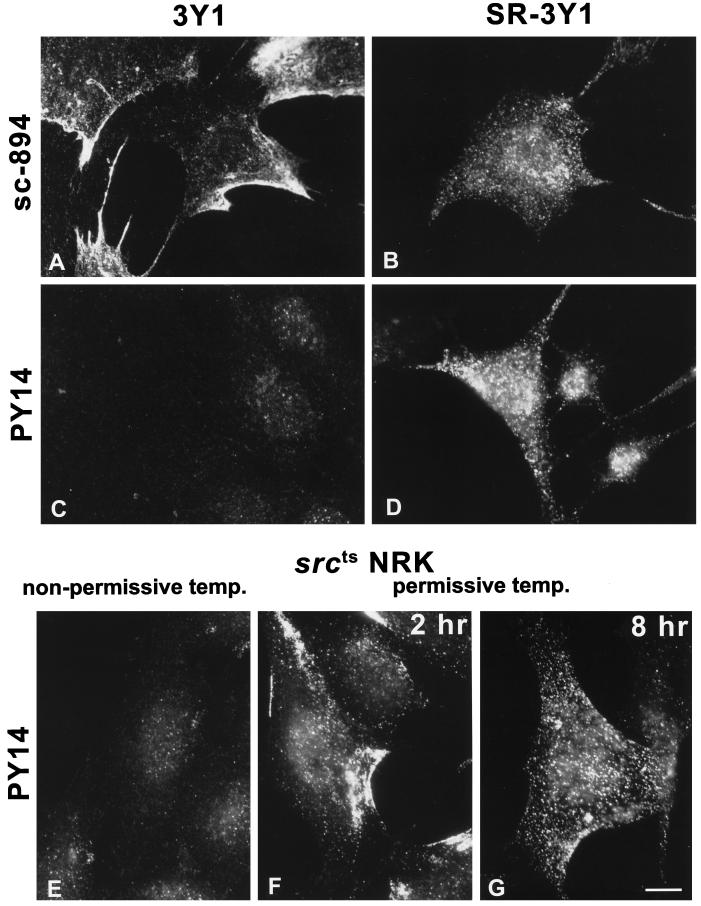
By immunofluorescence microscopy using sc-894, the label was observed as patches along the cell periphery in most 3Y1 cells (Figure 2A). In contrast, the peripheral patches were scarcely found in SR-3Y1; instead, the label was seen as randomly distributed dots, as reported previously (Figure 2B; Glenney and Zokas, 1989). PY14 did not label 3Y1 positively (Figure 2C), but it labeled SR-3Y1 in a dot manner (Figure 2D). Large dots were observed more conspicuously by PY14 than by sc-894 and were distributed not only along the cell surface but also in the cytoplasm. The labeling in SR-3Y1 was eliminated by preincubating the antibody with the antigen peptide. In srcts NRK cells, PY14 labeled only a small percentage of the cells at the nonpermissive temperature (39°C; Figure 2E); after 2 h of culture at the permissive temperature (33°C), virtually all the cells became positive, but the labeling was mostly seen as peripheral patches (Figure 2F); after 8 h at 33°C, the label was observed as large and small dots distributed throughout the cell (Figure 2G). The distribution of PY14-positive large dots in SR-3Y1 and srcts NRK cells was not correlated with that of F-actin.
Figure 2.
Immunofluorescence microscopy. (A and B) sc-894 intensely labeled both 3Y1 (A) and SR-3Y1 (B) cells. Note that the labeling occurs as peripheral patches in 3Y1 but as randomly distributed dots in SR-3Y1 cells. (C and D) PY14 does not bind to 3Y1 (C) but labels SR-3Y1 cells in a similar pattern as sc-894 (D); note that some dots are apparently larger than others. (E–G) Most srcts NRK cells were negative with PY14 at 39°C (nonpermissive temperature) (E), but after the temperature was lowered to 33°C (permissive temperature), they showed intense labeling in peripheral patches at 2 h (F) and randomly distributed large dots at 8 h (G). Bar, 10 μm.
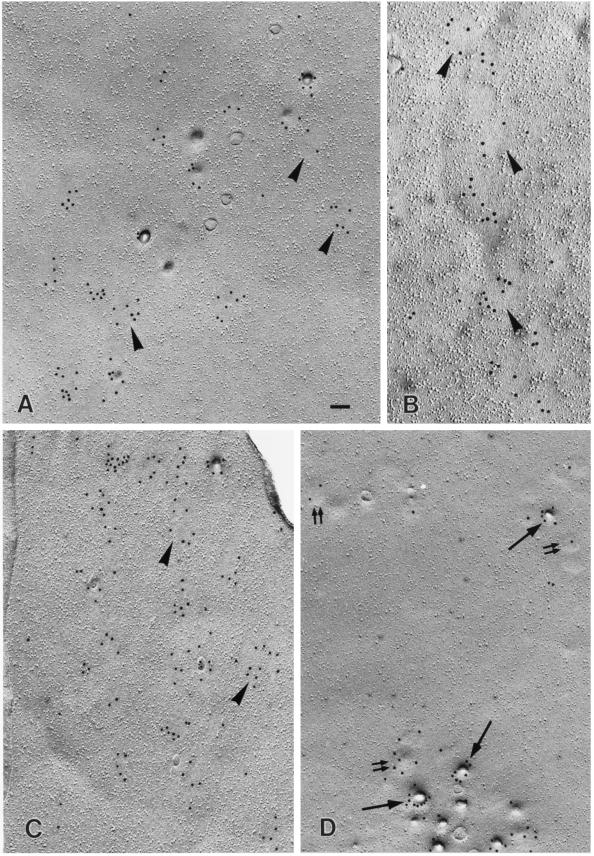
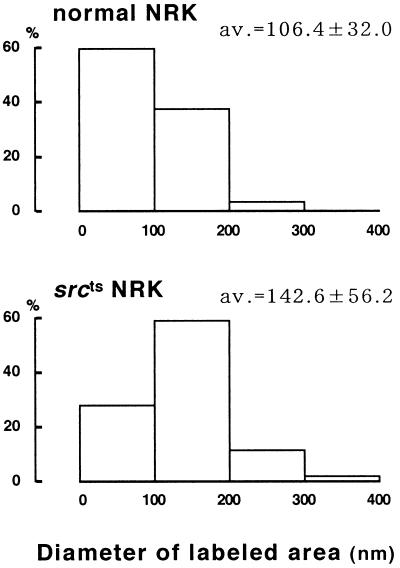
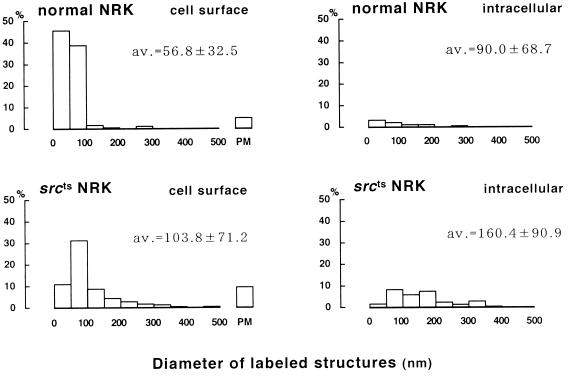
To examine the identity of the large dots at the ultrastructural level, we immunolabeled SDS-treated freeze fracture replicas and ultrathin cryosections. By both techniques, PY14 and sc-894 gave the same labeling in v-Src–expressing cells. On freeze replicas, deep and shallow caveolae were labeled positively (Figure 3, A and C) as shown previously for caveolin-1 in other cell types (Fujimoto and Fujimoto, 1997; Nomura et al., 1997). In addition, flat intramembrane particle (IMP)-free areas, which were usually seen in the vicinity of typical caveolae, were densely labeled (Figure 3, A and B). The size and shape of the labeled area varied: some were round and as small as shallow caveolae, whereas others took irregular shapes and were larger than caveolae; the latter appeared to be formed by fusion of smaller IMP-free areas. In contrast, normal NRK cells were not labeled by PY14; in those cells, a majority of the sc-894 labeling was associated with patches of deep and shallow caveolae, whereas truly flat IMP-free areas labeled by the antibody were scarce (Figure 3D). Moreover, in normal NRK cells, the labeling in shallow caveolae occurred less densely than that in deep ones, probably reflecting a differential expression of the α and β isoforms in caveolae of different depths (Fujimoto, Kogo, Nomura, Takahashi, and Une, unpublished results). To address the difference between normal and srcts NRK cells quantitatively, the diameter of the sc-894–positive areas was measured. Because deep caveolae were invariably <100 nm in diameter and occurred in a large cluster only in normal NRK cells, their inclusion distorted the comparison. Thus deep caveolae were excluded from the quantification; even counting only the IMP-free flat areas and shallow caveolae, the average size of the labeled area was significantly smaller in normal NRK cells than in srcts NRK cells (Figure 4).
Figure 3.
Freeze fracture immunoelectron microscopy. (A–C) srcts NRK cell cultured at the permissive temperature. (A and B) Labeling by PY14 occurred not only in caveolae of normal shape but also in IMP-free flat areas of various sizes and shapes (arrowheads). (C) Similar labeling was observed with sc-894. (D) In normal NRK cells, virtually all the labeling by sc-894 was seen in deep (single large arrows) and shallow (double small arrows) caveolae, and IMP-free flat areas were scarce. Bar, 100 nm (A, C, and D), 85 nm (B).
Figure 4.
Quantitative comparison of sc-894–positive areas in freeze fracture immunoelectron microscopy. The diameter of the labeled areas was measured for shallow caveolae and IMP-free flat areas. They were significantly larger in srcts NRK cells than in normal NRK cells (Mann–Whitney U test, p < 0.0001).
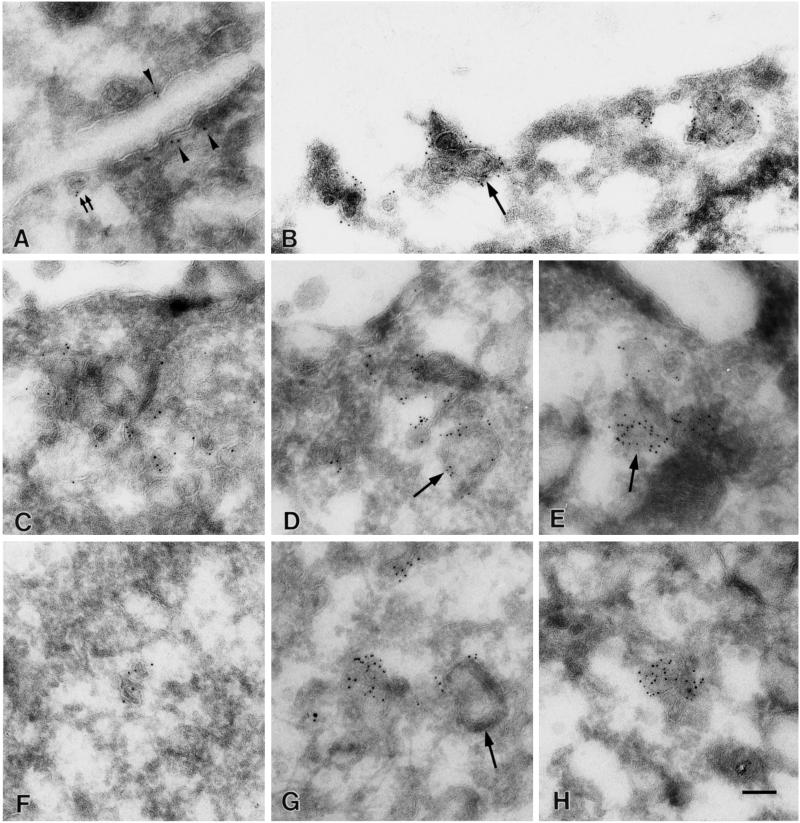
In ultrathin cryosections, the result of freeze replica labeling in the plasma membrane was confirmed: seemingly flat plasma membrane areas as well as typical caveolae were labeled (Figure 5A). Furthermore, PY14 decorated aggregates of caveolae and/or vesicles (collectively termed as aggregated vesicles hereafter); some of them were of normal caveola size, but others were apparently larger than caveolae (Figure 5, B–H). The aggregates are likely to correspond to large dots seen by immunofluorescence microscopy. They were seen either in the vicinity of the plasma membrane (Figure 5, B–E) or deep in the cytoplasm (Figure 5, F–H). Even in sections as thin as 50 nm (interference color, gold), the vesicles tend to be seen as overlapping membranes, and the connection between their lumens was not apparent. Gold particles were seen along the membrane of caveolae and caveolae-sized vesicles, but they were often seen inside the larger vesicles (Figure 5, E and H). The size and distribution of sc-894–positive structures were quantified and compared between normal and srcts NRK cells; in srcts NRK cells, they were distributed more distant from the plasma membrane and larger in diameter than in normal NRK cells (Figure 6). Consistent with the result of freeze fracture immunocytochemistry, the labeling in the seemingly flat plasma membrane was also more frequent in srcts NRK cells than in normal cells (Figure 6), although distinction between the flat IMP-free areas and shallow caveolae could not be made in ultrathin sections. We tried to observe the detailed ultrastructure of the aggregated vesicles and to examine whether their lumen was open to the cell surface by conventional electron microscopy. But it was difficult to unequivocally identify the PY14-positive aggregated vesicles by morphology alone.
Figure 5.
Immunoelectron microscopy of ultrathin cryosections. Labeling of srcts NRK cells cultured at the permissive temperature with PY14. (A) Caveolae (double small arrows) as well as the flat plasma membrane (arrowheads) are decorated. Aggregated caveolae and/or vesicles found relatively near the cell surface (B–E) or in the deeper cytoplasm (F–H) are also labeled heavily. Some of them are as small as caveolae, but others are apparently larger than caveolae (single arrows). Bar, 100 nm.
Figure 6.
Quantitative analysis of the distribution and size of sc-894–positive structures in immunoelectron microscopy of ultrathin cryosections. Vesicles and caveolae were classified into “cell surface” and “intracellular,” depending on whether a portion of them existed within 200 nm from the plasma membrane. The proportion of intracellular labeling in srcts NRK cells (29.6%) was significantly more frequent than in normal NRK cells (7.9%) (χ2 test for independence, p < 0.0001). PM, labeling in the seemingly flat portion of the plasma membrane most likely corresponds to both shallow caveolae and IMP-free flat areas seen in freeze replicas; its proportion in the cell surface labeling was also significantly larger in srcts NRK cells than in normal NRK cells (χ2 test for independence, p = 0.0087). Moreover, the diameter of the labeled structures was significantly larger in srcts NRK cells than in normal NRK cells (Mann–Whitney U test: cell surface, p < 0.0001; intracellular, p = 0.0011).
Biochemical Characterization of PY14-positive Caveolin-1
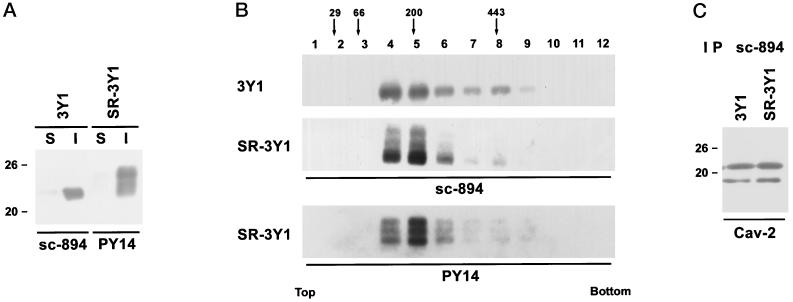
Tyrosine phosphorylation may modify some of the molecular properties of caveolin-1 and thus may lead to the change as described above. To study this possibility, we compared caveolin-1 taken from SR-3Y1 with that from 3Y1 in terms of detergent solubility, oligomer formation, and association with caveolin-2. Little caveolin-1 was solubilized from 3Y1 cells by treatment of them with 1% Triton X-100 for 30 min at 4°C. The 22- to 25-kDa bands detected by PY14 in SR-3Y1 were also recovered in the insoluble fraction, and no difference from nonphosphorylated caveolin-1 could be found (Figure 7A). Phosphorylated and nonphosphorylated caveolin-1 was also not different in the solubility to 60 mM octylglucoside (our unpublished results). Oligomer formation was examined by sucrose density gradient ultracentrifugation of 3Y1 and SR-3Y1 lysates in an octylglucoside-containing solution. Both samples showed positive reaction in the 150- to 400-kDa fractions when probed with sc-894 and/or PY14, and no significant difference was observed (Figure 7B). Association with caveolin-2 was studied by Western blotting of samples immunoprecipitated from lysates of 3Y1 and SR-3Y1. The sc-894 precipitates of both 3Y1 and SR-3Y1 showed a positive reaction for caveolin-2 (Figure 7C), indicating invariable association of caveolin-1 and -2. The results indicate that tyrosine-phosphorylated caveolin-1 may not be different from its nonphosphorylated counterpart as far as detergent solubility, oligomer formation, and association with caveolin-2 are concerned.
Figure 7.
Biochemical characterization of tyrosine-phosphorylated caveolin-1. (A) Solubility in Triton X-100. The reaction of PY14 in SR-3Y1 as well as that of sc-894 in 3Y1 occurred intensely for the Triton X-100–insoluble material (I) but only weakly for the Triton X-100–soluble one (S). (B) Oligomer formation. Fractions of sucrose density gradient ultracentrifugation were subjected to SDS-PAGE, and caveolin-1 was detected by Western blotting using sc-894 and PY14. Both 3Y1 and SR-3Y1 showed a positive reaction between 150 and 400 kDa. Locations of molecular mass marker proteins are indicated by arrows. (C) Association with caveolin-2. Immunoprecipitates obtained with sc-894 from both 3Y1 and SR-3Y1 cells are positive for caveolin-2.
Mutant Caveolin-1 Lacking Tyrosine 14
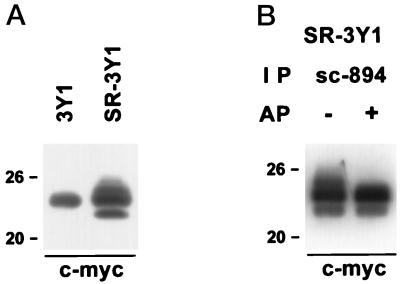
To confirm that caveolin-1 is phosphorylated in residues other than tyrosine 14 and to examine whether phosphorylation of tyrosine 14 is a prerequisite for further modifications, we constructed a mutant caveolin-1 tagged with c-myc, in which tyrosine 14 was replaced with asparagine, and used it to transfect 3Y1 and SR-3Y1 cells. By Western blotting using anti–c-myc antibody, one and three positive bands were detected in 3Y1 and SR-3Y1 cells, respectively (Figure 8A). Judging from the relative mobility, the one band in 3Y1 cells appeared to be the α isoform, and the three bands in SR-3Y1 cells were considered the β isoform, the α isoform, and the modified α isoform from the bottom; although the reason was not clear, the β isoform was hardly expressed in 3Y1 cells. When the immunoprecipitate of SR-3Y1 cells by sc-894 antibody was dephosphorylated before electrophoresis, the extra band above the α isoform was not detected by Western blotting using anti–c-myc antibody (Figure 8B). The result indicates that at least one residue other than tyrosine 14 is modified in v-Src–expressing cells and that it occurs without phosphorylation of tyrosine 14.
Figure 8.
Western blots of mutant caveolin-1 whose tyrosine 14 was replaced with asparagine. (A) The lysates of transfected 3Y1 and SR-3Y1 cells were reacted with anti–c-myc tag antibody. The band of 3Y1 indicates the position of nonphosphorylated mutant caveolin-1α. At least one additional band is seen above the α isoform in the SR-3Y1 sample. (B) The lysate of transfected SR-3Y1 cells was precipitated with sc-894 and dephosphorylated by alkaline phosphatase before electrophoresis and Western blotting by anti–c-myc antibody. By dephosphorylation, the reaction with the band above the α isoform was abolished.
Tyrosine Phosphorylation of Caveolin-1 in Normal Cells
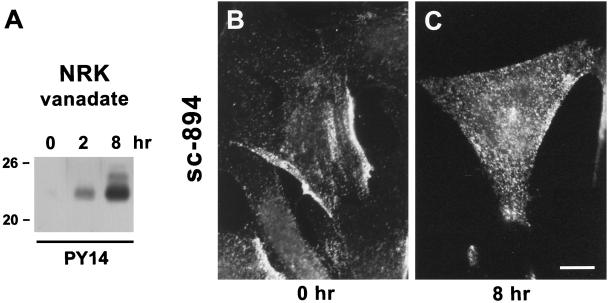
When 3Y1 or normal NRK cells were incubated with vanadate or pervanadate, which are inhibitors of tyrosine phosphatase, an intense reaction with PY14 became visible by Western blotting. Pervanadate was more effective than vanadate alone, but cells treated with it tended to be detached from the substrate after several hours; thus to observe a long-term effect, we used vanadate as the inhibitor. The reaction of NRK cell lysates with PY14 was seen as a single band at 22 kDa after 2 h of vanadate treatment, and two additional bands at 23–24 and 25 kDa were also visible after 8 h (Figure 9A). Concurrently immunofluorescence labeling by sc-894 changed. In untreated NRK cells, the label was seen mostly as peripheral patches (Figure 9B), but after 8 h of vanadate treatment, the patches disappeared, and the labeling was observed as small dots distributed randomly (Figure 9C). The cells treated with vanadate for 2–8 h did not show bright immunofluorescence labeling with PY14, but those with pervanadate for 30 min were labeled intensely (our unpublished results). In both cases, however, the large dots observed to be labeled in v-Src–expressing cells were not detected.
Figure 9.
Normal NRK cells treated with vanadate. (A) Western blotting shows that the reaction with PY14 occurs as a single band at 22 kDa (at 2 h) and as three bands at 22, 23–24, and 25 kDa (at 8 h). (B and C) Immunofluorescence micrographs of normal NRK cells before (B) and after (C) the vanadate treatment. Caveolin-1 was localized as peripheral patches in untreated cells, but they disappeared after the treatment. Bar, 10 μm.
DISCUSSION
By raising a specific antibody to caveolin-1 phosphorylated at tyrosine 14, we could analyze the distribution and molecular characteristics of the modified molecule in detail. The result of Western blotting indicates that phosphorylation of caveolin-1 in v-Src–expressing cells occurs not only at tyrosine 14 but also at other residues; that is, there were several bands reactive with PY14 in both SR-3Y1 and srcts NRK cells; at least one upper band was detected even for the mutant caveolin-1 lacking tyrosine 14, and after dephosphorylation, caveolin-1 was detected as a single band at 22 kDa. The possibility that the upper bands were modified β isoform was excluded, because all of them were recognized by anti–α-caveolin-1 (sc-894). Phosphorylation sites besides tyrosine 14 are not known at present, but they could be serine (or threonine), as reported in chicken cells (Glenney, 1989), or tyrosine residues other than tyrosine 14.
In v-Src–expressing cells, caveolin-1 showed a distribution different from that in their normal counterpart: formation of patches along cell edges was lost, and caveolin-1 occurred in large flat areas of the plasma membrane and in aggregated vesicles in the cytoplasm. The freeze fracture immunoelectron microscopy clearly showed that the flat areas labeled by PY14 in the plasma membrane were demarcated by the absence of IMPs and seen in the vicinity of caveolae. In normal cells, most caveolin-1 labeling occurred in patches of deep and shallow caveolae as observed previously (Fujimoto and Fujimoto, 1997; Nomura et al., 1997), and labeled flat IMP-free areas were hardly seen. The size of the caveolin-1–positive IMP-free areas in cells transformed by v-Src was significantly larger than shallow caveolae or few flat structures seen in their normal counterpart. Moreover, whereas shallow caveolae were labeled by sc-894 only inefficiently in normal cells (Fujimoto, Kogo, Nomura, Takahashi, and Une, unpublished results), the IMP-free areas in v-Src–expressing cells were densely labeled. Based on these results, we assume that the large caveolin-1–positive IMP-free areas in v-Src–expressing cells are distinct from shallow caveolae and probably formed by mutual fusion of flattened caveolae.
The cytoplasmic structure labeled positively by PY14 looked like racemose caveolae, that is, a group of caveolae sharing the lumen and connected to the cell surface. Racemose caveolae have been described in various cells in vivo (Bundgaard et al., 1983; Bundgaard, 1991) and in vitro (Parton et al., 1994) and were induced in cultured keratinocytes by disorganizing the actin cytoskeleton with cytochalasin D (Fujimoto et al., 1995). However, the aggregated vesicles observed in the present study may be different from racemose caveolae, because most of them did not appear to share the lumen; moreover, many of them were found in the deep cytoplasm and thus were unlikely to be open to the cell surface; they were also different from racemose caveolae induced by cytochalasin D in that coaggregation of F-actin was not observed. The mechanism responsible for formation of the aggregated vesicles is not known. But considering that membranes of the vesicles are closely apposed in the aggregates and that flattened caveolae in the plasma membrane appear to fuse, as discussed above, the aggregated vesicles might be also formed by adhesion and fusion of caveolae and/or caveolae-derived vesicles. As a result, some of them may become larger vesicles, whereas others remain as caveola-sized vesicles and are closely apposed to other ones.
We looked for changes in the molecular properties of caveolin-1 between normal and v-Src–expressing cells, but detergent solubility, oligomer formation, and association with caveolin-2 were found to be the same in 3Y1 and SR-3Y1 cells. Caveolin-1 is thought to form oligomers in the endoplasmic reticulum (ER) before being transported through the Golgi to the plasma membrane (Monier et al., 1995). Because tyrosine phosphorylation by myristylated v-Src is likely to occur at the plasma membrane, only some but not all constituent caveolin-1 molecules in an oligomer may be modified. If this assumption is correct, phosphorylated and nonphosphorylated molecules should coexist in an oligomer, and the characteristics of phosphorylated molecules may be masked in the biochemical experiments. Consistent with this, immunolabeling with PY14 occurred in the same manner as that with sc-894 in v-Src–expressing cells. But the negative result in the present biochemical experiments does not exclude the possibility that phosphorylation alters the molecular properties of caveolin-1 in some aspects. In fact, by Western blotting, a battery of monoclonal anti–caveolin-1 antibodies, whose epitopes are in a segment common to the α and β isoforms, showed much lower reactivity to the α isoform than to the β isoform only in v-Src–expressing cells. Because phosphorylation by v-Src was shown to occur in the α isoform–specific segment (Li et al., 1996b), it is peculiar that reactivity to the antibodies was reduced. The observation might suggest that some conformational change of α-caveolin-1 occurs as a result of multiple phosphorylation. Therefore, although the caveolin-scaffolding domain, which is supposed to exert the regulatory function of caveolin-1 on various proteins (Li et al., 1996a), is distant from the α-specific segment, its function could be also modified in the phosphorylated molecule.
Besides the direct alteration of caveolin-1, various caveolar functions may be changed by dissolution of patches, flattening in the plasma membrane, and formation of the aggregated vesicles. First, the intimate structural relationship between caveolae and the ER (Kogo et al., 1997) may be disrupted. Caveolae have been hypothesized to be related to Ca2+ influx and extrusion (Fujimoto et al., 1992; Fujimoto, 1993) and intracellular cholesterol transport (Fielding and Fielding, 1995; Smart et al., 1996), whereas the ER is thought to be a site of Ca2+ storage and the site of de novo cholesterol synthesis (for reviews, see Pozzan et al., 1994; Fielding and Fielding, 1997). Although speculative, their close apposition might be related to their functional correlation in Ca2+ regulation and cholesterol, and this relationship may be changed in v-Src–expressing cells. Second, because a significant proportion of caveolae-derived vesicles appear to be sequestered from the cell surface in v-Src–expressing cells, receptors and their downstream signaling molecules that reside in caveolae may be separated from the extracellular milieu. The change may insulate cells from various extracellular ligands. In oncogenically transformed cells, expression of caveolin-1 and the number of caveolae were reported to decrease (Koleske et al., 1995). In contrast, the expression of caveolin-1 was not much different between normal and v-Src–expressing cells as far as examined by sc-894 in Western blotting. The presence of caveolin-1 in the flat IMP-free plasmalemmal areas as well as intracellular vesicles implies that an alteration of caveolar function in transformed cells could occur without a drastic reduction in caveolin-1 expression.
The present study confirmed the result on endothelial cells that vanadate or pervanadate induces tyrosine phosphorylation of caveolin-1 in normal cells (Vepa et al., 1997). Although the reaction of vanadate-treated NRK cell lysates with PY14 in Western blotting occurred in the same three bands (22, 23–24, and 25 kDa) as in v-Src–expressing cells, it was most intense at 22 kDa, whereas the 25-kDa band was the strongest in v-Src–expressing cells, the difference most likely reflecting the difference in kinases involved. Effects of tyrosine phosphorylation on caveolin-1 distribution in vanadate-treated cells were the same as in v-Src–transformed cells in that peripheral patches disappeared but were different in that the large dots corresponding to the aggregated vesicles were not seen. In cultured endothelial cells, however, we observed extensive vesiculation of caveolae after the vanadate treatment (Aoki, Nomura, and Fujimoto, unpublished observations). Different cells may have different sensitivity and/or different machinery to respond to tyrosine phosphorylation of caveolin-1. Thus, in contrast to v-Src–expressing cells, in which extensive phosphorylation occurs, diverse phenomena might occur when the level of tyrosine phosphorylation is relatively low.
In summary, the present study revealed the following results in v-Src–expressing cells: 1) caveolin-1 is phosphorylated not only in tyrosine 14 but also in other residues; 2) it is not distributed in peripheral patches as seen in normal cells but is found in IMP-free flat plasmalemmal areas and in aggregated caveolae and/or caveolae-derived vesicles; and 3) Triton X-100 insolubility, oligomer formation, and association with caveolin-2 persisted, but the molecular conformation may be altered. Caveolin-1 can be phosphorylated at tyrosine 14 in normal cells, but its consequence is different from that caused by v-Src. Tyrosine phosphorylation of caveolin-1 in v-Src–expressing cells has been considered a critical event for cellular transformation. Further analysis of its significance will be important for a better understanding of the physiology and pathology of caveolae.
ACKNOWLEDGMENTS
We are grateful to Dr. Yoshimasa Uehara for srcts NRK cells, to Dr. Elena Pasquale for anti-phosphotyrosine antibody, to Dr. Yoshimi Takai (Osaka University, Osaka, Japan) for continuous encouragement, and to Fujie Miyata and Yukiko Takahashi for excellent technical and secretarial assistance. R.N. also thanks Yoko Nomura, Santito Nomura, and Clara Nomura for continuous encouragement. This work was supported by grants-in-aid for scientific research from the Ministry of Education, Science, Sports, and Culture of the Japanese government and research grants from Suzuken Memorial Foundation and The Sagawa Foundation for Promotion of Cancer Research to T.F. and by research fellowships of the Japan Society for the Promotion of Science for Young Scientists to R.N.
REFERENCES
- Anderson RGW. Caveolae: where incoming and outgoing messengers meet. Proc Natl Acad Sci USA. 1993;90:10909–10913. doi: 10.1073/pnas.90.23.10909. [DOI] [PMC free article] [PubMed] [Google Scholar]
- Anderson RGW, Kamen BA, Rothberg KG, Lacey SW. Potocytosis: sequestration and transport of small molecules by caveolae. Science. 1992;255:410–411. doi: 10.1126/science.1310359. [DOI] [PubMed] [Google Scholar]
- Bundgaard M. The three-dimensional organization of smooth endoplasmic reticulum in capillary endothelia: its possible role in regulation of free cytosolic calcium. J Struct Biol. 1991;107:76–85. doi: 10.1016/1047-8477(91)90033-s. [DOI] [PubMed] [Google Scholar]
- Bundgaard M, Hageman P, Crone C. The three-dimensional organization of plasmalemmal vesicular profiles in the endothelium of rat heart capillaries. Microvasc Res. 1983;25:358–368. doi: 10.1016/0026-2862(83)90025-0. [DOI] [PubMed] [Google Scholar]
- Fielding CJ, Fielding PE. Intracellular cholesterol transport. J Lipid Res. 1997;38:1503–1521. [PubMed] [Google Scholar]
- Fielding PE, Fielding CJ. Plasma membrane caveolae mediate the efflux of cellular free cholesterol. Biochemistry. 1995;34:14288–14292. doi: 10.1021/bi00044a004. [DOI] [PubMed] [Google Scholar]
- Fra AM, Williamson E, Simons K, Parton RG. De novo formation of caveolae in lymphocytes by expression of VIP21-caveolin. Proc Natl Acad Sci USA. 1995;92:8655–8659. doi: 10.1073/pnas.92.19.8655. [DOI] [PMC free article] [PubMed] [Google Scholar]
- Fujimoto K. Freeze-fracture replica electron microscopy combined with SDS digestion for cytochemical labeling of integral membrane proteins—application to the immunogold labeling of intercellular junctional complexes. J Cell Sci. 1995;108:3443–3450. doi: 10.1242/jcs.108.11.3443. [DOI] [PubMed] [Google Scholar]
- Fujimoto T. Calcium pump of the plasma membrane is localized in caveolae. J Cell Biol. 1993;120:1147–1157. doi: 10.1083/jcb.120.5.1147. [DOI] [PMC free article] [PubMed] [Google Scholar]
- Fujimoto T, Fujimoto K. Metal sandwich method to quick-freeze monolayer cultured cells for freeze fracture. J Histochem Cytochem. 1997;45:595–598. doi: 10.1177/002215549704500411. [DOI] [PubMed] [Google Scholar]
- Fujimoto T, Hagiwara H, Aoki T, Kogo H, Nomura R. Caveolae: a morphological point of view. J Electron Microsc. 1998;47:451–460. doi: 10.1093/oxfordjournals.jmicro.a023616. [DOI] [PubMed] [Google Scholar]
- Fujimoto T, Miyawaki A, Mikoshiba K. Inositol 1,4,5-trisphosphate receptor-like protein in plasmalemmal caveolae is linked to actin filaments. J Cell Sci. 1995;108:7–15. doi: 10.1242/jcs.108.1.7. [DOI] [PubMed] [Google Scholar]
- Fujimoto T, Nakade S, Miyawaki A, Mikoshiba K, Ogawa K. Localization of inositol 1,4,5-trisphosphate receptor-like protein in plasmalemmal caveolae. J Cell Biol. 1992;119:1507–1513. doi: 10.1083/jcb.119.6.1507. [DOI] [PMC free article] [PubMed] [Google Scholar]
- Furuchi T, Anderson RGW. Cholesterol depletion of caveolae causes hyperactivation of extracellular signal-related kinase (ERK) J Biol Chem. 1998;273:21099–21104. doi: 10.1074/jbc.273.33.21099. [DOI] [PubMed] [Google Scholar]
- Glenney JR., Jr Tyrosine phosphorylation of a 22-kDa protein is correlated with transformation by Rous sarcoma virus. J Biol Chem. 1989;264:20163–20166. [PubMed] [Google Scholar]
- Glenney JR, Jr, Zokas L. Novel tyrosine kinase substrates from Rous sarcoma virus-transformed cells are present in the membrane skeleton. J Cell Biol. 1989;108:2401–2408. doi: 10.1083/jcb.108.6.2401. [DOI] [PMC free article] [PubMed] [Google Scholar]
- Kogo H, Shioya M, Takahashi Y, Fujimoto T. Caveolae and endoplasmic reticulum: immunofluorescence microscopy and time lapse analysis. Acta Histochem Cytochem. 1997;30:593–599. [Google Scholar]
- Koleske AJ, Baltimore D, Lisanti MP. Reduction of caveolin and caveolae in oncogenically transformed cells. Proc Natl Acad Sci USA. 1995;92:1381–1385. doi: 10.1073/pnas.92.5.1381. [DOI] [PMC free article] [PubMed] [Google Scholar]
- Li S, Couet J, Lisanti MP. Src tyrosine kinases, Gα subunits, and H-Ras share a common membrane-anchored scaffolding protein, caveolin. Caveolin binding negatively regulates the auto-activation of Src tyrosine kinases. J Biol Chem. 1996a;271:29182–29190. doi: 10.1074/jbc.271.46.29182. [DOI] [PMC free article] [PubMed] [Google Scholar]
- Li S, Seitz R, Lisanti MP. Phosphorylation of caveolin by src tyrosine kinases. The α-isoform of caveolin is selectively phosphorylated by v-Src in vivo. J Biol Chem. 1996b;271:3863–3868. [PubMed] [Google Scholar]
- Lisanti MP, Scherer PE, Tang Z-L, Sargiacomo M. Caveolae, caveolin and caveolin-rich membrane domains: a signaling hypothesis. Trends Cell Biol. 1994;4:231–235. doi: 10.1016/0962-8924(94)90114-7. [DOI] [PubMed] [Google Scholar]
- Milici AJ, Watrous NW, Stukenbrok H, Palade GE. Transcytosis of albumin in capillary endothelium. J Cell Biol. 1987;105:2603–2612. doi: 10.1083/jcb.105.6.2603. [DOI] [PMC free article] [PubMed] [Google Scholar]
- Monier S, Parton RG, Vogel F, Behlke J, Henske A, Kurzchalia TV. VIP21-caveolin, a membrane protein constituent of the caveolar coat, oligomerizes in vivo and in vitro. Mol Biol Cell. 1995;6:911–927. doi: 10.1091/mbc.6.7.911. [DOI] [PMC free article] [PubMed] [Google Scholar]
- Montesano R, Roth J, Robert A, Orci L. Noncoated membrane invaginations are involved in binding and internalization of cholera and tetanus toxins. Nature. 1982;296:651–653. doi: 10.1038/296651a0. [DOI] [PubMed] [Google Scholar]
- Murata M, Peranen J, Schreiner R, Wieland F, Kurzchalia TV, Simons K. VIP21/caveolin is a cholesterol-binding protein. Proc Natl Acad Sci USA. 1995;92:10339–10343. doi: 10.1073/pnas.92.22.10339. [DOI] [PMC free article] [PubMed] [Google Scholar]
- Nomura R, Inuo C, Takahashi Y, Asano T, Fujimoto T. Two-dimensional distribution of Gi2α in the plasma membrane: a critical evaluation by immunocytochemistry. FEBS Lett. 1997;415:139–144. doi: 10.1016/s0014-5793(97)01114-9. [DOI] [PubMed] [Google Scholar]
- Parton RG. Caveolae and caveolins. Curr Opin Cell Biol. 1996;8:542–548. doi: 10.1016/s0955-0674(96)80033-0. [DOI] [PubMed] [Google Scholar]
- Parton RG, Joggerst B, Simons K. Regulated internalization of caveolae. J Cell Biol. 1994;127:1199–1215. doi: 10.1083/jcb.127.5.1199. [DOI] [PMC free article] [PubMed] [Google Scholar]
- Pozzan T, Rizzuto R, Volpe P, Meldolesi J. Molecular and cellular physiology of intracellular calcium stores. Physiol Rev. 1994;74:595–636. doi: 10.1152/physrev.1994.74.3.595. [DOI] [PubMed] [Google Scholar]
- Rothberg KG, Heuser JE, Donzell WC, Ying YS, Glenney JR, Anderson RGW. Caveolin, a protein component of caveolae membrane coats. Cell. 1992;68:673–682. doi: 10.1016/0092-8674(92)90143-z. [DOI] [PubMed] [Google Scholar]
- Sargiacomo M, Scherer PE, Tang Z, Kubler E, Song KS, Sanders MC, Lisanti MP. Oligomeric structure of caveolin: implications for caveolae membrane organization. Proc Natl Acad Sci USA. 1995;92:9407–9411. doi: 10.1073/pnas.92.20.9407. [DOI] [PMC free article] [PubMed] [Google Scholar]
- Sargiacomo M, Sudol M, Tang Z, Lisanti MP. Signal transducing molecules and glycosyl-phosphatidylinositol-linked proteins form a caveolin-rich insoluble complex in MDCK cells. J Cell Biol. 1993;122:789–807. doi: 10.1083/jcb.122.4.789. [DOI] [PMC free article] [PubMed] [Google Scholar]
- Scherer PE, Tang Z, Chun M, Sargiacomo M, Lodish HF, Lisanti MP. Caveolin isoforms differ in their N-terminal protein sequence and subcellular distribution. Identification and epitope mapping of an isoform-specific monoclonal antibody probe. J Biol Chem. 1995;270:16395–16401. doi: 10.1074/jbc.270.27.16395. [DOI] [PubMed] [Google Scholar]
- Smart EJ, Foster DC, Ying YS, Kamen BA, Anderson RGW. Protein kinase C activators inhibit receptor-mediated potocytosis by preventing internalization of caveolae. J Cell Biol. 1994;124:307–313. doi: 10.1083/jcb.124.3.307. [DOI] [PMC free article] [PubMed] [Google Scholar]
- Smart EJ, Ying Y-S, Donzell WC, Anderson RGW. A role for caveolin in transport of cholesterol from endoplasmic reticulum to plasma membrane. J Biol Chem. 1996;271:29427–29435. doi: 10.1074/jbc.271.46.29427. [DOI] [PubMed] [Google Scholar]
- Tokuyasu KT. Application of cryoultramicrotomy to immunocytochemistry. J Microsc. 1986;143:139–149. doi: 10.1111/j.1365-2818.1986.tb02772.x. [DOI] [PubMed] [Google Scholar]
- Uehara Y, Hori M, Umezawa H. Specific increase in thymidine transport at a permissive temperature in the rat kidney cells infected with srcts-Rous sarcoma virus. Biochem Biophys Res Commun. 1984;30:129–134. doi: 10.1016/s0006-291x(84)80344-7. [DOI] [PubMed] [Google Scholar]
- Vepa S, Scribner WM, Natarajan V. Activation of protein phosphorylation by oxidants in vascular endothelial cells: identification of tyrosine phosphorylation of caveolin. Free Radical Biol & Med. 1997;22:25–35. doi: 10.1016/s0891-5849(96)00241-9. [DOI] [PubMed] [Google Scholar]


