

Abstract
We have studied room-temperature structural and dynamic properties of the p53 DNA-binding domain in both DNA-bound and DNA-free states. A cumulative 55ns of explicit solvent molecular dynamics simulations with the Particle Mesh Ewald treatment of electrostatics were performed. It is found that the mean structures in the production portions of the trajectories agree well with the crystal structure: backbone root-mean squared deviations are in the range of 1.6Å and 2.0Å. In both simulations, noticeable backbone deviations from the crystal structure are observed only in loop L6, due to the lack of crystal packing in the simulations. More deviations are observed in the DNA-free simulation, apparently due to the absence of DNA. Computed backbone B-factor is also in qualitative agreement with the crystal structure. Interestingly little backbone structural change was observed between the mean simulated DNA-bound and DNA-free structures. Notable difference is only observed at the DNA-binding interface. The correlation between native contacts and inactivation mechanisms of tumor mutations is also discussed. In the H2 region, tumor mutations at sites D281, R282, E285, and E286 may weaken five key interactions that stabilize H2, indicating that their inactivation mechanisms may be related to the loss of local structure around H2, which in turn may reduce the overall stability to a measurable amount. In the L2 region, tumor mutations at sites Y163, K164, E171, V173, L194, R249, I251 and E271 are likely to be responsible for the loss of stability in the protein. In addition to apparent DNA contacts that are related to DNA binding, interactions R175/S183, S183/R196, and E198/N235 are highly occupied only in the DNA-bound form, indicating that they are more likely to be responsible for DNA binding.
INTRODUCTION
p53 is a transcription factor that binds to specific DNA sequences1–4 to activate gene expression.5–9 In response to activation of certain oncogenes, it can stop cell cycle, prevent genetic alterations, and induce apoptosis or programmed cell death.10–12 Mutation in the p53 gene is one of the most frequent events in the process of oncogenesis. It is estimated that approximately 50% of human tumors contain mutations in this pivotal gene.13 The in vivo importance of p53 transactivation is underscored by the fact that 95% of all known tumor mutations occur in the DNA-binding domain of the protein.13,14 More interestingly, 75% of these mutations occur as single missense mutations.13,14 Therefore, the oncogenic form of p53 is predominantly a full-length protein with a single amino-acid substitution in its DNA-binding domain. Tumors with inactive p53 mutants are aggressive and often resistant to ionizing radiation and chemotherapy. Clearly, p53 mutants present one of the most important clinical targets for drug intervention of tumors. Many experimental approaches are in progress to develop p53-based therapies.15,16
p53 bears the usual hallmarks of a transcription factor, with an amino-terminal transactivation domain, a DNA-binding domain, and carboxy-terminal tetramerization and regulatory domains. The crystal structure of the DNA-binding domain, solved in 1994, provides a starting point for understanding the nature of mutant p53 (Fig. 1).17 The structure consists of a β-sandwich scaffold and a DNA-binding surface, including a loop-sheet-helix motif (LSH) and two loops (L2 and L3) tethered by a single Zinc atom. The loops and the LSH motif form the DNA-binding surface of p53 and provide contacts to the DNA backbone and bases.
Figure 1.
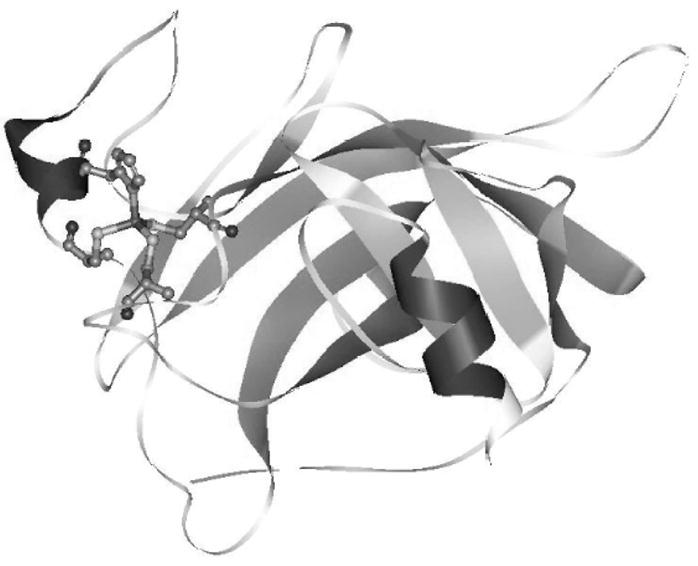
Ribbon representation of chain B of 1TSR with the Zinc interface.
Due to the large number of mutations occurring at the p53 DNA-binding domain, it is instructive to classify these mutations based on their locations for better understanding of their effects for drug intervention. It appears that 30% of all mutations fall on six mutation hot spots, and these hot spots cluster to the DNA-binding surface: two contact DNA directly, R248 (L3) and R273 (LSH), and four stabilize the surrounding structure, R175 (L2), G245 (L3), R249 (L3) and R282 (LSH).17 These give rise to two classes of mutations, DNA-contact and structural. At the physiological condition, all six hot spots fail to bind target DNA sequences. Further classifications of mutants are possible after considering their thermodynamic properties. Overall, three broad phenotypes are proposed: DNA-contact mutations that have little or no effect on stability, mutations that disrupt local structure, and mutations that cause denaturation.17,18 To date only a small fraction of tumor mutations are analyzed by experimental methods. The inactivation mechanisms of many tumor mutations are still unknown.17,18
This article reports our effort in the computational analysis of this important protein. Specifically, molecular dynamics simulations in explicit solvent have been used to study the dynamic properties of the wild type protein to infer the inactivation mechanisms of tumor mutations.
METHODS
There are two computational difficulties in molecular dynamics simulations of the p53 DNA-binding domain (core domain, p53c). The first difficulty is its large size: a monomer p53c is already around 50Å in diameter, but p53 functions as a tetramer in cell. Simulation of the complete tetramer p53c in explicit water would be extremely difficult considering the number of water molecules needed to solvate the protein. Fortunately, it has been shown that the monomer p53c still binds to DNA, though weaker.19 This indicates that the monomer p53c can be used a model to study this important interaction. Further, all existing biophysical analysis of the wild type and mutants of p53c show that the monomer p53c is stable in vitro, so that the monomer model is also suitable for its stability analysis.18
The second difficulty is accurate modeling of the Zinc-binding interface in p53c. Previous experiments with metal chelators showed that p53 depends upon the coordination of Zinc for both correct folding and correct binding to specific DNA in intact cells, especially for binding in the DNA minor groove.21,22 Therefore the Zinc-binding interface is important for simulation of p53c and cannot be neglected. Two approaches have been developed for modeling Zinc coordination interfaces in proteins. The non-bonded approach uses electrostatic and van der Waals interactions to maintain four-ligand or five-ligand coordinations of Zinc in proteins.23–26 It is suitable to simulate proteins in which Zinc is required for catalytic function, though it is quite challenging to maintain the interface stability at room temperature during long-time simulations. The bonded approach uses covalent bonds between Zinc and its coordinating ligands to maintain desired geometries.27–29 The advantage of the bonded approach is that it is easier to preserve desired geometries as in crystal structures and maintain stability at room temperature by choosing suitable bond and angle parameters. The disadvantage of this approach is that it cannot model bond breaking between Zinc and ligands. In this study the bonded approach is chosen in our computational simulations of p53c.
Quantum mechanical analysis of the Zinc interface
The Zinc interface in p53c, [Zn(CYS)3(HIS)1], is chopped out from the crystal structure 1TSR B (Fig. 1). To minimize perturbation to the interface, four main chain Cα atoms are included in the model compound for optimization of force field parameters. Since there is no hydrogen in the crystal structure to determine the total charge, all possible net charges, 2, 1, 0 and −1, −2, are investigated (Table 1).
Table 1.
Possible total charges (a. u.) and their corresponding total energies (Hartree).
| Total charge | +2 | +1 | 0 | −1 | −2 |
|---|---|---|---|---|---|
| HIS | 0 | 0 | 0 | 0 | −1 |
| CYS | 0 | 0 | 0 | −1 | −1 |
| CYS | 0 | 0 | −1 | −1 | −1 |
| CYS | 0 | −1 | −1 | −1 | −1 |
| Total energy | −3518.046193 | −3517.767790 | −3517.386853 | −3516.865598 | −3516.231373 |
The geometries of all tested protonation states were optimized with tight option using rational function optimization (RFO) method.30 After the RFO method, direct inversion in the iterative subspace (GDIIS)31,32 was used to reach a minimum. B3LYP density functional method33,34 with the 6-311+G** basis set was employed in the optimization. Finally B3LYP/6-311+G** was chosen for frequency analysis because it was reported to be successful in reproducing the hydration energy of Zinc divalent cation35,36 and in studying the farnesyltransferase inhibitors.37 A scaling factor 0.989 was used for frequency calculation with the basis set 6-311+G**.38 B3LYP/6-311+G** was also used to obtain ESP potential39–41 in the atomic charge derivation. All quantum mechanical calculations were performed using Gaussian03(G03)42 at NCSA. It is found that only the protonation state with −1 net charge keeps the Zinc interface structure intact. The structures with net charges of 2, 1, 0 and −2 lose the tetrahedral structure after 20 steps of optimization. The final optimized structure of −1 charge is shown in Fig. 2. Interestingly, the same protonation state with three thiolate cystine residues coordinated with Zinc were found to facilitate the fourth thiolate cyctine residue to be a chemically active nucleophilic species in the methyl transfer reactions.20
Figure 2.
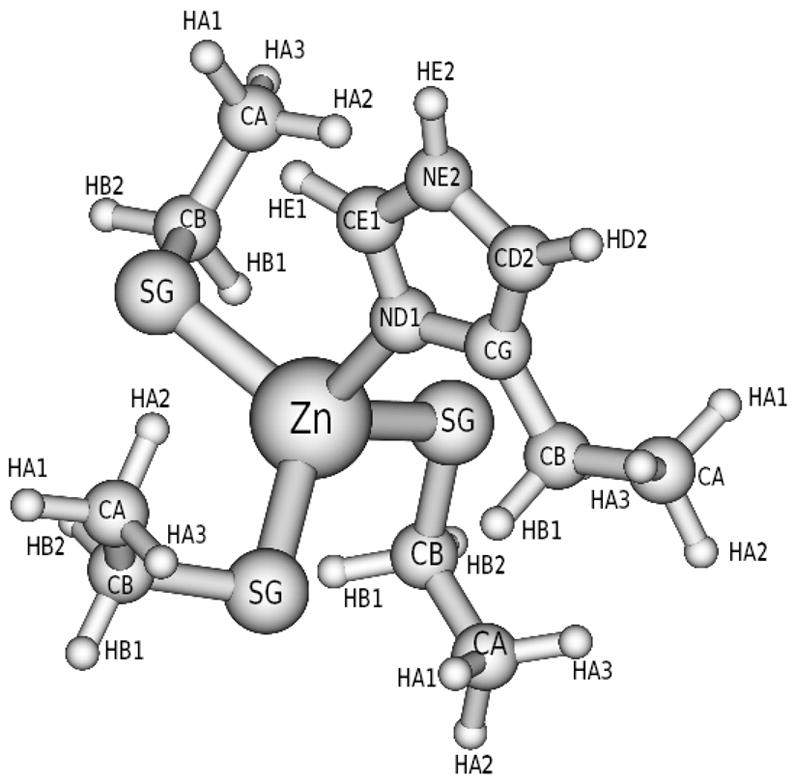
Optimized Zinc interface [Zn(CYS)3(HIS)1] in B3LYP/6-311+G**.
Molecular mechanics analysis of the Zinc interface
Molecular mechanical optimizations were performed with NMODE43 in Amber944 in order to obtain normal mode frequencies. The initial geometry is the optimized structure from G03.42 The Newton-Raphson method was applied to locate the minimum. The convergence criterion is 10−6 kcal/mol-Å.
Two bonds and five angle parameters for the Zinc four-ligand coordination interface in p53c [Zn(CYS)3(HIS)1] were empirically optimized based on the comparison of frequencies between Amber and G03. We have set all Zinc-related dihedral terms to zero to simplify parameterization. The van der Walls parameters for the Zinc atom were taken from the literature: σ = 1.10Å and ε = 0.0125kcal/mol.45 RESP charges46–48 were derived from the G03 ESP potential with ANTECHAMBER in Amber9.44 Partial charges of CYS (CA, −0.0396; HA1, −0.002; HA2, −0.002; HA3, −0.002; CB, 0.2061; HB1, −0.0231; HB2, −0.0231; SG, −0.7380) and partial charges of HIS (CA, −0.1523; HA1, 0.0249; HA2, 0.0249; HA3, 0.0249; CB, 0.0693; HB1, 0.0694; HB2, 0.0694; CG, −0.1183; ND1, −0.0151; ZN, 0.8024; CE1, 0.0741; HE1, 0.0950; NE2, −0.3378; HE2, 0.3347; CD2, −0.1782; HD2, 0.1611) were obtained. The total charge is −1 according to the QM analysis.
Molecular dynamics simulation of DNA-free and DNA-bound p53 core domain
As reviewed, the monomer p53c can bind DNA with approximately one-fifth the affinity of intact p53.19 This gives us an opportunity to study the DNA binding of p53c with a monomer model. In our molecular dynamics simulation, the initial complex structure is derived from the p53c (1TSR chain B) in complex with DNA (5′-TAGACTTGCCCA-3′).17 1TSR chain B is chosen as the initial DNA-free p53c structure to study the difference between DNA-bound and DNA-free structures. Hydrogen atoms were added using LEAP of Amber9.44 In both simulations the solute molecules were solvated in a TIP3P water box with a 10 Å buffer.49 Both systems were neutralized by adding counter ions. The detailed information of the two simulation systems are listed in Table 2.
Table 2.
Information of the p53 and p53 complex MD simulations.
| With DNA | Without DNA | |
|---|---|---|
| Total Atoms | 43058 | 24993 |
| Protein & DNA Residues | 218 | 194 |
| Protein & DNA Atoms | 3769 | 3007 |
| Water Molecules | 13329 | 7328 |
| Counter Ions | 22 Na+ | 2 Cl− |
A revised parm99 force field was used for intramolecular interactions.50,51 Particle Mesh Ewald was used to treat long-range electrostatics with the default setting in Amber9.52 All bonds involving hydrogens were constrained by SHAKE,53 so that a time step of 2fs was used for dynamics integration. Before simulation, the initial coordinates were relaxed by 1000 steps steepest-descent energy minimization. After minimization the two systems were heated up to 80K in order to adjust the water configurations, while the backbone atoms of protein and DNA were restrained by weak harmonic forces. Finally the systems were heated up to 293K within 20ps. In the complex simulation, the backbone of DNA was weakly restrained by a weak force of 1kcal/mol-Å2 throughout the simulation because it is truncated. Constant temperature (293K) and constant pressure (1 bar) were maintained by the Berendsen’s method.54 A total of 55ns trajectories at 293K were collected for both systems.
RESULTS AND DISCUSSION
Quality of covalent force field terms
Projections of normal modes onto internal coordinates agree well between G03 and Amber. The distributions of normal modes over Zinc-related bonds and angles are listed in Supporting Material (Fig. S-1). Note that variation of Zinc-related parameters only influences normal modes less than 500 cm−1.
Table 3 lists all optimized force parameters of Zinc-related bonds and angles. Literature values mainly come from Human Carbonic Anhydrase II (3HIS, 1H2O)27,28 and Alcohol Dehydrogenase (2CYS, 1HIS, 1H2O).55 NA-ZN bond force constant, 40 kcal/mol-Å2, comes from experimental data.56–58
Table 3.
Empirically optimized force constants for ZN related bonds and angles.
Similar structures are obtained by Amber and G03 minimization as shown in Fig. 3. After parameterization, comparison of frequencies over normal modes is performed and shown in Fig. 4. Frequencies from 0 to 500cm−1 correspond to the Zinc-related covalent terms, whose RMSD is 14.4cm−1 between G03 and Amber. The RMSD is 34.50cm−1 for frequencies below 1,000 cm−1. Overall an excellent agreement can be observed between Amber and G03.
Figure 3.
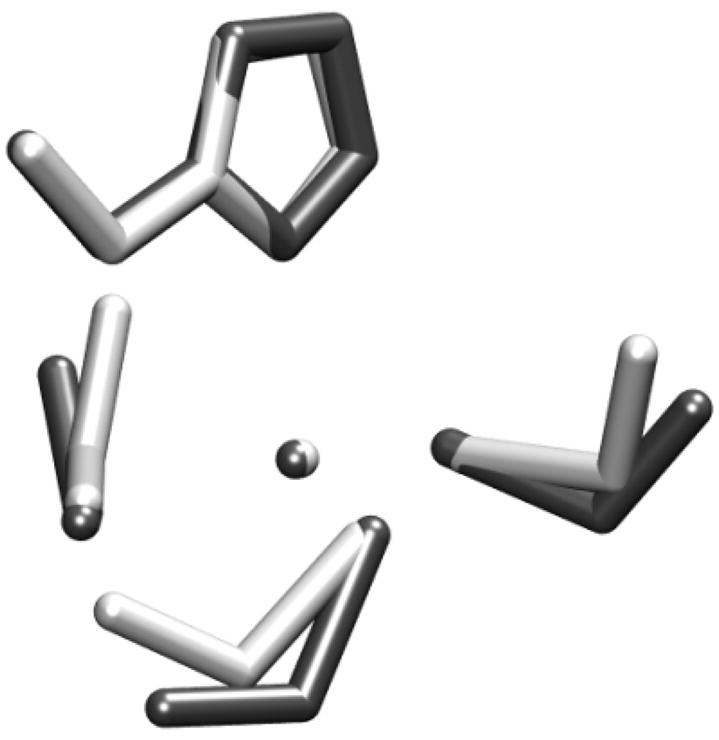
Superposition of optimized Zinc-binding interface structure between Amber and Gaussian. Black is for Gaussian and white is for Amber. Root mean square deviation for all heavy atoms is 0.94 Å.
Figure 4.
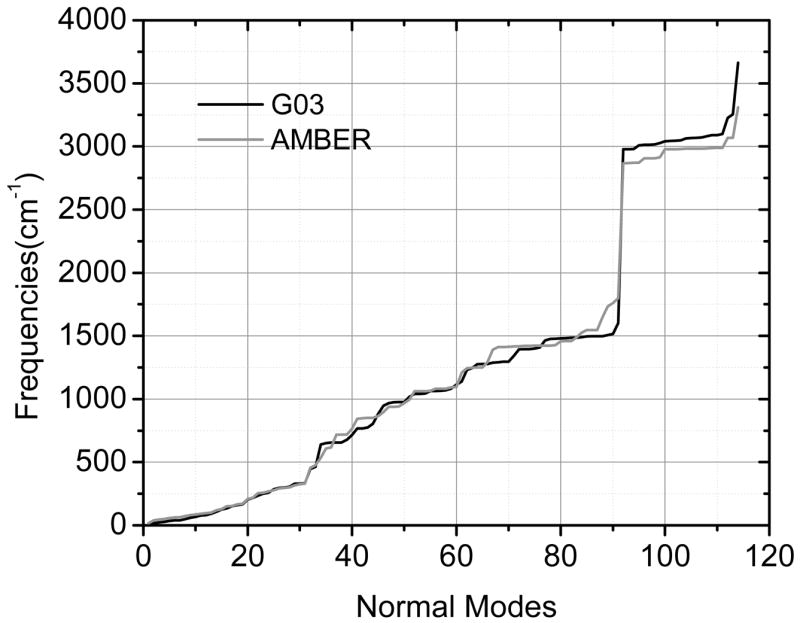
Comparison of normal mode frequencies of the Zinc interface between Gaussian and Amber.
Agreement between simulation and crystal structures
Molecular dynamics simulations of both DNA-bound and DNA-free proteins were run up to 30ns and 25ns, respectively. Their accumulate average potential energies show that the DNA-bound trajectory has equilibrated after 22.5ns and the DNA-free trajectory has equilibrated after 5ns, respectively (Fig. 5). Stable structures are observed in both trajectories, as reflected in their backbone RMSD fluctuations (Fig. 6a).
Figure 5.
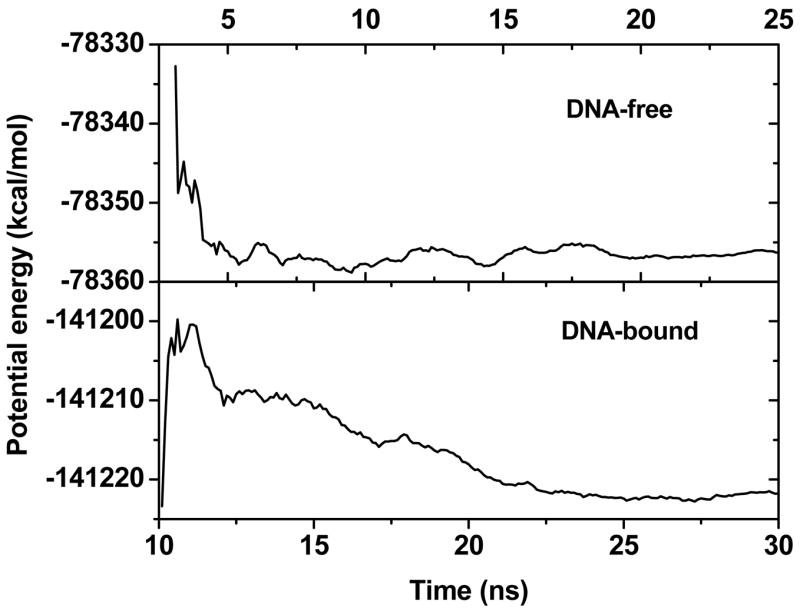
Cumulative average potential energies for DNA-free and DNA-bound p53c. The moving window is 1ns.
Figure 6.
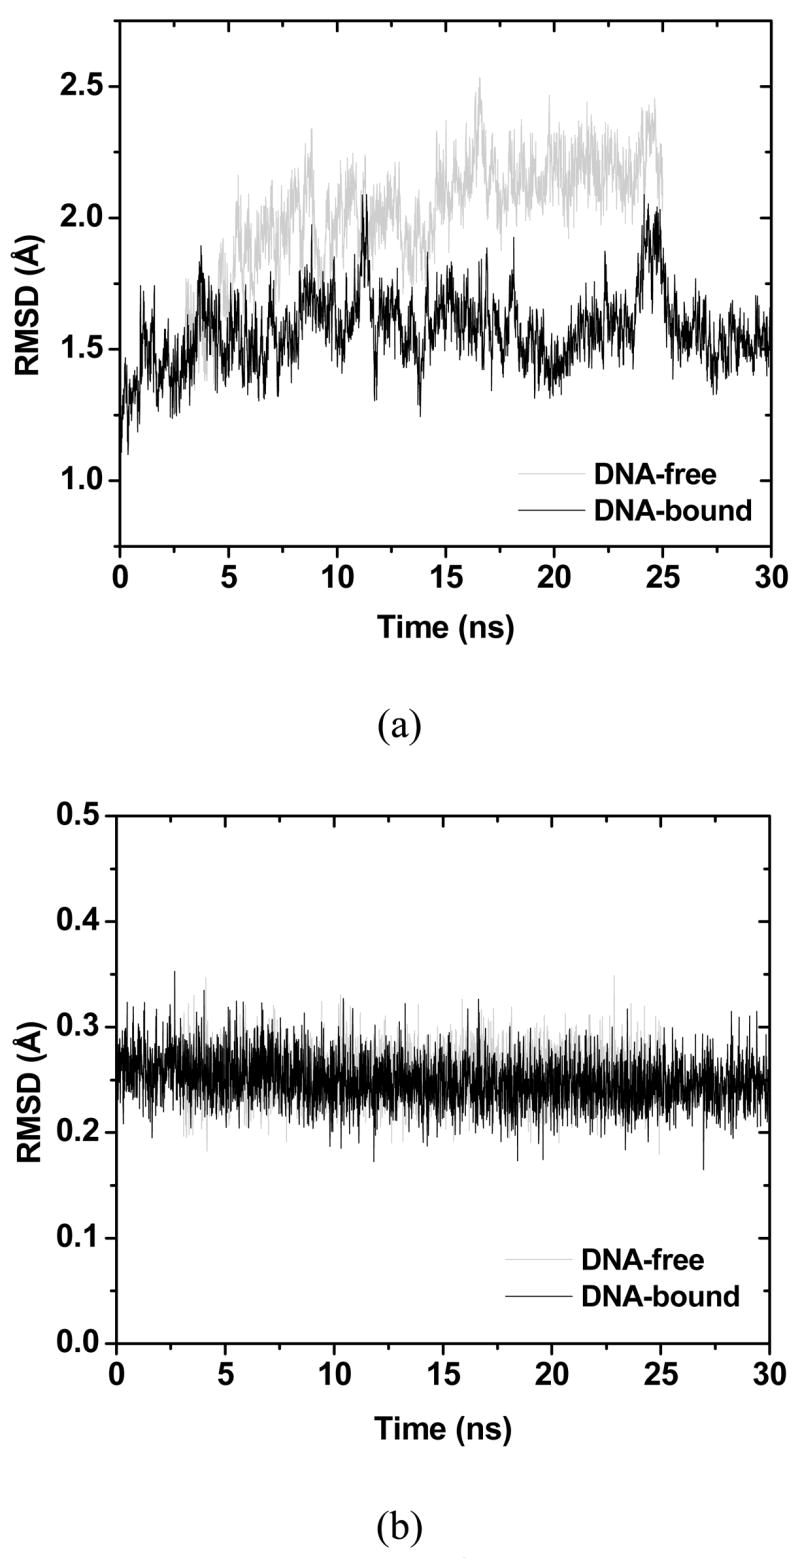
(a) The black and grey lines are backbone RMSD of all the residues of DNA-bound and DNA-free simulations respectively. (b) The black and grey lines are RMSD of the five atoms (ZN, 3S, N) at the Zinc-binding interface.
The backbone RMSD, including all loop residues, of the DNA-bound protein with respect to chain B of 1TSR (the one in complex with DNA) is about 1.6Å (Fig. 6a). While the backbone RMSD of the DNA-free protein is around 2.0Å (Fig. 6a), which is higher than that of the complex, apparently due to the absence of binding to DNA. The mean structures in the production portion of the trajectories (7.5ns for DNA-bound and 20ns for DNA-free) also agree with chain B of 1TSR well: the backbone RMSD of the DNA-bound and DNA-free proteins is 1.61Å and 2.07Å, respectively (Fig. 7). This should be compared with the RMSD differences among the three chains in 1TSR, around 0.85Å. Considering that the simulations were performed at room temperature and without crystal packing, the agreement between simulation and experiment is very good. In both simulations, noticeable backbone deviations from the crystal structure are observed only in loop L6. This is due to the lack of crystal packing in the monomer simulations. In the DNA-free simulation, deviations are also observed in L1, H1, and L5′, apparently due to the absence of DNA. In Fig. 7 one can find that the L1 DNA-binding interface has noticeably deformed in the DNA-free simulation.
Figure 7.
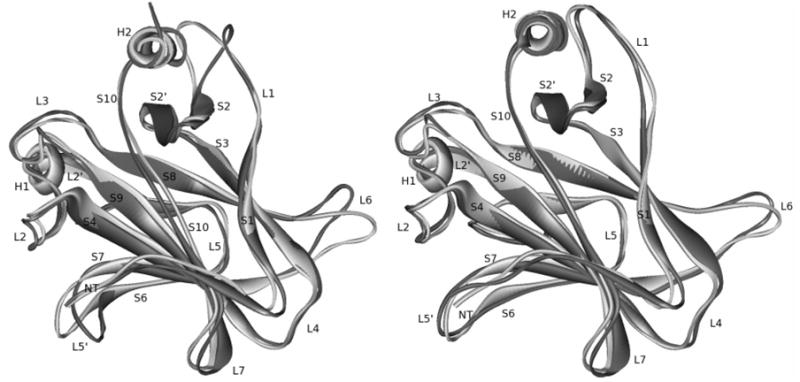
Superposition of mean simulated structures and 1TSR B chain. Right: DNA-free p53c; left: DNA-bound p53c. Gray: crystal; black: simulation.
Computed backbone B-factor of the DNA-bound protein is in qualitative agreement with that of chain B in 1TSR (Fig. 8). Major differences between simulation and experiment are all due to the existence of crystal packing with other chains in 1TSR (Fig. 8). Interestingly, computed backbone B-factor of the DNA-free protein agrees better with chain A that does not have specific DNA contacts (Fig. 9). This indicates that chain A might be used as a model of the DNA-free protein for dynamics analysis. However, it should be pointed out that chain A is a less accurate structural model than chain B.
Figure 8.

B-factors for DNA-bound p53c between simulation and crystal structure (chain B). P: for crystal packing position. The four vertical lines mark the four residues at the Zinc-binding interface.
Figure 9.

B-factors for DNA-free p53c between simulation and crystal structure (chain A).
RMSD fluctuation of the heavy atoms at the Zinc interface indicates that the tetrahedron structure is maintained as in 1TSR (Fig. 6b). Further, relative B-factor of the side-chain heavy atoms with respect to those of the backbone heavy atoms show that the bonded model adopted here can reproduce the dynamic properties of the Zinc interface in p53c at least for equilibrium properties at the native state (Table 4).
Table 4.
Ratios of B-factors between side chain and main chain heavy atoms at the Zn interface.
| Residues | Simulation | Crystal |
|---|---|---|
| 176 | 0.947 | 0.949 |
| 179 | 0.994 | 0.944 |
| 238 | 1.355 | 1.231 |
| 242 | 0.888 | 0.940 |
Differences between DNA-bound and DNA-free room-temperature structures
One of our interests is to understand the binding-induced conformational change in p53c at room temperature. As shown in Fig. 7, overall there is little change in the backbone between the mean DNA-bound and DNA-free structures, similar to that observed between crystal structures 1TSR B and A chains at 98K. Notable difference in the backbone is only observed in L1, H1, and L3 at the DNA-binding interface.
A detailed comparison of the arrangement of secondary structures in DNA-bound and DNA-free structures is shown in Fig. 10. The major differences are only observed in places close to the DNA-binding interface. On the H2 side of the binding interface, the only difference is at L1 that moves away from H2 in the DNA-free structure. On the L3 side of the binding interface, L3 is slightly distorted when compared with that in the DNA-bound structure. Another difference is observed in loop L2, a central structure connecting L3 with L2′, H1, NT, L5′, and portion of the β sandwich (Fig. 7). In fact, L2 has most contacts with other secondary structural units in the DNA-binding region (Table 5). In the DNA-bound structure L2 is closer to L2′ and L3, but it is farther away from L5′ and the β sandwich. In addition, the contacts between L2/NT and L5′ are weaker when compared with those in the DNA-free structure (Table 5), corresponding to the observed higher B-factor on NT and L5′ in the complex (Fig. 8). A similar difference on NT and L5′ is also observed in the crystal structure 1TSR. NT is packed well in chain A but not in chain B, and the B-factor of NT is also lower in chain A than in chain B (Fig. 11). These differences indicate that contacts involving L2 may be important to DNA binding even if they are not in direct contact with DNA.
Figure 10.
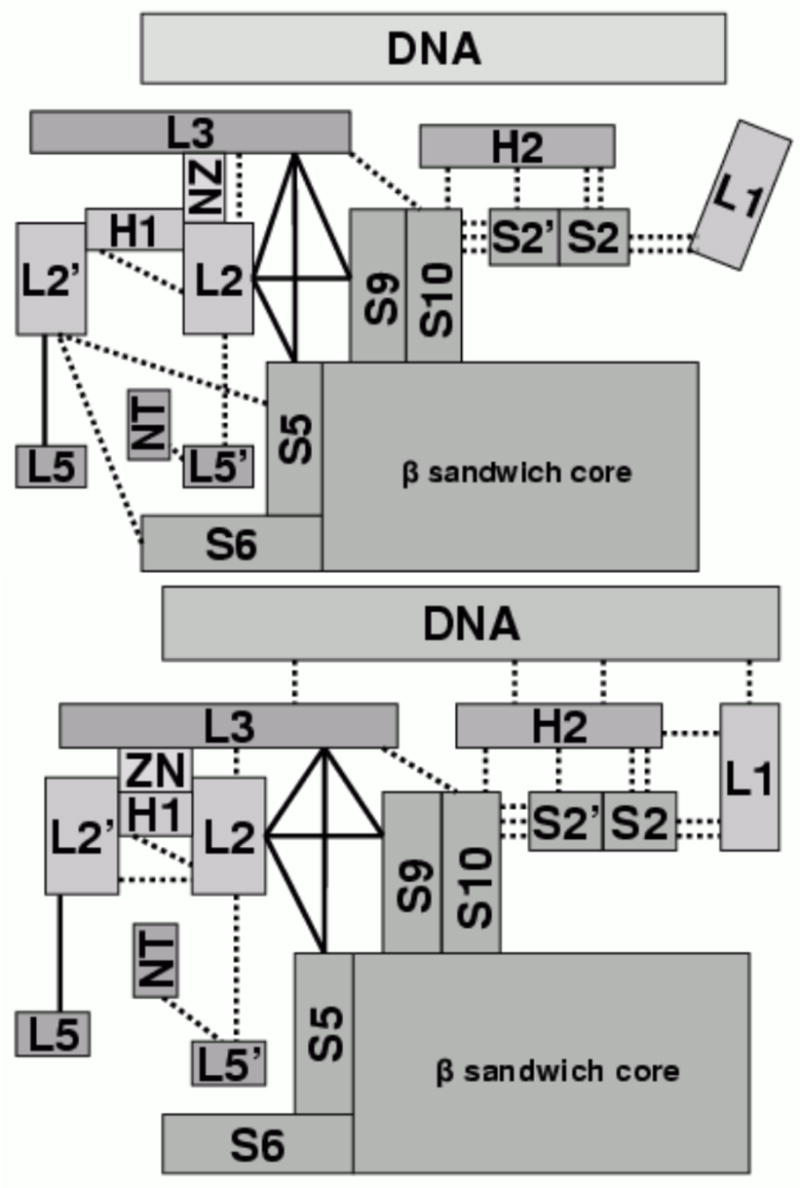
Diagrams of secondary structure interaction networks. Upper: DNA-free; lower: DNA-bound.
Table 5.
Percentage occupancies of native contacts outside the β-sandwich region. The table only lists percentage occupancies that are higher than 50%. w DNA: DNA-bound simulation; w/o DNA: DNA-free simulation; IP: ion pair; HP: hydrophobic pair.
| Secondary Structures | Residues | w/o DNA | w DNA | Type | ||
|---|---|---|---|---|---|---|
| H2 | S2 | E286 | S127 | 97.1 | 98.0 | IP |
| H2 | S2′ | E285 | K132 | 97.1 | 100.0 | IP |
| H2 | S2 | R282 | Y126 | 99.0 | 98.5 | IP |
| H2 | S2 | R282 | T125 | 100.0 | 93.5 | IP |
| H2 | S10 | D281 | R273 | 99.5 | 100.0 | IP |
| L3 | L2 | R249 | E171 | 100.0 | 99.5 | IP |
| L3 | S4 | R249 | Y163 | 99.2 | 95.1 | IP |
| L3 | S5 | M246 | L194 | 74.9 | 99.5 | HP |
| L3 | S9 | M246 | I251 | 100.0 | 100.0 | HP |
| L3 | ZN | G245 | C242 | 97.5 | 92.5 | HB |
| L3 | S10 | S240 | V274 | 99.5 | 97.5 | HB |
| L3 | S3 | M237 | A138 | 99.6 | 100.0 | HP |
| L2′ | S8 | L194 | Y236 | 74.1 | 0.0 | HP |
| L2′ | S6 | P190 | Y205 | 100.0 | 98.4 | HP |
| L2′ | S6 | A189 | Y205 | 100.0 | 100.0 | HP |
| L2′ | S6 | L188 | Y201 | 71.3 | 9.7 | HP |
| L2′ | L5 | L188 | V203 | 53.0 | 92.0 | HP |
| L2′ | S6 | L188 | Y205 | 99.2 | 100.0 | HP |
| L2′ | S5 | D186 | R196 | 88.7 | 1.0 | IP |
| L2′ | S5 | D184 | R196 | 91.5 | 1.0 | IP |
| H1 | S5 | S183 | R196 | 0.0 | 77.3 | IP |
| L2 | L2′ | R175 | S183 | 0.0 | 87.9 | IP |
| L2 | L2′ | R175 | D184 | 100.0 | 0.0 | IP |
| L2 | H1 | R174 | E180 | 100.0 | 1.0 | IP |
| L2 | S4 | V173 | A161 | 99.2 | 65.2 | HP |
| L2 | S4 | V173 | Y163 | 100.0 | 100.0 | HP |
| L2 | S5 | V173 | L194 | 100.0 | 100.0 | HP |
| L2 | S9 | V173 | I251 | 98.7 | 99.2 | HP |
| L2 | L3 | V173 | M246 | 91.5 | 83.0 | HP |
| L2 | L5′ | T170 | R213 | 50.0 | 49.5 | IP |
| L2 | L5′ | M169 | R213 | 98.5 | 1.0 | IP |
| L2 | S4 | M169 | I162 | 64.0 | 97.6 | IP |
| L2 | S10 | K164 | E271 | 100.0 | 98.4 | IP |
| S2′ | S10 | K132 | E271 | 100.0 | 99.2 | IP |
| S2 | S2′ | Y126 | N131 | 100.0 | 100.0 | HB |
| L1 | H2 | T118 | R283 | 27.0 | 100.0 | IP |
| L1 | S2 | G117 | T125 | 100.0 | 79.0 | HB |
| L1 | S2 | S116 | C124 | 100.0 | 42.5 | HB |
| NT | L5′ | V97 | M169 | 91.5 | 43.0 | HP |
Figure 11.

(a) B-factors between DNA-free and DNA-bound simulations. (b) B-factors in crystal structure (chains A and B).
The difference of native contacts between the DNA-bound and DNA-free protein is also compared to understand the binding-induced conformational changes. This gives us the basis for the following analysis related to common tumor mutations. In the DNA-binding region, all side-chain/side-chain or side-chain/main-chain contacts are monitored. Those contacts with percentage occupancies higher than 50% in the DNA-bond structure or the DNA-free structure are listed in Table 5 and Table 6. Comparison between the contacts in the DNA-bound and DNA-free structures reveals many differences. Interestingly, there are ten contacts significantly weakened by binding to DNA (V97/M169, S116/C124, M169/R213, V173/A161, R174/E180, R175/D184, D184/R196, D186/R196, L188/Y201, L194/Y236), but only five contacts are significantly strengthened by binding to DNA (T118/R283, M169/I162, R175/S183, S183/R196, L188/V203) outside the β sandwich (Table 5). In contrast, few differences are found in the β-sandwich region as shown in Table 6. Specifically, four contacts (T140/N235, V143/I255 and E198/H233. I251/V272) are weakened, and two contacts are strengthened (V143/F270 and E198/N235) by DNA binding.
Table 6.
Same as Table 5, but for native contacts inside the β-sandwich region.
| Secondary Structure | Residues | w/o DNA | w DNA | Type | ||
|---|---|---|---|---|---|---|
| S3 | S1 | V143 | L111 | 78.0 | 89.5 | HP |
| S3 | S8 | V143 | Y234 | 94.5 | 68.5 | HP |
| S3 | S9 | V143 | I255 | 66.5 | 4.0 | HP |
| S3 | S10 | V143 | F270 | 45.0 | 93.5 | HP |
| S3 | S7 | V147 | Y220 | 100.0 | 98.5 | HP |
| S4 | S3 | R156 | E258 | 100.0 | 100.0 | IP |
| S4 | S3 | V157 | L145 | 99.5 | 98.0 | HP |
| S4 | S9 | R158 | E258 | 100.0 | 100.0 | IP |
| S5 | S4 | I195 | A161 | 95.0 | 95.0 | HP |
| S5 | S8 | I195 | Y236 | 57.0 | 47.5 | HP |
| S5 | S8 | I195 | Y234 | 94.0 | 99.0 | HP |
| S5 | S8 | E198 | N235 | 0.0 | 99.6 | HB |
| S3 | S8 | T140 | N235 | 53.4 | 0.0 | HB |
| S5 | S3 | E198 | T140 | 97.6 | 100.0 | IP |
| S5 | S8 | E198 | H233 | 84.2 | 0.0 | IP |
| L5 | L6 | R202 | E221 | 91.9 | 92.7 | IP |
| S6 | L5 | Y205 | V203 | 98.0 | 100.0 | HP |
| S6 | S7 | Y205 | V216 | 100.0 | 99.0 | HP |
| S9 | S10 | I251 | V272 | 93.5 | 65.5 | HP |
| S9 | S1 | I255 | F109 | 94.5 | 100.0 | HP |
| S9 | S8 | I255 | Y234 | 100.0 | 100.0 | HP |
| S9 | L4 | L257 | P151 | 99.5 | 99.0 | HP |
Implications to common tumor mutations
A more detailed analysis of the native contacts indicates that there are additional differences between the two room-temperature simulations. These differences may shed lights in understanding the correlation between tumor mutations and DNA binding or folding stability in p53c. In the following, we discuss the correlation of native contacts with inactivation mechanisms of certain tumor mutations in four different regions: β sandwich, H2 region, L2 region, and DNA-binding region.
β sandwich
It is apparent that mutations in the β-sandwich region (hydrophobic core) are more likely to be responsible for the protein’s overall stability: most native contacts are hydrophobic in nature. Instead of analyzing all contacts generically, we have chosen to focus on two centers of the hydrophobic core: I195 and V143. Tumor mutations targeting these two centers can severely destabilize the p53 core domain (mutation I195T and V143A destabilize p53c by 4.12 kcal/mol and 3.50 kcal/mol, respectively).59 I195 forms hydrophobic contacts with A161, Y234, and Y236. None of these change upon DNA binding (Table 6). V143 forms hydrophobic contacts with L111, Y234, I255, and F270 (Table 6). Most of these hydrophobic contacts are also well preserved in both simulations.
H2 Region
The inactivation mechanisms of tumor mutations in other parts of p53c are less clear. Here we have monitored all side-chain contacts to track their occupancies at room-temperature. In the H2 region, tumor mutations at sites D281, R282, E285, and E286 may weaken five key interactions that stabilize H2 (Table 5). Our data indicates that their inactivation mechanism may be related to the loss of local structure around H2, which in turn may reduce the overall stability to a measurable amount. Our analysis on contacts related to H2 is in part supported by the structure and stability data from Fersht and co-workers: mutation R282W affects the packing of Loop-Sheet-Helix,60 and destabilizes p53c by 3.3 kcal/mol.59
L2 Region
In the L2 region, contacts K164/E271, V173/Y163, V173/L194, V173/I251, and R249/E171 are highly occupied in both DNA-bound and DNA-free simulations. Our contact analysis thus implies that mutations at sites Y163, K164, E171, V173, L194, R249, I251 and E271 are likely to be responsible for the loss of stability in p53c. The finding for R249 is in agreement with available structure and stability data from Fersht and co-workers: mutation R249S was found to induce substantial structural perturbation around mutation site in loop L3,61 and to destabilize p53c by 1.92 kcal/mol.59
DNA binding
Many interactions are in direct contact with DNA (Table 7), indicating that they are responsible for DNA binding. Except N239 the results are in agreement with the crystal structure from Cho et al: residue K120, S241, R248, R273, R280, and R283 are direct in contact with DNA.17 In addition, the crystal structure from Fersht and co-workers also shows that R273C and R273H mutations simply remove DNA contacts without perturbing the conformation of nearby residues.60,61
Table 7.
Same as Table 5, but for native contacts with DNA.
| Secondary Structures | Residues | w DNA | Type | ||
|---|---|---|---|---|---|
| L1 | DNA | K120 | G7 | 96.8 | IP |
| L1 | DNA | K120 | G8 | 100.0 | IP |
| L3 | DNA | N239 | G13 | 100.0 | HB |
| L3 | DNA | S241 | T12 | 93.5 | HB |
| L3 | DNA | S241 | G13 | 89.1 | HB |
| L3 | DNA | R248 | T11 | 100.0 | IP |
| L3 | DNA | R248 | T12 | 81.4 | IP |
| L3 | DNA | R248 | T26 | 100.0 | IP |
| L3 | DNA | R248 | G25 | 65.2 | IP |
| S10 | DNA | R273 | T12 | 100.0 | IP |
| H2 | DNA | R280 | G13 | 100.0 | IP |
| H2 | DNA | R283 | G19 | 100.0 | IP |
In addition to apparent DNA contacts that are related to DNA binding, many interactions are highly occupied only in the DNA-bound form, indicating that they are more likely to be responsible for DNA binding. Three such contacts that are not in direct contact with DNA are found: R175/S183, S183/R196 (Table 5), and E198/N235 (Table 6).
CONCLUDING REMARKS
With optimized force field parameters for the Zinc-binding interface of p53c, a cumulative 55ns of room-temperature molecular dynamics simulations in explicit solvent with the PME treatment of electrostatics were performed for both DNA-bound and DNA-free p53c. It is found that the backbone RMSDs, including all loop residues, of both DNA-bound and DNA-free p53c with respect to chain B in 1TSR are from 1.6Å to 2.0Å. The mean structures in the production portions of the trajectories also agree with chain B of 1TSR well. In both simulations, noticeable backbone deviations from the crystal structure are observed only in loop L6. This is due to the lack of crystal packing in both simulations. In the DNA-free simulation, deviations are also observed in L1, H1, and L5′, apparently due to the absence of DNA. Computed backbone B-factor of the DNA-bound protein is also in qualitative agreement with that of chain B in 1TSR. Major differences between simulation and experiment are due to the existence of crystal packing with other chains in 1TSR. RMSD fluctuation of the heavy atoms at the Zinc-binding interface indicates that the tetrahedron structure is maintained as in 1TSR. Relative B-factor of the side-chain heavy atoms with respect to those of the backbone heavy atoms at the Zinc-binding interface also agrees well between simulation and crystal structures, indicating that the bonded model adopted here may reproduce equilibrium dynamic properties of the Zinc-binding interface in p53c.
Our room-temperature simulation shows little backbone change between the mean DNA-bound and DNA-free structures, similar to that observed between crystal structures 1TSR B and A chains at 98K. Notable difference in the backbone is only observed on the DNA-binding interface. On the H2 side of the binding interface, the only difference is L1 that moves away from H2 in the DNA-free structure. On the L3 side of the binding interface, L3 is slightly distorted when compared with that in the DNA-bound structure. Another difference is observed in loop L2. In the DNA-bound structure L2 is closer to L2′ and L3, but it is farther away from L5′ and the β sandwich. In addition, the contacts between L2/NT and L5 are weaker when compared with those in the DNA-free structure, corresponding to the observed higher B-factor on NT and L5′ in the complex. A similar difference on NT and L5′ is also observed in the crystal structure 1TSR. NT is packed well in chain A but not in chain B, and the B-factor of NT is also lower in chain A than in chain B. These differences indicate that contacts that involve L2 may be important to DNA-binding even if they are not in direct contact with DNA.
The correlation between native contacts and inactivation mechanisms of certain tumor mutations is also discussed. It is apparent that mutations in the β-sandwich region (hydrophobic core) are more likely to be responsible for the protein’s overall stability: most native contacts are hydrophobic in nature. The inactivation mechanisms of tumor mutations in other parts of p53c are less clear. Here we have monitored all side-chain contacts to track their occupancies at room-temperature. In the H2 region, tumor mutations at sites D281, R282, E285, and E286 may weaken five key interactions that stabilize H2. Our data indicates that their inactivation mechanism may be related to the loss of local structure around H2.
In the L2 region, contacts K164/E271, V173/Y163, V173/L194, V173/I251, and R249/E171 are highly occupied in both DNA-bound and DNA-free simulations. Our contact analysis thus implies that mutations at sites Y163, K164, E171, V173, L194, R249, I251 and E271 are likely to be responsible for the loss of stability in p53c.
Many interactions are in direct contact with DNA, indicating that they are responsible for DNA binding. In addition to apparent DNA contacts that are related to DNA binding, many interactions are highly occupied only in the DNA-bound form, indicating that they are more likely to be responsible for DNA binding. Three such contacts that are not in direct contact with DNA are found: R175/S183, S183/R196, and E198/N235.
Supplementary Material
Figure S-1. Projections of normal modes onto Zinc-related bonds and angles between Gaussian (G03) and AMBER.
Acknowledgments
This work is supported in part by NIH (GM069620) and the State of California (CRCC).
References
- 1.Bargonetti J, Friedman PN, Kern SE, Vogelstein B, Prives C. Cell. 1991;65:1083. doi: 10.1016/0092-8674(91)90560-l. [DOI] [PubMed] [Google Scholar]
- 2.Kern SE, Kinzler KW, Bruskin A, Jarosz D, Friedman P, Prives C, Vogelstein B. Science. 1991;252:1708. doi: 10.1126/science.2047879. [DOI] [PubMed] [Google Scholar]
- 3.Funk WD, Pak DT, Karas RH, Wright WE, Shay JW. Molecular and Cellular Biology. 1992;12:2866. doi: 10.1128/mcb.12.6.2866. [DOI] [PMC free article] [PubMed] [Google Scholar]
- 4.Eldeiry WS, Kern SE, Pietenpol JA, Kinzler KW, Vogelstein B. Nature Genetics. 1992;1:45. doi: 10.1038/ng0492-45. [DOI] [PubMed] [Google Scholar]
- 5.Fields S, Jang SK. Science. 1990;249:1046. doi: 10.1126/science.2144363. [DOI] [PubMed] [Google Scholar]
- 6.Raycroft L, Wu H, Lozano G. Science. 1990;249:1049. doi: 10.1126/science.2144364. [DOI] [PMC free article] [PubMed] [Google Scholar]
- 7.Farmer G, Bargonetti J, Zhu H, Friedman P, Prywes R, Prives C. Nature. 1992;358:83. doi: 10.1038/358083a0. [DOI] [PubMed] [Google Scholar]
- 8.Kern SE, Pietenpol JA, Thiagalingam S, Seymour A, Kinzler KW, Vogelstein B. Science. 1992;256:827. doi: 10.1126/science.1589764. [DOI] [PubMed] [Google Scholar]
- 9.Unger T, Nau MM, Segal S, Minna JD. Embo Journal. 1992;11:1383. doi: 10.1002/j.1460-2075.1992.tb05183.x. [DOI] [PMC free article] [PubMed] [Google Scholar]
- 10.Harris CC. Journal of the National Cancer Institute. 1996;88:1442. doi: 10.1093/jnci/88.20.1442. [DOI] [PubMed] [Google Scholar]
- 11.Ko LJ, Prives C. Genes & Development. 1996;10:1054. doi: 10.1101/gad.10.9.1054. [DOI] [PubMed] [Google Scholar]
- 12.Prives C, Hall PA. Journal of Pathology. 1999;187:112. doi: 10.1002/(SICI)1096-9896(199901)187:1<112::AID-PATH250>3.0.CO;2-3. [DOI] [PubMed] [Google Scholar]
- 13.Martin ACR, Facchiano AM, Cuff AL, Hernandez-Boussard T, Olivier M, Hainaut P, Thornton JM. Human Mutation. 2002;19:149. doi: 10.1002/humu.10032. [DOI] [PubMed] [Google Scholar]
- 14.Olivier M, Eeles R, Hollstein M, Khan MA, Harris CC, Hainaut P. Human Mutation. 2002;19:607. doi: 10.1002/humu.10081. [DOI] [PubMed] [Google Scholar]
- 15.Nikolova PV, Wong KB, DeDecker B, Henckel J, Fersht AR. Embo Journal. 2000;19:370. doi: 10.1093/emboj/19.3.370. [DOI] [PMC free article] [PubMed] [Google Scholar]
- 16.Hupp TR, Sparks A, Lane DP. Cell. 1995;83:237. doi: 10.1016/0092-8674(95)90165-5. [DOI] [PubMed] [Google Scholar]
- 17.Cho YJ, Gorina S, Jeffrey PD, Pavletich NP. Science. 1994;265:346. doi: 10.1126/science.8023157. [DOI] [PubMed] [Google Scholar]
- 18.Bullock AN, Fersh AR. Nature Reviews Cancer. 2001;1:68. doi: 10.1038/35094077. [DOI] [PubMed] [Google Scholar]
- 19.Pavletich NP, Chambers KA, Pabo CO. Genes & Development. 1993;7:2556. doi: 10.1101/gad.7.12b.2556. [DOI] [PubMed] [Google Scholar]
- 20.Min DH, Liu YS, Carbone I, Yang W. Journal of Chemical Physics. 2007;126 doi: 10.1063/1.2731769. [DOI] [PubMed] [Google Scholar]
- 21.Hainaut P, Mann K. Antioxidants & Redox Signaling. 2001;3:611. doi: 10.1089/15230860152542961. [DOI] [PubMed] [Google Scholar]
- 22.Meplan C, Richard MJ, Hainaut P. Biochemical Pharmacology. 2000;59:25. doi: 10.1016/s0006-2952(99)00297-x. [DOI] [PubMed] [Google Scholar]
- 23.Vedani A, Huhta DW. Journal of the American Chemical Society. 1990;112:4759. [Google Scholar]
- 24.Aqvist J, Warshel A. Journal of the American Chemical Society. 1990;112:2860. [Google Scholar]
- 25.Stote RH, Karplus M. Proteins-Structure Function and Genetics. 1995;23:12. doi: 10.1002/prot.340230104. [DOI] [PubMed] [Google Scholar]
- 26.Wasserman ZR, Hodge CN. Proteins-Structure Function and Genetics. 1996;24:227. doi: 10.1002/(SICI)1097-0134(199602)24:2<227::AID-PROT9>3.0.CO;2-F. [DOI] [PubMed] [Google Scholar]
- 27.Hoops SC, Anderson KW, Merz KM. Journal of the American Chemical Society. 1991;113:8262. [Google Scholar]
- 28.Lu DS, Voth GA. Proteins-Structure Function and Genetics. 1998;33:119. [PubMed] [Google Scholar]
- 29.Pang YP. Journal of Molecular Modeling. 1999;5:196. [Google Scholar]
- 30.Simons J, Jorgensen P, Taylor H, Ozment J. Journal of Physical Chemistry. 1983;87:2745. [Google Scholar]
- 31.Csaszar P, Pulay P. Journal of Molecular Structure. 1984;114:31. [Google Scholar]
- 32.Farkas O, Schlegel HB. Journal of Chemical Physics. 1999;111:10806. [Google Scholar]
- 33.Lee CT, Yang WT, Parr RG. Physical Review B. 1988;37:785. doi: 10.1103/physrevb.37.785. [DOI] [PubMed] [Google Scholar]
- 34.Becke AD. Journal of Chemical Physics. 1993;98:5648. [Google Scholar]
- 35.Hehre WJ, Radom L, Schleyer PVR, Pople J. Ab initio molecular orbital theory. New York: 1986. [Google Scholar]
- 36.Pavlov M, Siegbahn PEM, Sandstrom M. Journal of Physical Chemistry A. 1998;102:219. [Google Scholar]
- 37.Pang YP, Xu K, Yazal JE, Prendergast FG. Protein Science. 2000;9:2583. [PMC free article] [PubMed] [Google Scholar]
- 38.Foresman AFJB. Exploring Chemistry with Electronic Structure Methods. 2. Gaussian; 1996. [Google Scholar]
- 39.Momany FA. Journal of Physical Chemistry. 1978;82:592. [Google Scholar]
- 40.Cox SR, Williams DE. Journal of Computational Chemistry. 1981;2:304. [Google Scholar]
- 41.Singh UC, Kollman PA. Journal of Computational Chemistry. 1984;5:129. [Google Scholar]
- 42.Frisch MJ, Trucks GW, Schlegel HB, Scuseria GE, Robb MA, Cheeseman JR, Montgomery JA, TVreven J, Kudin KN, Burant JC, Millam JM, Iyengar SS, Tomasi J, et al. Gaussian 03. 2003 [Google Scholar]
- 43.Kottalam J, Case DA. Biopolymers. 1990;29:1409. doi: 10.1002/bip.360291008. [DOI] [PubMed] [Google Scholar]
- 44.Case DA, Darden TA, Cheatham TEI, Simmerling CL, Wang J, Duke RE, Luo R, Merz KM, Pearlman DA, Crowley M, Walker RC, Zhang W, Wang B, Hayik S, Roitberg A, Seabra G, Wong FK, Paesani F, Wu X, Brozell S, Tsui V, Gohlke H, Yang L, Tan C, Mongan J, Hornak V, Cui G, Beroza P, Mathews DH, Schafmeister C, Ross WS, Kollman aPA. AMBER 9. 2006 [Google Scholar]
- 45.Merz KM. Journal of the American Chemical Society. 1991;113:406. [Google Scholar]
- 46.Bayly CI, Cieplak P, Cornell WD, Kollman PA. Journal of Physical Chemistry. 1993;97:10269. [Google Scholar]
- 47.Cornell WD, Cieplak P, Bayly CI, Kollman PA. Journal of the American Chemical Society. 1993;115:9620. [Google Scholar]
- 48.Cieplak P, Cornell WD, Bayly C, Kollman PA. Journal of Computational Chemistry. 1995;16:1357. [Google Scholar]
- 49.Jorgensen WL, Chandrasekhar J, Madura JD, Impey RW, Klein ML. Journal of Chemical Physics. 1983;79:926. [Google Scholar]
- 50.Wang JM, Cieplak P, Kollman PA. Journal of Computational Chemistry. 2000;21:1049. [Google Scholar]
- 51.Lwin TZ, Luo R. Protein Science. 2006;15:2642. doi: 10.1110/ps.062438006. [DOI] [PMC free article] [PubMed] [Google Scholar]
- 52.Darden T, York D, Pedersen L. Journal of Chemical Physics. 1993;98:10089. [Google Scholar]
- 53.Ryckaert JP, Ciccotti G, Berendsen HJC. Journal of Computational Physics. 1977;23:327. [Google Scholar]
- 54.Berendsen HJC, Postma JPM, Vangunsteren WF, Dinola A, Haak JR. Journal of Chemical Physics. 1984;81:3684. [Google Scholar]
- 55.Ryde U. Proteins-Structure Function and Genetics. 1995;21:40. doi: 10.1002/prot.340210106. [DOI] [PubMed] [Google Scholar]
- 56.Nakamoto K, Takemoto J, Chow TL. Applied Spectroscopy. 1971;25:352. [Google Scholar]
- 57.Sacconi L, Gans P, Sabatini A. Inorganic Chemistry. 1964;3:1772. [Google Scholar]
- 58.Nakamoto K. Infrared and Raman Spectra of Inorganic and Coordination Compounds. New Youk: 1978. [Google Scholar]
- 59.Bullock AN, Henckel J, Fersht AR. Oncogene. 2000;19:1245. doi: 10.1038/sj.onc.1203434. [DOI] [PubMed] [Google Scholar]
- 60.Joerger AC, Ang HC, Fersht AR. Proceedings of the National Academy of Sciences of the United States of America. 2006;103:15056. doi: 10.1073/pnas.0607286103. [DOI] [PMC free article] [PubMed] [Google Scholar]
- 61.Joerger AC, Ang HC, Veprintsev DB, Blair CM, Fersht AR. Journal of Biological Chemistry. 2005;280:16030. doi: 10.1074/jbc.M500179200. [DOI] [PubMed] [Google Scholar]
Associated Data
This section collects any data citations, data availability statements, or supplementary materials included in this article.
Supplementary Materials
Figure S-1. Projections of normal modes onto Zinc-related bonds and angles between Gaussian (G03) and AMBER.