

Abstract
Electron transfer dissociation (ETD) delivers the unique attributes of electron capture dissociation (ECD) to mass spectrometers that utilize radio frequency (RF) trapping-type devices (e.g., quadrupole ion traps). The method has generated significant interest because of its compatibility with chromatography and its ability to: (1) preserve traditionally labile post-translational modifications (PTMs) and (2) randomly cleave the backbone bonds of highly charged peptide and protein precursor ions. ETD, however, has shown limited applicability to doubly protonated peptide precursors, [M+2H]2+, the charge and type of peptide most frequently encountered in “bottom-up” proteomics. Here we describe a supplemental collisional-activation (CAD) method that targets the non-dissociated (intact) electron transfer (ET) product species ([M+2H]+•) to improve ETD efficiency for doubly protonated peptides (ETcaD). A systematic study of supplementary activation conditions revealed that low energy CAD of the ET product population leads to the near-exclusive generation of c and z-type fragment ions with relatively high efficiency (77 ± 8%). Compared to those formed directly via ETD, the fragment ions were found to comprise increased relative amounts of the odd-electron c-type ions (c+•) and the even-electron z-type ions (z+). A large-scale analysis of 755 doubly charged tryptic peptides was conducted to compare the method (ETcaD) to ion trap CAD and ETD. ETcaD produced a median sequence coverage of 89% – a significant improvement over ETD (63%) and ion trap CAD (77%).
Introduction
Peptide ion fragmentation has become an integral component of most mass spectrometry-based proteomics experiments (i.e., tandem mass spectrometry, MS/MS).1–3 When implemented successfully the process generates a collection of sequence-informative product ions that can reveal a peptide’s primary sequence and the location of any post-translational modifications (PTMs). Success is, of course, a relative term, but it can be defined as the generation of a sufficient number of sequence-informative product ions – peptide backbone bond breakages – to unambiguously determine the peptide’s primary sequence. The observation of every possible product ion (b and y- or c and z-type) is not a necessary condition for success; however, the probability of achieving success improves as the number of observed product ions increases.
Ideally, a single ion activation method would generate a sufficient number of sequence-informative product ions for successful sequence identification regardless of the precursor cation’s charge, mass, amino acid composition, or PTM state – at present no such method exists. Enzymatic protein digestion is a common strategy to normalize peptide precursor ion size and charge, though it cannot control amino acid composition and PTM state. The bulk of all proteomic sequencing efforts rely on tryptic peptides, which following electrospray ionization (ESI) generate peptides containing 1 to 4 charges (with 2 being the most frequent). The popularity of trypsin for MS-based proteomic work stems from two main attributes: (1) chromatographic separation of tryptic peptides is straightforward and (2) tryptic peptides have the best chance of being successfully dissociated to provide a rich set of sequence informative fragments via the conventional peptide ion activation method – collision-activated dissociation (CAD).4, 5
CAD, the most commonly used peptide ion activation method, has been implemented on a variety of MS systems, e.g., RF 3D quadrupole ion trap (QIT), RF linear 2D quadrupole ion trap (QLT), quadrupole time-of-flight (QqTOF), and TOF-TOF. In this process peptide precursor ions are kinetically excited and collide with inert gas molecules. The internal energy deposited during these collisions is ultimately distributed as vibrational excitation throughout all covalent bonds of the peptide cation. When the deposited internal energy exceeds the corresponding activation barrier for bond cleavage fragmentation can occur. For peptide ions, the low activation barrier for cleavage of protonated amide bonds makes them susceptible to fragmentation and leads to the generation of b and y-type product ions. A homologous series of b and y-type product ions can be generated provided the precursor ion population contains a random distribution of protonated amide linkages. The presence of certain amino acids can prevent random protonation, e.g., basic residues.6, 7 Trypsin helps in this regard since it mandates each peptide end in Arg or Lys, minimizing the probability of internal basic resides. However, as peptide length grows, either from missed cleavages or the use of other enzymes, so does the probability of internal basic residues that will block random protonation. Beyond that, other residues or PTMs (e.g., Pro or phosphorylation, for example) can offer lower energy fragmentation pathways which can be likewise problematic.8–11 Either by preventing random backbone protonation or by offering lower energy dissociation pathways, the presence of certain residues and/or chemical moieties tends to induce selective cleavage and prevent the formation of a homologous ion series via CAD.12
There are many ways to implement CAD experimentally; time-scale for energy deposition and collision energies are the key variables among the various implementations. Sector and TOF/TOF mass spectrometers can achieve the highest collision energies (high-energy CAD), while the other systems operate in the so called low-energy CAD regime.13 Most peptide sequencing work has been carried out in the low-energy regime. There are differences among the low-energy approaches – beam-type CAD (used on QqTOF systems, for example) and resonant excitation-type CAD (used on ion trap systems).14 The time-scale for dissociation with ion trap CAD is longer than for beam-type CAD and this can cause differences in the preferred dissociation pathways. That said, all CAD approaches effect vibrational excitation and, consequently, are governed by the rules described above. Besides CAD, a variety of other methods can induce peptide ion fragmentation (e.g., collisions with surfaces,15 blackbody radiation,16 photon bombardment – IR and UV,17–20 and electron-based approaches21, 22).
Among all ion activation approaches, the electron-based methods – electron capture and electron transfer dissociation (ECD and ETD, respectively) – have shown a unique propensity to randomly cleave N – Cα bonds of the peptide backbone with relatively little regard to peptide length, amino acid composition, or the presence of PTMs. ECD results from the capture of a thermal electron by a multiply protonated peptide cation and is generally conducted within the confines of a Fourier transform ion cyclotron resonance mass spectrometer (FT-ICR-MS) at ultrahigh vacuum (~ < 10−8 Torr).21, 23–30 For MS systems that utilize RF fields for ion manipulation and containment (e.g., ion traps), simultaneous confinement of thermal electrons and peptide cations is a difficult proposition.31, 32 Storage of oppositely charged ions, however, is possible on these devices and,33, 34 provided the appropriate anion is selected, electron transfer can occur.22, 35 ETD occurs at relatively high pressures (~ 10−3 Torr), compared to ECD, but the outcomes appear remarkably similar.1, 36–40 Though no direct comparison has been performed to date, from a qualitative sense, there appears to be no significant differences in the two methods.
Both ECD and ETD generate extensive c and z-type fragmentation from peptide and whole protein cations and are more or less indifferent to peptide length, amino acid composition, or PTMs. Precursor ion charge, however, is an important factor that can affect the dissociation efficiency of both electron-based methods.41–43 Besides changes in the numbers of c and z-type products observed, there is a general shift toward non-dissociative electron capture or transfer (ET) as function of decreasing precursor charge (Scheme 1). This trend, observed by us and others studying both ETD and ECD, is independent of precursor mass – i.e., occurs for lower charge states of small peptides, large peptides, and whole proteins alike. McLafferty and colleagues recognized this during their early ECD experiments and proposed that non-covalent intramolecular interactions bind the dissociated c and z-type product ion pair together.44 To disrupt non-covalent interactions Horn et al. described collisional-activation of the precursor population prior to the electron capture period (activated-ion ECD).44 Later work by the same group reported that elevated ion cyclotron resonance (ICR) cell temperatures could also destroy non-covalent bonding and increase c and z-type product formation following ECD.45, 46 Infrared photons have provided another route to heat precursor cations prior to, or during, electron capture.45–48
Scheme 1.

Electron capture, of course, occurs at pressures ~ six orders of magnitude lower than that for electron transfer. Such high pressures (~ 3 mTorr) could limit the utility of collisionally activating the precursor ion population prior to the electron transfer reaction. Electron transfer ion/ion reactions occur over several milliseconds, thus, a pre-activated precursor ion would have opportunity to have numerous collisions with the He bath gas, i.e., the time-scale for collisional cooling in an ion trap is much shorter than for the electron transfer reaction.49 Collisional-activation in ion traps is generally effected by resonance excitation – a process that increases a target m/z value’s kinetic energy.50, 51 Collisional-activation during the ion/ion reaction period is possible, but that process could substantially slow or even cease the electron transfer reaction. Note ion/ion reactions proceed at a rate that is inversely proportional to v3 (where v is relative velocity of the ions) – a phenomena that has proved useful for ion parking.52–55 Photon bombardment is compatible with ion/ion reactions and could continually activate a precursor cation concurrently with electron transfer reactions; however, implementation of such an experiment would require extensive instrumental modification. McLuckey and co-workers have recently described the use of elevated helium bath gas temperatures to activate precursor cations concurrently during electron transfer reactions. These experiments were found to improve the sequence coverage obtained following ETD of several doubly protonated peptide cations.41
Both ion/ion compatible methods of precursor cation activation (i.e., concurrent with ETD) described above require instrument modification – addition of either a photon or mass analyzer heat source. A second option, that requires no instrument alteration, is to perform ETD and subsequently convert the non-dissociative electron transfer products to c and z-type fragment ions by use of supplemental excitation (Scheme 1, path A). Here we describe one such method (ETcaD) and characterize its utility compared to ion trap CAD and ETD for 755 doubly charged tryptic peptide precursor ions.
Materials and Methods
Sample preparation
All chemicals were obtained from Sigma-Aldrich (St. Louis, MO) unless otherwise noted. Bovine serum albumin (BSA) was reduced and carboxyamidomethylated in 0.1M ammonium bicarbonate using dithiothreitol and iodoacetimide. The reduced and alkylated BSA was digested with trypsin (Promega, Madison, WI) at an enzyme to substrate ratio of 1:20 for 19.5 hours at 37°C. The resulting BSA digest solution (32 pmol/μL) was prepared using a C18 Sep-Pak cartridge (Waters, Milford, MA), brought to dryness in a vacuum centrifuge (SPD111V, Thermo Electron Corporation, Milford, MA), and resuspended with 70% aqueous acetonitrile with 0.1 M acetic acid to a final concentration of ~ 3–5 pmol/μL.
Arabidopsis seedlings (Columbia wild-type seeds from Lehle; Round Rock, TX) were grown in root ball culture. The culture media consisted of (N-Morpholino)ethanesulfonic acid-buffered (2.5 mM; pH 5.7) and Murishige and Skoog salts enriched with 1% sucrose. Plants were grown at ambient temperatures under 24 hour light and constant shaking. After 14 days of growth plant tissue was recovered and partially dried prior to weighing. For each gram of plant tissue, three milliliters of grinding buffer was added (250 mM Tris HCl, pH 7.6; 290 mM sucrose, 25 mM EDTA, 25 mM NaF, 50 mM sodium pyrophosphate, 1 mM ammonium molybdate, 0.5% polyvinyl pyrolidone, 1 mM DTT, 1 mM PMSF, 10 μg/mL leupeptin, 1 μg/mL pepstatin, 1 μg/mL E64, 100 μM 1,10-phenanthroline) and the resulting mixture was homogenized in stages; first with a household blender and second with a Polytron homogenizer (Brinkmann Instruments, Westbury, NY). Four layers of miracloth (EMD Biosciences, La Jolla, CA) were then used to filter the mixture. From the soluble protein, organellar and microsomal pellets were separated from the homogenate by centrifugation at 1500g and 100,000g respectively.
Protein content was determined by a bicinchoninic acid (BCA) protein assay (Pierce Biotechnology, Inc., Rockford, IL) and divided into aliquots each containing 200 μg of total protein. Acetone was added to 80% (v/v) to precipitate soluble proteins. Lastly, a trypsin digest was performed on the precipitate as described for BSA (vide supra).
Instrumentation
Chromatographic peptide separations were performed on a reversed-phase, self-prepared capillary column. The separation column consisted of a pre-column butt-connected to an analytical column using a 0.012” ID Teflon sleeve (Zeus Industrial Products, Orangeburg, SC). The analytical column was 360 μm × 50 μm (OD × ID) fused silica (Polymicro Technologies, Phoenix, AR) and was prepared by pulling a bottle neck and integrated ESI tip using a laser puller (Sutter Instrument Company, Novarto, CA, model P-2000) as described elsewhere 56. Approximately 1–2mm of 5 μm – 20 μm C18 particles (YMC, Milford, MA) followed by 7 cm of 5 μm C18 particles (Alltech Associates Inc., Deerfield, IL) were packed into the analytical column. The precolumn was made of 360 μm × 75 μm (OD × ID) fused silica and incorporated a LiChrosorb frit (EMD Chemicals Inc., Gibbstown, NJ) of ~ 2 mm in length. The pre-column was then packed with 5 cm of 5 μm C18 particles. The C18 particles were suspended in a 70/30 acetonitrile/isopropyl alcohol slurry and were packed using a helium pressure bomb (~400 PSI).
Online peptide separations were performed using an Agilent 1100 Series binary HPLC system (Palo Alto, CA) that was coupled to a Finnigan LTQ mass spectrometer (Thermo Electron Corporation, San Jose, CA). The sample was eluted from the column at a flow rate of 60 nL/min into the mass spectrometer using a linear gradient of 2 – 70% B in 135min, and 70 – 100% B in 15 min (A = 0.1M acetic acid, B = 70% acetonitrile in 0.1M acetic acid). The linear ion trap mass spectrometer was adapted to accept a chemical ionization source to allow for the generation and injection of fluoranthene radical anions for ETD reactions. The details of these modifications can be found elsewhere.35 The self-prepared nHPLC columns were interfaced to the MS with a modified Finnigan nanospray ionization source. All other samples were infused using a nanospray robot (Advion Biosciences, Ithaca, NY). The mass spectrometer was operated in a data dependent fashion. First, a full scan (300 – 2000 m/z) mass spectrum was acquired and the three most abundant m/z values were selected for further MS/MS interrogation. Each selected m/z value was then subjected to three consecutive MS/MS events: (1) CAD (30 ms, qu of 0.25, and a normalized collision energy of 35%, ~ 330 ms/scan), (2) ETD (100 ms reaction with fluoranthene radical anions, ~ 400 ms/scan), and (3) ETcaD (~ 430 ms/scan, conditions detailed below). This 10 scan event data dependent cycle was executed repetitively throughout the chromatographic separation. Note that each of these three MS/MS events was accomplished in a single scan.
Data analysis
CAD spectra were searched against the NCBI non-redundant database using OMSSA (Open Mass Spectrometry Search Algorithm).57 Searches were limited to the Arabidopsis taxonomy and parameters were set to consider a static modification of + 57 Da on cysteine residues (carbamidomethylation), a differential modification of + 16 Da on methionine (oxidation), a precursor mass tolerance of ± 1.5 Da and a fragment ion mass tolerance of ± 0.5 Da. 755 doubly charged peptide sequences of m/z < 1000 were extracted from the OMSSA search results and an in-house program was created to calculate the possible c and z-type or b and y-type fragment ions from the peptide sequences. Only doubly charged peptides of m/z < 1000 range were selected to ensure that all singly charge product ions were within the mass spectrometer’s mass range. The CAD, ETD, and ET/CAD spectral data were then compared against the predicted fragment ions to determine the observed c and z or b and y-type ions for each peptide identified from the OMSSA search. To minimize the identification of false positive product ions a minimum peak intensity threshold of 4% was set, relative to that of the most intense matched fragment ion. To allow for comparison, matched peak intensities were normalized relative to that of the most intense product ion for each peptide. Product ion mass windows of +/− 0.5 Da was used for the CAD and ETD product ion extraction. Due to the shift in the product ion ratios for the ETcaD data (vide infra), product ion windows of + 0.5 Da to − 1.5 Da were applied for c-type ions, and a + 1.5 Da to − 0.5 Da window was applied for z-type ions. These conditions were manually validated for approximately 100 of these spectra.
Results and Discussion
A 65 ms reaction of fluoranthene anions with the +3 charge state of a synthetic peptide, KAAAKAAAK, generates every possible c and z-type product ion (Figure 1A, 16 of 16); only half of these fragments are observed when the +2 precursor is reacted (Figure 1B, 8 of 16). Besides changes in the numbers of c and z-type product ions observed, there is a general shift toward non-dissociative electron transfer (ET, [M+2H]+•) with decreasing precursor charge and increasing precursor m/z. In the original description of ETD we noted that collisional-activation of these charge-reduced precursor ions generated a mixture of fragments characteristic of both CAD and ETD (b and y and c and z-type products) and McLuckey et al. have described similar results following electron transfer reactions in a 3D ion trap.22, 35, 58 As shown in scheme 1, an ideal approach would convert these charge-reduced species exclusively into sequence-informative c and z-type product ions and thereby increase the performance of ETD.
Figure 1.

Product ion spectra following ETD of the triply (A) and doubly (B) protonated synthetic peptide KAAAKAAAK. Note the dication generates only half of the possible c and z-type product ions.
Figure 2 displays the mass spectrum of a non-dissociative electron transfer product (ET, [M+2H]+•, Panel A) and the corresponding singly protonated peptide ion ([M+H]+, Panel B). Note the ET product is poorly resolved compared to the singly protonated version of the same peptide. This suggests that the radical-containing species is “fragile” and dissociates as it is kinetically excited just prior to resonant ejection from the linear ion trap 59–61. From this data we conclude that ET product ions can be dissociated via lower energy collisional-activation than that required to fragment the more robust even-electron species (i.e., [M+H]+, Panel B). Given that even-electron precursor ions require more energetic collisions to induce CAD-type fragmentation (b and y-type ion formation), we presumed that low-energy collisional-activation of the ET product ions could result in the exclusive formation of c and z-type fragment ions.
Figure 2.

Isotopic distribution of a charge reduced, non-dissociated ET product (A, [M+2H]+•) and the corresponding singly protonated version (B, [M+H]+). The fragility of the ET product results in low resolution during mass analysis as compared to its even electron counterpart.
To pursue this assumption an ET product ion ([M+2H]+•, m/z 1169), derived from the peptide TGPNLHGLFGR, was collisionally activated over a broad range excitation energies for a duration of 30 ms. Note the activated peak comprised both the ET product ion, [M+2H]+•, and to a small extent the singly protonated version, [M+H]+, which is generated via proton transfer side-reactions. Excitation voltage and frequency was varied to access a range of CAD energies. Here the excitation frequency is expressed in terms of the nominal activation Mathieu qu parameter for the precursor ion. Mathieu qu is a reduced parameter that is proportional to RF magnitude, inversely proportional to m/z, and diagnostic of ion motion in a quadrupole field. In the range of activation qu values used here, the excited ion characteristic frequency will vary approximately linearly with qu (~ 2−1/2·qu·ffield, where ffield is the trapping field frequency, ~1200 kHz) and maximum attainable trapped ion kinetic energies will vary as qu2. Figure 3 comprises three panels that exhibit the abundance of each species – the precursor ([M+2H]+•, m/z 1169), an ETD-type fragment (m/z 1010), and a CAD-type fragment (m/z 790) – as a function of excitation voltage and activation qu. This figure represents the summation of 18,000 individual scans. Regardless of activation qu, excitation voltages less than ~ 0.8V (volts peak-to-peak between opposing rod electrodes) are insufficient to dissociate the radical-containing precursor species (Fig. 3A). Onset of the ETD-type product, m/z 1010, occurs at an excitation voltage of ~ 0.85V and at qu values as low as 0.13. The maximum yield for this c-type ion occurs at an excitation voltage of 1.1V and a qu value of 0.18. By comparison, the b-type ion, m/z 790, is not observed below a qu value of ~ 0.16 and has maximum yield at a qu of ~ 0.20 and excitation voltage of 1.3V. These data confirm our hypothesis that under the appropriate activation conditions an ET product can be selectively converted into c and z-type fragment ions.
Figure 3.

Contour maps plotting the effect of activation qu-value and excitation voltage for collisional activation of an ET product ion ([M+2H]+•). Panel A displays the abundance of the intact ET product (the ion subjected to secondary activation); panel B plots the formation of an ETD-type product ion (c10) not produced directly by ETD; panel C displays formation of a CAD-type product ion (b8). Plotted to the right are three two-dimensional cross-sections (varying excitation voltage at fixed qu values of 0.15, 0.18, and 0.20) of this data. These cross-sections also plot the combined total product ion signal derived from ET, ETD and ETcaD. Note the total ion signal trace does not include the precursor signal. Because the ET precursor ion was not isolated, this signal begins at ~ 80% relative intensity – signal that can be attributed to c and z-type fragments generated directly by ETD.
To validate that this approach would be applicable for all singly-charged ET products derived from doubly protonated peptide precursors ([M+2H]+•), and to determine the optimal activation conditions, we performed these experiments for five additional ET precursor species. These results are highlighted in Figure 4 (which represents the compilation of 108,000 individual spectra), where each trace represents the onset conditions for the observation of either ETD or CAD-type fragmentation. Note excitation voltage has been replaced with the related Finnigan LTQ control parameter, normalized collision energy. This parameter is approximately proportional to the excitation voltage normalized by the precursor m/z. For each of these six examples normalized collision energies ~ 20% and low activation qu (~ 0.15 – 0.18) induce a near-exclusive generation of ETD-type fragmentation products.
Figure 4.

Plot of the onset values (qu and normalized collision energy) for observation of either CAD-type or ETD-type product ions following supplemental activation of six different intact ET product ion species.
Conversion efficiency calculations
Precursor-to-product conversion efficiency is an important figure of merit for an activation method, with our supplemental activation approach being no exception. In this calculation of precursor-to-product ion conversion efficiency, we sum all of the product ion signal generated following supplemental CAD (qu = 0.18, normalized collision energy = 20%) of the isolated [M+2H]+• ion and express it as a percentage of initial total ion signal of the of the isolated [M+2H]+• ion [Equation 1].
This approach ignores the contribution of low-level CAD-type fragment ions and any remaining precursor ([M+2H]+•) species, but close inspection indicated the approach provided a good estimate.. Efficiency was determined for CAD of 15 singly charged ET cations (derived from doubly charged tryptic peptides with m/z ranging from 444 – 978) that were generated from an infused BSA digest. The average precursor-to-product conversion efficiency for these species was 77% (+/− 8%), as shown in Table 1. In certain cases application of the isolation waveform resulted in partial fragmentation of the [M+2H]+• species prior to the supplemental activation step. This was minimized by use of a large isolation window (10 m/z); however, our measured conversion efficiencies were, in most cases, slightly lowered by this effect. Application of these activation conditions (qu = 0.18, normalized collision energy = 20%) to the singly protonated form, [M+H]+, of several of these peptides generated no detectable fragmentation, in most cases (data not shown). Thus, these data suggest that the ET product, [M+2H]+•, comprises at least ¾ of the isolated charge reduced species – i.e., this experiment also provides an indirect measure of overall electron transfer efficiency.
Table 1.
| m/z | Sequence | Percent Efficiency |
|---|---|---|
| 444 | DDSPDLPK | 80.7 |
| 450 | LCVLHEK | 78.4 |
| 537 | SHCIAEVEK | 86.9 |
| 582 | LVNELTEFAK | 70.9 |
| 642 | HPEYAVSVLLR | 67.0 |
| 646 | ECCDKPLLEK | 70.0 |
| 653 | HLVDEPQNLIK | 80.5 |
| 700 | TVMENFVAFVDK | 81.3 |
| 710 | SLHTLFGDELCK | 69.0 |
| 732 | TCVADESHAGCEK | 91.8 |
| 740 | LGEYGFQNALIVR | 83.1 |
| 756 | VPQVSTPTLVEVSR | 66.3 |
| 778 | DDPHACYSTVFDK | 74.1 |
| 863 | MPCTEDYLSLILNR | 76.6 |
| 978 | DAIPENLPPLTADFAEDK | 70.8 |
|
| ||
| AVERAGE | 77 (+/− 8%) | |
Complex mixture analysis
To evaluate the overall efficacy of the supplemental activation method (ETcaD) a tryptic digest of an Arabidopsis complex protein mixture was prepared and gradient eluted into the mass spectrometer (nHPLC-MS/MS). Eluting peptide ions were selected in a data-dependent fashion and subjected to three consecutive tandem MS events – CAD, ETD, and ETcaD. For ETcaD, ETD was performed followed by supplemental activation of the ET product species at a qu of 0.18 and 20% normalized collision energy. Note the ET product ion, [M+2H]+•, was not isolated prior to supplemental activation. In this way c and z-type ions generated directly via ETD were retained. From the CAD tandem mass spectra a total of 755 doubly charged peptides were identified with high confidence following a database search. The CAD-derived sequences were then used to evaluate the matching ETD and ETcaD spectra. Figure 5 displays the single scan ETD and ETcaD spectra for three of these doubly charged peptide precursor ions. A strong signal for the ET product ion ([M+2H]+•) is observed in each ETD spectrum (Fig. 5 panels A-C). These data also demonstrate that with increasing m/z the amount of ET, relative to direct c and z-type ion formation, increases. ETD of the precursor at m/z 532 (Fig. 5A) yields 6 of 16 possible fragment ions resulting in 6 of 8 possible backbone cleavages; the precursor of m/z 966, on the other hand, produces only 2 of 40 possible fragment ions reflecting 2 of 20 possible backbone cleavages. The corresponding single-scan ETcaD spectra are shown in Figure 5D-F and for comparison are plotted on an identical intensity scale. For each of these peptide dications a significant increase in the number of c and z-type product ions is observed. ETcaD of the precursor at m/z 532 (Fig. 5A) produces 8 of 16 fragment ions and results in 100% sequence coverage as at least one product ion associated with each possible backbone cleavage point is observed. But as the precursor m/z increases the benefit of ETcaD becomes more apparent. The ETcaD spectrum of the largest peptide here (m/z 966, Fig 5F) exemplifies this by production of 15 of 40 possible c and z-type fragment ions corresponding to cleavage at 14 of 20 backbone cleavage positions. Note five of the six missed cleavages are forbidden since they involve cleavage of the proline ring system.
Figure 5.

Comparison of ETD (A–C) and ETcaD (D–F) tandem mass spectra (single scan) for 3 tryptic peptides. Each of these was acquired during a data-dependent analysis of a complex tryptic peptide mixture derived from Arabidopsis.
To compare product ion trends for each activation method across various peptide lengths, and to provide a compact visual representation, a fragmentation data array was prepared (Fig. 6). Each MS/MS spectrum is depicted by two rows; observed N-terminal fragment ions are shown in blue, while the C-terminal fragment ions are displayed in orange on the next row below, as indicated by the inset. Color intensity correlates with relative product ion intensity. From these data previously observed trends for such CAD spectra are apparent, e.g., intense b2 ion peaks.62 The observed trend of decreased c and z-type ion production with increasing m/z becomes even more obvious here. Fairly good numbers of c and z-type product ions are obtained for seven residue peptides, but the extent of fragmentation degrades markedly with increasing peptide length and characteristically results in a sizeable gap in sequence coverage extending from mid sequence till the last couple of residues at the C-terminus. Visual inspection of the ETcaD data column indicates this gap is substantially closed by use of supplementary activation.. This is confirmed by statistical analysis of the data (vide infra).
Figure 6.
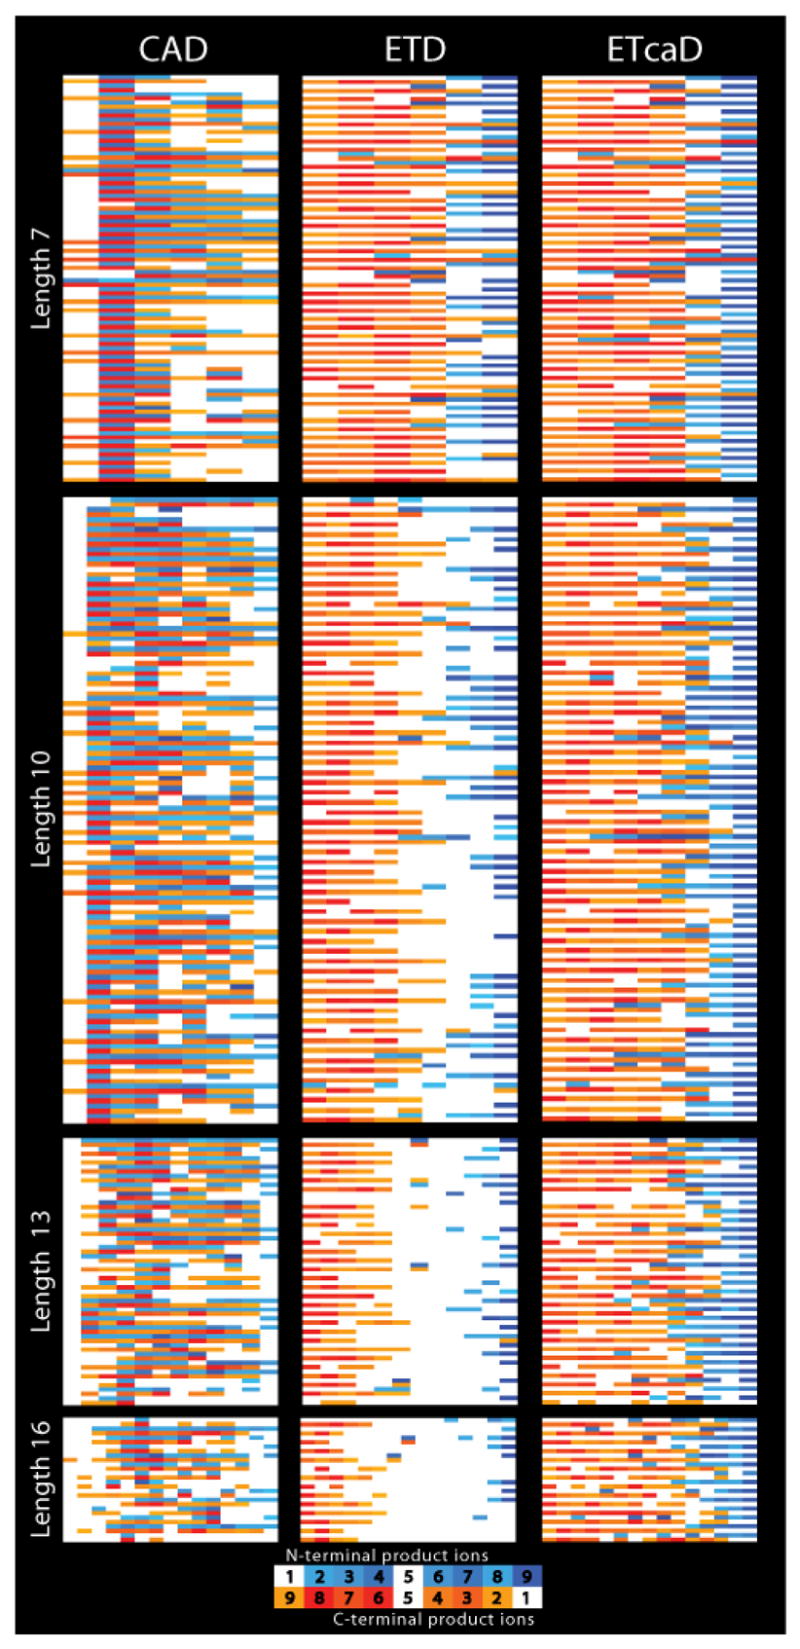
Fragmentation data array that summarizes the performance of CAD, ETD, and ETcaD for doubly charged peptide precursors ranging from 7 to 16 amino acids in length. Observed fragment ions from each peptide are depicted in two rows; N-terminal product ions are shown from left to right in blue, while C-terminal products are displayed from right to left in orange. Color intensity correlates with observed product ion intensity. Note for ETD a significant gap in sequence coverage becomes increasingly apparent as the peptide size increases. This gap is substantially minimized by use of ETcaD.
Another interesting trend observed in this data is the proclivity of both ETD and ETcaD to preferentially generate z-type ions (shown in red), as compared to c-type ions (shown in blue). A possible explanation is that each of the peptides studied here is Lys or Arg terminated (carboxyl terminus) and either of these basic residues could preferentially retain (or sequester) the remaining charge following electron transfer. Second, for this set of doubly charged precursor ions, both ETD and ETcaD tend to generate larger c and z-type product ions with complementary ion pairs being rare. A similar trend has been reported for ECD of doubly charged precursor ions.43 For these peptides, CAD more frequently produces complementary ion pairs than either ETD or ETcaD; however, this does not necessarily correlate to greater sequence coverage.
Figure 7A displays a plot of percent sequence coverage, which is defined as
Figure 7.
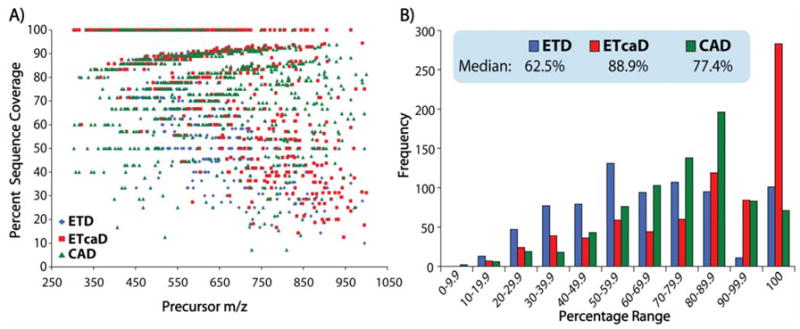
Percent sequence coverage resulting from CAD, ETD, and ETcaD as a function of precursor m/z (A) and frequency (B) for the 755 doubly protonated tryptic peptides studied here.
Note even though ETD does not cleave N-terminal to Pro, Pro linkages are included in this calculation. CAD is relatively indifferent to precursor m/z and has a median of 77.4% sequence coverage for the peptides studied here. The effect of precursor m/z on ETD sequence coverage is easily observed in these data – i.e., decreasing sequence coverage as a function of increasing m/z. The magnitude of this trend is reduced for ETcaD, but not eliminated; however, for many of these peptides very high sequence coverage is obtained through use of ETcaD. Figure 7B provides a comparison of percent sequence coverage for each method. Note that for nearly 300 of the 755 peptides sampled, ETcaD resulted in 100% sequence coverage – a factor of 3 to 5 more than either ETD or CAD. In this study ETcaD achieved a median sequence coverage of 88.9%, while CAD and ETD generated 77.4% and 62.5%, respectively.
ETcaD product ion distributions
ETD, like ECD, generally results in the formation of even-electron c-type ions (c+) and odd-electron z-type ions (z+•). Contributions from even-electron z-type ions (z+) and the odd electron c-type ions (c+•) are observed, but are typically less abundant. Product ions generated via ETcaD, however, often show an elevated contribution from both the odd-electron c-type ion (c+•) and the even-electron z-type product (z+). In many cases these two ion types are more abundant than their respective counterparts (see Figure 5). This phenomenon has previously been explained (in ECD work) by a mechanism in which the dissociated c+ and z+• fragment ions are held in close proximity through non-covalent interactions (e.g., hydrogen bonding).63 The radical z-type ion (z+•) may then abstract a hydrogen atom from an α-carbon of the c-type product ion (c+) resulting in the formation of the observed odd-electron c-type (c+•) and the even-electron z-type product ions (z+). These z-type product ions (z+) are 1 Da heavier than predicted, while the c-type product ions (c+•) are 1 Da lighter. Most ETcaD spectra show mixtures of both forms of c and z-type product ions (i.e., even and odd-electron) – such mixtures are not desirable. It is possible that a wide scale statistical analysis will generate trends that can help predict when to expect hydrogen atom abstraction. For now spectral correlation algorithms will require adaptation to accommodate this phenomenon. Despite this ambiguity we anticipate that the higher sequence coverage afforded by ETcaD should, in most cases, allow high confidence peptide identification.
Compatibility with PTMs
A significant advantage of ETD is its relative indifference to the presence of PTMs. Many PTMs are labile under CAD conditions, and the use of collisional activation, albeit at low energy, could erode the utility of ETcaD. To examine this possible effect three doubly charged synthetic phosphopeptide cations were studied. The first peptide, RRpSPpSPYYSR, produced one backbone cleavage upon ETD fragmentation (data not shown). Use of ETcaD increased the number of observed backbone bond cleavages to seven of a possible nine. H3PO4 loss was observed with a relative intensity three times greater than that of the most intense c or z-type product ion. The second doubly protonated peptide cation, ARpSVpSPPPKR, produced fragment ions representing three of the nine possible backbone bond cleavages upon ETD activation, and fragment ions representing six of the nine possible cleavages following ETcaD. As with RRpSPpSPYYSR, loss of H3PO4 was observed – with an intensity twice that of the most abundant c or z-type product ion. Finally, the dication of LPISASHpSpSKTR was dissociated by ETD yielding fragment ions corresponding to four of ten backbone bond cleavages; upon ETcaD activation, nine of ten backbone cleavages were represented. Again, the loss of H3PO4 was observed at an intensity of ~ 2.5 times that of the most intense c or z-type product ion. Phosphoric acid neutral losses were not observed in any of the ETD fragmentation spectra, but always in the ETcaD product ion spectra. In addition, low-level (~ 5% relative) peaks corresponding to neutral losses of phosphoric acid from c and z-type product ions were present (~ 50% of c and z-type products had a corresponding neutral loss peak). ETcaD generated greater sequence coverage than ETD in all cases. And we note the characteristic neutral loss could serve as a phosphorylation marker.
Conclusions
ETD delivers the unique fragmentation behavior of ECD to benchtop RF-ion trapping-type mass spectrometers and is easily performed on a chromatographic time-scale. The method, however, shows a decrease in fragment ion yield with increasing precursor m/z and a corresponding increase in the yield of the intact charge-reduced electron transfer product This effect is most pronounced with doubly charged peptide precursor ions above m/z 400 – where only larger c and z-type fragment ions are observed, if at all. Thus, approaches that can improve the yield of ETD fragment ions for peptide dications would significantly enhance the applicability of the technique. Here we have described the use of a supplementary collisional activation approach (ETcaD) that targets the non-dissociative electron transfer product ions. A systematic study of activation conditions revealed that low energy CAD (qu = 0.18; 20% normalized collision energy) of the intact ET product species ([M+2H]+•) can lead to the near-exclusive generation of c and z-type fragment ions with high efficiency (77 + 8%). These fragment ions were found to have increased relative amounts of the odd-electron c-type ion (c+•) and the even-electron z-type ion (z+), which is consistent with earlier reports in the ECD literature. A large-scale analysis of 755 doubly charged tryptic peptides was conducted to compare the method (ETcaD) to ion trap CAD and ETD. The reduction of sequence coverage with increasing peptide size (m/z) for ETD was readily apparent in these data. This relationship was lessened, but not entirely removed by use of EtcaD. Overall, however, ETcaD resulted in a median sequence coverage of 88.9% - a significant improvement over ETD (62.5%) and even CAD (77.4%) for these doubly charged peptides. Note the benefit ETcaD, as compared to CAD, is likely to become even more apparent when applied to non-tryptic peptide dications, such as those encountered in peptidomic work.
ETcaD provides a relatively simple mechanism to improve the utility of ETD for peptide dications. It does not require hardware modification and adds only 30 ms of time to each scan (< 10% of a complete scan cycle). Further, we believe the supplemental activation process can be performed in less time and this is the subject of further investigation. Recent work by us and others have revealed that the m/z dependence in sequence coverage provided by ETD is not limited to doubly charged precursor ions; thus, we are also investigating the use of ETcaD for the activation of ET products derived from higher charge state precursor ions. Because of its apparent utility and easy implementation we believe that ETcaD will become a routine approach for peptide dissociation. With the vibrational and electron-based approaches to fragmentation each having their own strengths, hybrid techniques like ETcaD may provide have the highest probability of success in peptide sequence identification from a single experiment.
Acknowledgments
The authors would like to thank the University of Wisconsin-Madison and Thermo Electron for financial support of this work. DLS and GCM gratefully acknowledge support from NIH pre-doctoral fellowships – Genomic Sciences Training Program (NIH 5T32HG002706, to DLS) and the Biotechnology Training Program (NIH 5T32GM08349, to GCM). We also thank Michael Sussman, Adrian Hegeman, and Edward Huttlin for preparation of the Arabidopsis complex protein mixture.
References
- 1.Coon JJ, Syka JE, Shabanowitz J, Hunt DF. Biotechniques. 2005;38:519, 521–523. doi: 10.2144/05384TE01. [DOI] [PubMed] [Google Scholar]
- 2.Aebersold R, Mann M. Nature. 2003;422:198–207. doi: 10.1038/nature01511. [DOI] [PubMed] [Google Scholar]
- 3.Hunt DF, Yates JR, Shabanowitz J, Winston S, Hauer CR. Proceedings of the National Academy of Sciences of the United States of America. 1986;83:6233–6237. doi: 10.1073/pnas.83.17.6233. [DOI] [PMC free article] [PubMed] [Google Scholar]
- 4.Huang YY, Triscari JM, Tseng GC, Pasa-Tolic L, Lipton MS, Smith RD, Wysocki VH. Analytical Chemistry. 2005;77:5800–5813. doi: 10.1021/ac0480949. [DOI] [PMC free article] [PubMed] [Google Scholar]
- 5.Kennedy RT, Jorgenson JW. Analytical Chemistry. 1989;61:1128–1135. doi: 10.1021/ac00180a012. [DOI] [PubMed] [Google Scholar]
- 6.Wysocki VH, Tsaprailis G, Smith LL, Breci LA. Journal of Mass Spectrometry. 2000;35:1399–1406. doi: 10.1002/1096-9888(200012)35:12<1399::AID-JMS86>3.0.CO;2-R. [DOI] [PubMed] [Google Scholar]
- 7.Dongre AR, Jones JL, Somogyi A, Wysocki VH. Journal of the American Chemical Society. 1996;118:8365–8374. [Google Scholar]
- 8.Schroeder MJ, Shabanowitz J, Schwartz JC, Hunt DF, Coon JJ. Analytical Chemistry. 2004;76:3590–3598. doi: 10.1021/ac0497104. [DOI] [PubMed] [Google Scholar]
- 9.DeGnore JP, Qin J. Journal of the American Society for Mass Spectrometry. 1998;9:1175–1188. doi: 10.1016/S1044-0305(98)00088-9. [DOI] [PubMed] [Google Scholar]
- 10.Wells L, Vosseller K, Cole RN, Cronshaw JM, Matunis MJ, Hart GW. Molecular & Cellular Proteomics. 2002;1:791–804. doi: 10.1074/mcp.m200048-mcp200. [DOI] [PubMed] [Google Scholar]
- 11.Grewal RN, El Aribi H, Harrison AG, Siu KWM, Hopkinson AC. Journal of Physical Chemistry B. 2004;108:4899–4908. [Google Scholar]
- 12.Tsaprailis G, Nair H, Somogyi A, Wysocki VH, Zhong WQ, Futrell JH, Summerfield SG, Gaskell SJ. Journal of the American Chemical Society. 1999;121:5142–5154. [Google Scholar]
- 13.Medzihradszky KF, Campbell JM, Baldwin MA, Falick AM, Juhasz P, Vestal ML, Burlingame AL. Analytical Chemistry. 2000;72:552–558. doi: 10.1021/ac990809y. [DOI] [PubMed] [Google Scholar]
- 14.Xia Y, Liang XR, McLuckey SA. Analytical Chemistry. 2006;78:1218–1227. doi: 10.1021/ac051622b. [DOI] [PubMed] [Google Scholar]
- 15.Bier ME, Schwartz JC, Schey KL, Cooks RG. International Journal of Mass Spectrometry and Ion Processes. 1990;103:1–19. [Google Scholar]
- 16.Schnier PD, Price WD, Jockusch RA, Williams ER. Journal of the American Chemical Society. 1996;118:7178–7189. doi: 10.1021/ja9609157. [DOI] [PMC free article] [PubMed] [Google Scholar]
- 17.Hunt DF, Shabanowitz J, Yates JR. Journal of the Chemical Society-Chemical Communications. 1987:548–550. [Google Scholar]
- 18.Little DP, Speir JP, Senko MW, Oconnor PB, McLafferty FW. Analytical Chemistry. 1994;66:2809–2815. doi: 10.1021/ac00090a004. [DOI] [PubMed] [Google Scholar]
- 19.Kim TY, Thompson MS, Reilly JP. Rapid Communications in Mass Spectrometry. 2005;19:1657–1665. doi: 10.1002/rcm.1969. [DOI] [PubMed] [Google Scholar]
- 20.Thompson MS, Cui WD, Reilly JP. Angewandte Chemie-International Edition. 2004;43:4791–4794. doi: 10.1002/anie.200460788. [DOI] [PubMed] [Google Scholar]
- 21.Zubarev RA, Kelleher NL, McLafferty FW. Journal of the American Chemical Society. 1998;120:3265–3266. [Google Scholar]
- 22.Syka JEP, Coon JJ, Schroeder MJ, Shabanowitz J, Hunt DF. Proceedings of the National Academy of Sciences of the United States of America. 2004;101:9528–9533. doi: 10.1073/pnas.0402700101. [DOI] [PMC free article] [PubMed] [Google Scholar]
- 23.Turecek F. Journal of the American Chemical Society. 2003;125:5954–5963. doi: 10.1021/ja021323t. [DOI] [PubMed] [Google Scholar]
- 24.Zubarev RA. Current Opinion in Biotechnology. 2004;15:12–16. doi: 10.1016/j.copbio.2003.12.002. [DOI] [PubMed] [Google Scholar]
- 25.Kruger NA, Zubarev RA, Horn DM, McLafferty FW. International Journal of Mass Spectrometry. 1999;187:787–793. [Google Scholar]
- 26.Cerda BA, Horn DM, Breuker K, Carpenter BK, McLafferty FW. European Mass Spectrometry. 1999;5:335–338. [Google Scholar]
- 27.Cerda BA, Breuker K, Horn DM, McLafferty FW. Journal of the American Society for Mass Spectrometry. 2001;12:565–570. doi: 10.1016/S1044-0305(01)00209-4. [DOI] [PubMed] [Google Scholar]
- 28.Zubarev RA. Mass Spectrometry Reviews. 2003;22:57–77. doi: 10.1002/mas.10042. [DOI] [PubMed] [Google Scholar]
- 29.Syrstad EA, Turecek F. Journal of the American Society for Mass Spectrometry. 2005;16:208–224. doi: 10.1016/j.jasms.2004.11.001. [DOI] [PubMed] [Google Scholar]
- 30.Emmett MR. Journal of Chromatography A. 2003;1013:203–213. doi: 10.1016/s0021-9673(03)01127-0. [DOI] [PubMed] [Google Scholar]
- 31.Baba T, Hashimoto Y, Hasegawa H, Hirabayashi A, Waki I. Analytical Chemistry. 2004;76:4263–4266. doi: 10.1021/ac049309h. [DOI] [PubMed] [Google Scholar]
- 32.Silivra OA, Kjeldsen F, Ivonin IA, Zubarev RA. Journal of the American Society for Mass Spectrometry. 2005;16:22–27. doi: 10.1016/j.jasms.2004.09.015. [DOI] [PubMed] [Google Scholar]
- 33.He M, McLuckey SA. Journal of Mass Spectrometry. 2004;39:1231–1259. doi: 10.1002/jms.629. [DOI] [PubMed] [Google Scholar]
- 34.McLuckey SA, Stephenson JL. Mass Spectrometry Reviews. 1998;17:369–407. doi: 10.1002/(SICI)1098-2787(1998)17:6<369::AID-MAS1>3.0.CO;2-J. [DOI] [PubMed] [Google Scholar]
- 35.Coon JJ, Syka JEP, Schwartz JC, Shabanowitz J, Hunt DF. International Journal of Mass Spectrometry. 2004;236:33–42. [Google Scholar]
- 36.Good DM, Coon JJ. Biotechniques. 2006;40:783–789. doi: 10.2144/000112194. [DOI] [PubMed] [Google Scholar]
- 37.Coon JJ, Ueberheide B, Syka JEP, Dryhurst DD, Ausio J, Shabanowitz J, Hunt DF. Proceedings of the National Academy of Sciences of the United States of America. 2005;102:9463–9468. doi: 10.1073/pnas.0503189102. [DOI] [PMC free article] [PubMed] [Google Scholar]
- 38.Gunawardena HP, Emory JF, McLuckey SA. Analytical Chemistry. 2006;78:3788–3793. doi: 10.1021/ac060164j. [DOI] [PMC free article] [PubMed] [Google Scholar]
- 39.Hogan JM, Pitteri SJ, Chrisman PA, McLuckey SA. Journal of Proteome Research. 2005;4:628–632. doi: 10.1021/pr049770q. [DOI] [PMC free article] [PubMed] [Google Scholar]
- 40.Pitteri SJ, Chrisman PA, Hogan JM, McLuckey SA. Analytical Chemistry. 2005;77:1831–1839. doi: 10.1021/ac0483872. [DOI] [PMC free article] [PubMed] [Google Scholar]
- 41.Pitteri SJ, Chrisman PA, McLuckey SA. Analytical Chemistry. 2005;77:5662–5669. doi: 10.1021/ac050666h. [DOI] [PMC free article] [PubMed] [Google Scholar]
- 42.Zubarev RA, Horn DM, Fridriksson EK, Kelleher NL, Kruger NA, Lewis MA, Carpenter BK, McLafferty FW. Analytical Chemistry. 2000;72:563–573. doi: 10.1021/ac990811p. [DOI] [PubMed] [Google Scholar]
- 43.Iavarone AT, Paech K, Williams ER. Analytical Chemistry. 2004;76:2231–2238. doi: 10.1021/ac035431p. [DOI] [PMC free article] [PubMed] [Google Scholar]
- 44.Horn DM, Ge Y, McLafferty FW. Analytical Chemistry. 2000;72:4778–4784. doi: 10.1021/ac000494i. [DOI] [PubMed] [Google Scholar]
- 45.Breuker K, Oh HB, Horn DM, Cerda BA, McLafferty FW. Journal of the American Chemical Society. 2002;124:6407–6420. doi: 10.1021/ja012267j. [DOI] [PubMed] [Google Scholar]
- 46.Horn DM, Breuker K, Frank AJ, McLafferty FW. Journal of the American Chemical Society. 2001;123:9792–9799. doi: 10.1021/ja003143u. [DOI] [PubMed] [Google Scholar]
- 47.Tsybin YO, Witt M, Baykut G, Kjeldsen F, Hakansson P. Rapid Communications in Mass Spectrometry. 2003;17:1759–1768. doi: 10.1002/rcm.1118. [DOI] [PubMed] [Google Scholar]
- 48.Mihalca R, van der Burgt YEM, McDonnell LA, Duursma M, Cerjak I, Heck AJR, Heeren RMA. Rapid Communications in Mass Spectrometry. 2006;20:1838–1844. doi: 10.1002/rcm.2520. [DOI] [PubMed] [Google Scholar]
- 49.Badman ER, Hoaglund-Hyzer CS, Clemmer DE. Journal of the American Society for Mass Spectrometry. 2002;13:719–723. doi: 10.1016/S1044-0305(02)00374-4. [DOI] [PubMed] [Google Scholar]
- 50.March RE, McMahon AW, Allinson ET, Londry FA, Alfred RL, Todd JFJ, Vedel F. International Journal of Mass Spectrometry and Ion Processes. 1990;99:109–124. [Google Scholar]
- 51.March RE, McMahon AW, Londry FA, Alfred RL, Todd JFJ, Vedel F. International Journal of Mass Spectrometry and Ion Processes. 1989;95:119–156. [Google Scholar]
- 52.Chrisman PA, Pitteri SJ, McLuckey SA. Analytical Chemistry. 2006;78:310–316. doi: 10.1021/ac0515778. [DOI] [PubMed] [Google Scholar]
- 53.Chrisman PA, Pitteri SJ, McLuckey SA. Analytical Chemistry. 2005;77:3411–3414. doi: 10.1021/ac0503613. [DOI] [PMC free article] [PubMed] [Google Scholar]
- 54.McLuckey SA, Reid GE, Wells JM. Analytical Chemistry. 2002;74:336–346. doi: 10.1021/ac0109671. [DOI] [PubMed] [Google Scholar]
- 55.Reid GE, Shang H, Hogan JM, Lee GU, McLuckey SA. Journal of the American Chemical Society. 2002;124:7353–7362. doi: 10.1021/ja025966k. [DOI] [PubMed] [Google Scholar]
- 56.Martin SE, Shabanowitz J, Hunt DF, Marto JA. Analytical Chemistry. 2000;72:4266–4274. doi: 10.1021/ac000497v. [DOI] [PubMed] [Google Scholar]
- 57.Geer LY, Markey SP, Kowalak JA, Wagner L, Xu M, Maynard DM, Yang XY, Shi WY, Bryant SH. Journal of Proteome Research. 2004;3:958–964. doi: 10.1021/pr0499491. [DOI] [PubMed] [Google Scholar]
- 58.Pitteri SJ, Chrisman PA, Hogan JM, McLuckey SA. Analytical Chemistry. 2005;77:1831–1839. doi: 10.1021/ac0483872. [DOI] [PMC free article] [PubMed] [Google Scholar]
- 59.Li HY, Plass WR, Patterson GE, Cooks RG. Journal of Mass Spectrometry. 2002;37:1051–1058. doi: 10.1002/jms.364. [DOI] [PubMed] [Google Scholar]
- 60.McClellan JE, Murphy JP, Mulholland JJ, Yost RA. Analytical Chemistry. 2002;74:402–412. doi: 10.1021/ac015610b. [DOI] [PubMed] [Google Scholar]
- 61.Murphy JP, Yost RA. Rapid Communications in Mass Spectrometry. 2000;14:270–273. doi: 10.1002/(SICI)1097-0231(20000229)14:4<270::AID-RCM875>3.0.CO;2-6. [DOI] [PubMed] [Google Scholar]
- 62.Yalcin T, Khouw C, Csizmadia IG, Peterson MR, Harrison AG. Journal of the American Society for Mass Spectrometry. 1995;6:1165–1174. doi: 10.1016/1044-0305(95)00569-2. [DOI] [PubMed] [Google Scholar]
- 63.O’Connor PB, Lin C, Cournoyer JJ, Pittman JL, Belyayev M, Budnik BA. Journal of the American Society for Mass Spectrometry. 2006;17:576–585. doi: 10.1016/j.jasms.2005.12.015. [DOI] [PubMed] [Google Scholar]