Abstract
The TOR (target of rapamycin) signal transduction pathway is an important mechanism by which cell growth is controlled in all eucaryotic cells. Specifically, TOR signaling adjusts the protein biosynthetic capacity of cells according to nutrient availability. In mammalian cells, one branch of this pathway controls general translational initiation, whereas a separate branch specifically regulates the translation of ribosomal protein (r-protein) mRNAs. In Saccharomyces cerevisiae, the TOR pathway similarly regulates general translational initiation, but its specific role in the synthesis of ribosomal components is not well understood. Here we demonstrate that in yeast control of ribosome biosynthesis by the TOR pathway is surprisingly complex. In addition to general effects on translational initiation, TOR exerts drastic control over r-protein gene transcription as well as the synthesis and subsequent processing of 35S precursor rRNA. We also find that TOR signaling is a prerequisite for the induction of r-protein gene transcription that occurs in response to improved nutrient conditions. This induction has been shown previously to involve both the Ras-adenylate cyclase as well as the fermentable growth medium–induced pathways, and our results therefore suggest that these three pathways may be intimately linked.
INTRODUCTION
Normal cell proliferation requires that growing cells adjust their protein biosynthetic capacity in response to nutrient availability as well as to the presence of growth factors and other signaling molecules. This response involves coordinated changes both in the rate of translational initiation as well as in the abundance of the protein synthesis machinery itself, especially ribosomes. Indeed, studies of both procaryotic and eucaryotic cells have shown that the concentration of ribosomes within the cell can vary several fold depending on growth rate (reviewed in Kjeldgaard and Gausing, 1974; Woolford and Warner, 1991). Such tight coupling between ribosome content and growth rate is understandable for at least two reasons. First, when cells are growing at their maximum rate under optimal growth conditions, a high concentration of ribosomes is needed to meet demands for protein biosynthesis. On the other hand, ribosome synthesis is energetically very costly. In yeast, for example, the production of ribosomes involves well over 100 genes, requires the action of all three RNA polymerases, and represents a major fraction of the total biosynthetic output of the cell (Woolford and Warner, 1991). Thus, to conserve resources, cells must limit the production of new ribosomes under conditions in which the demand for protein synthesis is reduced, such as occurs when nutrients are limiting. Remarkably, the signal transduction pathways that underlie this regulation remain largely uncharacterized.
Recent studies of mammalian cells suggest that ribosomal protein (r-protein) synthesis involves control at the level of translational initiation (Thomas and Hall, 1997). This regulation involves recognition of an unusual pyrimidine-rich sequence at the 5′ end of r-protein mRNAs, referred to as a 5′TOP (terminal oligopyrimidine), and requires phosphorylation of ribosomal protein S6 by the P70 S6 kinase (p70s6k) (Jefferies and Thomas, 1996; Jefferies et al., 1997; Meyuhas et al., 1996). In serum-starved cells as well as in cells treated with the macrolide antibiotic rapamycin, S6 becomes rapidly dephosphorylated, and 5′TOP mRNAs are no longer translated. Analysis of rapamycin-treated cells reveals that the steady-state distribution of these mRNAs shifts from polyribosomes to smaller ribonucleoprotein particles of unknown composition (Jefferies et al., 1997; Pedersen et al., 1997). The existence of 5′TOP sequences in mice as well as Xenopus suggests that this mechanism is conserved among metazoans (Meyuhas et al., 1996).
Rapamycin combines with the immunophilin FKBP and inhibits a large molecular weight protein termed mTOR (mammalian target of rapamycin), also known as FRAP (Thomas and Hall, 1997). This protein has homology to a novel family of PI-3 kinase–related kinases, whose members include Mec1, Rad3, and DNA-dependent protein kinase, and is essential for p70s6k activity (Thomas and Hall, 1997). The TOR pathway also controls general translational initiation via a separate branch that is independent from p70s6k function. In this branch, mTOR is required for activation of eIF4E, the cap-binding subunit of the eIF4F complex, probably via inhibition of 4E-BP1, which is itself an inhibitor of eIF4E function (Beretta et al., 1996). Thus the TOR pathway controls cell growth by coupling growth signals to changes in both general translation as well as ribosome synthesis.
Two TOR genes exist in yeast, TOR1 and TOR2, and the products of both are inhibited by rapamycin (Heitman et al., 1991; Helliwell et al., 1994; Zheng et al., 1995). TOR2 has an additional function involved in actin cytoskeleton dynamics and polarized cell growth; however, this function is not inhibited by rapamycin, and its relationship to protein synthesis is not well understood (Schmidt et al., 1996, 1997). Rapamycin has several distinct effects on haploid yeast cells that mimic starvation, including G1 arrest, synthesis of storage carbohydrates, onset of autophagy, and entry into G0 (Heitman et al., 1991; Helliwell et al., 1994; Zheng et al., 1995; Barbet et al., 1996; Noda and Ohsumi, 1998). Rapamycin can also stimulate sporulation of diploid yeast cells under appropriate conditions (Zheng and Schreiber, 1997). A marked decrease in translational initiation is one of the earliest detectable effects upon treating yeast cells with rapamycin (Barbet et al., 1996). Indeed, inhibition of translation of the mRNA encoding Cln3, a G1 cyclin, has been shown to be involved directly in the G1 arrest caused by rapamycin (Barbet et al., 1996; Polymenis and Schmidt, 1997). Thus, in yeast, the TOR pathway couples protein synthesis to both cell growth and cell cycle progression in response to environmental cues. Precisely how this pathway controls translational initiation in yeast is not known, however, since TOR function has not been linked directly to eIF4E activity. A clue to this regulation has been provided by the recent demonstration that eIF4G, a subunit of the cap-binding complex that interacts with eIF4E, is degraded when cells are starved or are treated with rapamycin (Berset et al., 1998).
In contrast to mammalian cells, there is no identifiable p70s6k in yeast, and furthermore, yeast r-protein mRNAs lack a 5′TOP. Moreover, although yeast ribosomal protein S6 is normally phosphorylated in a manner that parallels the growth rate of the cell, no obvious growth defect results when the phosphorylation sites are mutated (Johnson and Warner, 1987). Thus the question arises as to what role TOR signaling plays in ribosome synthesis in yeast. In this study we have addressed this question directly. Our results demonstrate that the TOR pathway is essential for the transcription of rRNA and r-protein genes as well as for the modulation of r-protein gene expression in response to nutritional changes. Our results also suggest that this transcriptional regulation involves a branch of the TOR pathway that is distinct from its regulation of translation.
MATERIALS AND METHODS
Strains, Media, and General Methods
The strain of Saccharomyces cerevisiae used in this study was haploid W303 (ade2-1 trp1-1 leu2-3, 112 his3-11 ura3-1 can1-100 MATa), except where stated otherwise. As culture media we used YPD (1% yeast extract, 2% peptone, 2% dextrose), synthetic complete (SC) dextrose (0.7% yeast nitrogen base, 2% dextrose), or SC ethanol (0.7% yeast nitrogen base, 2% ethanol). SC media were supplemented with amino acids as described (Sherman, 1991). Starvation media contained 1% potassium acetate, 0.1% yeast extract, and 0.05% dextrose. Yeast cultures were grown at 30°C for all experiments. Yeast transformations were performed using a DMSO-enhanced lithium acetate procedure (Hill et al., 1991). Rapamycin (Sigma, St. Louis, MO) was dissolved in DMSO and added to a final concentration of 0.2 μg/ml. Cycloheximide (Sigma) was dissolved in water and added to a final concentration of 50 μg/ml.
Northern Blots
Yeast cells grown in culture were collected by centrifugation, washed in water, and stored at −80°C until processed for RNA. Total RNA was isolated from cells according to the hot-phenol method described previously (Kohrer and Domdey, 1991). RNA was quantitated, and equal amounts were loaded on 6.7% formaldehyde and 1.5% agarose gels and run in 1× E buffer (20 mM MOPS [pH 7.0], 5 mM NaOAc, 0.5 mM EDTA). The RNA was transferred to Duralon-UV membranes (Stratagene, La Jolla, CA) and probed overnight at 65°C in Church hybridization buffer (0.5 mM NaPO4 [pH 7.2], 7% SDS, 1 mM EDTA). The membranes were washed in 2× sodium–saline citrate and exposed. Quantitation of Northern blots was performed on a Molecular Imager System GS-363 (Bio-Rad, Richmond, CA). All Northern probes were labeled with [α-32P]dCTP using Ready-to-Go DNA-labeling beads (Pharmacia, Piscataway, NJ).
Probes for Northern Blots
Probes were generated by PCR using genomic DNA as a template and specific primers (purchased from Research Genetics, Birmingham, AL) for each of the following genes (alternative names and ORF numbers are listed in parenthesis): ribosomal protein genes are RPS5 (YJR123W), RPS6A (YPL090C), RPS28A (YOR167C), RPS30A (FYLR287C), RPL3 (YORO63W), RPL10 (GCR5, QSR1; YLR075W), RPL25 (YOL127W), RPL29 (CYH2; YGL103W), and RPL32 (YGL030W); nonribosomal protein genes are ACT1 (YFL039C), TDH3 (glyceraldehyde-3-phosphate dehydrogenase 3; YGR192C), PAB1 (YER165W), TEF1 (EF1α; YPR080W), PRT1 (CDC63; YOR361C), TIF45 (eIF4E, CDC33; YOL139C), TIF4631 (eIF4G; YGR162W), HSP26 (YBR072W), and CLN1 (YMR199W).
Polyribosome Analysis
One liter cultures were grown in YPD to midlog phase and then treated with rapamycin or with drug vehicle alone. Several minutes before cells were harvested, cycloheximide was added to a final concentration of 50 μg/ml to stabilize polyribosomes. Cells were collected by centrifugation, washed, and resuspended in 1 ml of lysis buffer (10 mM Tris-HCl [pH 7.5], 30 mM MgCl2, 100 mM NaCl, 50 μg/ml cycloheximide). Cell were lysed by bead-beating, and 15 OD260 U of each cell extract was loaded onto 13-ml 7–47% sucrose gradients made in buffer containing 50 mM Tris-HCl (pH 7.5), 12 mM MgCl2, 50 mM NaCl, and 1 mM DTT. Gradients were centrifuged in an SW40 rotor for 80 min at 40,000 rpm at 4°C, and 1-ml fractions were collected using an ISCO (Lincoln, NE) gradient fractionator. RNA was prepared by extraction with phenol/chloroform and was analyzed by Northern blotting.
Propidium Iodide Staining and Flow Cytometry
Cells were stained with propidium iodide as described previously (Nash et al., 1988) except that cells were sequentially treated with RNaseA (0.25 mg/ml) and Proteinase K (0.2 mg/ml), each for 60 min at 50°C, before staining. Cells were subsequently analyzed using a Facscan flow cytometer (Bectin Dickinson, Mountain View, CA).
Western Blots and Antibodies
Denatured protein extracts were prepared by bead-beating cells directly into SDS sample buffer (60 mM Tris-HCl [pH 6.8], 2% SDS, 10% glycerol, 100 mM DTT, 0.25% bromophenol blue, 2 μM leupeptin, 1 mM PMSF), followed by heating for 5 min at 100°C. Proteins were subjected to SDS-PAGE on 10–15% gradient gels and transferred to nitrocellulose membranes (Protran, Intermountain Scientific, Kaysville, UT) by electroblotting. Membranes were probed with anti-eIF4E and anti-eIF4G antisera (the generous gifts of S. Wells and A. Sachs), followed by HRP-conjugated secondary antibody (Amersham, Arlington Heights, IL), in PBS, 2% milk, and 0.5% Tween 20. Signal was detected using the Renaissance chemiluminescence detection system (New England Nuclear Life Sciences, Boston, MA) according to the instructions of the manufacturer. Western blots were quantitated using a phosphoimager.
Plasmid Construction
The starting plasmid for construction of plasmid-encoded reporter genes was pDN201 (Ng et al., 1996). This plasmid contains the strong constitutive promoter for the TDH3 gene, encoding glyceraldehyde-3-phosphate dehydrogenase 3, followed by the ACT1 terminator inserted into the centromeric vector YCp50 (Rose et al., 1987). The coding region of green fluorescent protein (GFP) was amplified using PCR and inserted into the unique BamHI and XbaI sites located between the promoter and terminator of pDN201 to create pTP154.
The reporter plasmid containing GFP driven by the RPL32 promoter was constructed in several steps. First, the TDH3 promoter was removed from pDN201 by digestion with EcoRI (which cuts on the 5′ side of the promoter) and XbaI (which cuts between the promoter and terminator) and replaced with a small polylinker containing unique HindIII and SacI sites to create pTP105. Next, the RPL32 promoter was PCR amplified using genomic DNA from W303 as a template and was placed into Bluescript vector pBS-KS+ (Stratagene) together with the coding region for GFP to create pTP107. The sequence of the RPL32 promoter that was amplified extends from positions 227 to 589, as described (Dabeva and Warner, 1987). Finally, the RPL32–GFP fusion was introduced into pTP105, using the unique HindIII and SacI sites, to create pTP113.
Labeling rRNA with [C3H3]Methionine
Incorporation of [C3H3]methionine into nascent rRNA transcripts was performed essentially as described (Udem and Warner, 1972; Warner, 1991). Cultures were grown in SC dextrose to midlog phase and were then treated with drug vehicle alone or with rapamycin for 10–30 min. Subsequently, 1.5 ml of each culture was transferred to an Eppendorf tube, 60 μl of [C3H3]methionine (1 mCi/ml; New England Nuclear Life Sciences) was added, and samples were incubated for 5 min at 30°C. Where appropriate, unlabeled methionine was added as a chase to a final concentration of 1 mM, and cells were incubated for an additional 3 min. Cells were harvested by centrifugation, washed with water, and stored at −80°C. RNA was prepared and applied to a formaldehyde-agarose gel and electrophoresed, as described above. The gel was soaked in Enhance (Dupont, Wilmington, DE), dried under vacuum, and exposed to x-ray film (Bio Max Film; Kodak, Rochester, NY) for 14 d at −80°C.
RESULTS
Rapamycin Induces a Rapid Reduction in r-Protein mRNA Levels
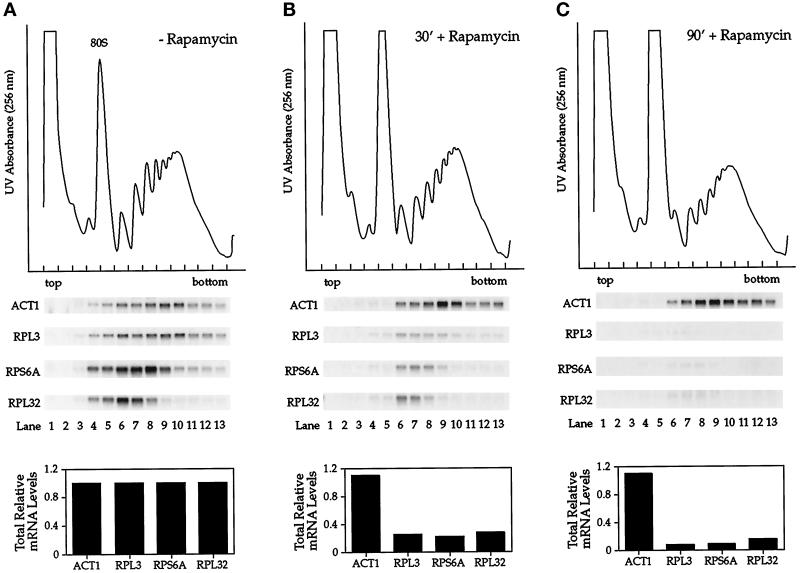
To begin to explore a possible role for the yeast TOR pathway in ribosome synthesis, we investigated the effects of rapamycin treatment on the level and distribution of several r-protein mRNAs in polyribosomes. Extracts were prepared from cultures of exponentially growing cells treated either with rapamycin or with drug vehicle alone (DMSO) and were fractionated by sucrose density ultracentrifugation to display polyribosome profiles. RNA was isolated from individual fractions and analyzed by Northern blotting using probes directed against three different r-protein mRNAs and, as a control, actin mRNA (Figure 1). In cells treated with drug vehicle alone, actin mRNA was recovered primarily in polyribosome fractions near the bottom of the gradient (Figure 1A, ACT1). Similarly, the r-protein mRNAs were also found primarily in polyribosome fractions, where each mRNA sedimented according to its predicted relative size (Figure 1A).
Figure 1.
The fate of r-protein mRNAs in polyribosomes after treatment of yeast cells with rapamycin. Exponentially growing cells were treated with drug vehicle alone for 90 min (A) or with rapamycin for either 30 min (B) or 90 min (C). Cell extracts were prepared, and polyribosomes were separated by sucrose density ultracentrifugation followed by fractionation. Top, a UV absorbance profile was recorded by scanning at 256 nm to display the polyribosome profile. Middle, RNA was isolated from individual fractions and analyzed by Northern blotting, probing for the specified mRNAs. Bottom, the total relative amount of each mRNA present in the different cell extracts is indicated, normalized to levels present in cells treated with drug vehicle alone.
Neither the distribution nor the abundance of actin mRNA changed significantly when cells were treated with rapamycin, with the exception that this mRNA disappeared from subunit and monosome fractions, consistent with decreased translational initiation in the presence of the drug (Figure 1, B and C). This effect on initiation was also evident from the UV absorbance profiles of the gradients, which showed an increase in monosome and a corresponding decrease in polyribosome peaks in extracts isolated from rapamycin-treated cells, in agreement with previous observations (Barbet et al., 1996). In striking contrast, the amount of each r-protein mRNA was reduced dramatically in rapamycin-treated cells, where levels decreased by >70% after 30 min and by >90% after 90 min of drug treatment (Figure 1, B and C). The peak signal for each r-protein mRNA did not change appreciably in the presence of the drug, however, indicating that rapamycin did not affect the steady-state distribution of these mRNAs but rather their synthesis and/or stability.
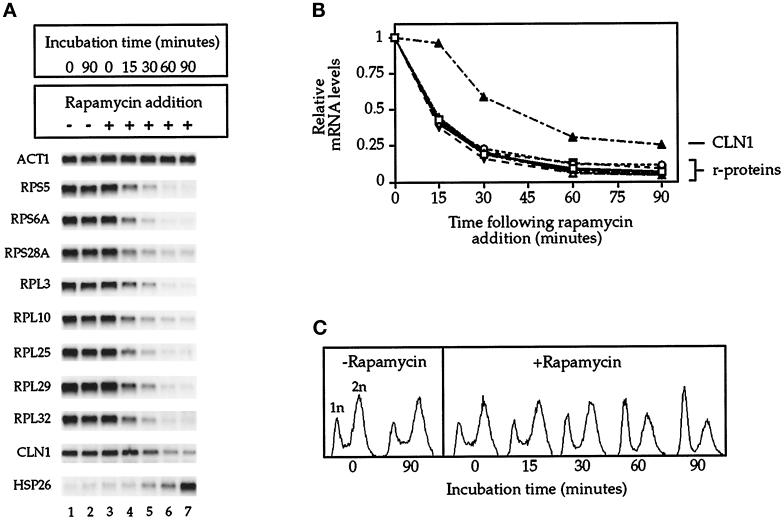
To extend these results, we performed a time course of rapamycin treatment and analyzed the mRNA levels of a total of eight r-protein genes by Northern blotting (Figure 2A). For comparison, we also examined mRNA levels for the G1 cyclin CLN1 as well as the heat-shock protein HSP26, both of which are representative of several mRNAs whose abundance either decreases or increases, respectively, upon rapamycin treatment (Barbet et al., 1996). Quantitation of the results showed that each of the r-protein mRNAs had a strikingly similar profile of decline after exposure to the drug, in which levels decreased by >50% within 15 min (Figure 2B). At this time there was no detectable change in the growth rate of the culture or in the number of cells containing a 1n DNA content, determined by flow cytometry, indicating that rapamycin had not yet induced a G1 arrest within a detectable population of cells (Figure 2C) (our unpublished results). In contrast, a substantial reduction of CLN1 mRNA was only observed after 30 min of rapamycin treatment (Figure 2, A and B), a time that also corresponded to the first sign of a G1 arrest (Figure 2C). Moreover, strong induction of HSP26 mRNA synthesis did not occur until relatively late in the time course (Figure 2A). These results thus demonstrated a rapid decline in the level of several r-protein mRNAs when yeast cells were treated with rapamycin. Because most r-protein genes are coordinately expressed in yeast (Woolford and Warner, 1991), we conclude that these results are likely to pertain to most, if not all, r-protein mRNAs. This conclusion is confirmed by recent experiments in which mRNA levels in rapamycin-treated cells have been monitored on a genome-wide basis by DNA-array analysis (Cao and Brown, personal communication).
Figure 2.
Time course of rapamycin treatment. (A) Northern blot analysis of specified mRNAs isolated from cells incubated with or without rapamycin for the period of time indicated. (B) Quantitation of data from A, with mRNA levels normalized to ACT1 mRNA. (C) Flow cytometric analysis of cells isolated during the time course, with 1n and 2n denoting haploid and diploid cells, respectively.
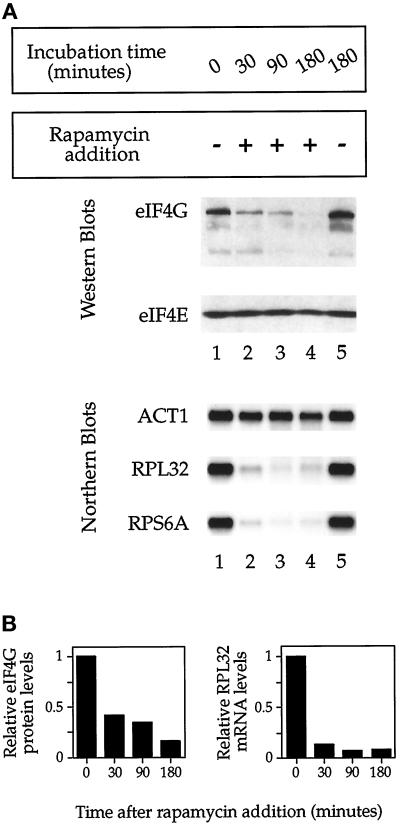
We wanted to compare directly the effect of rapamycin on r-protein mRNA levels with its effect on translational initiation. Here we took advantage of the recent observation that initiation factor eIF4G becomes degraded after addition of rapamycin to yeast cells, in a manner that correlates with reduced initiation, which provided a quantitative assay for the effect of the drug on protein synthesis (Berset et al., 1998). Indeed, Western blot analysis demonstrated that eIF4G protein levels diminished after rapamycin treatment, decreasing by >50% within 30 min; in contrast, no change in the level of eIF4E protein was observed (Figure 3, A, top, and B), in agreement with previous results (Berset et al., 1998). In addition, the rate of eIF4G degradation after rapamycin treatment was very similar to the observed decrease in the rate of incorporation of 35S-methionine into nascent polypeptides, confirming the utility of this assay (Barbet et al., 1996) (our unpublished results). In comparison, Northern analysis of RNA samples prepared during the same experiment demonstrated that r-protein mRNA levels declined at an even more rapid rate (Figure 3, A, bottom, and B). These results thus confirm that a reduction in r-protein mRNA levels ranks among the most immediate responses to treating yeast cells with rapamycin.
Figure 3.
Comparison of the effect of rapamycin on eIF4G protein levels versus r-protein mRNA levels. (A) Top, protein samples were prepared, and Western blot analysis was performed using polyclonal antisera raised against eIF4G or eIF4E. Bottom, alternatively, total RNA was prepared and probed for the indicated mRNAs by Northern blot analysis. (B) Quantitation of data from A compares the decline in eIF4G protein levels (normalized to eIF4E protein levels) with the decline of RPL32 mRNA levels (normalized to ACT1 mRNA) after rapamycin treatment.
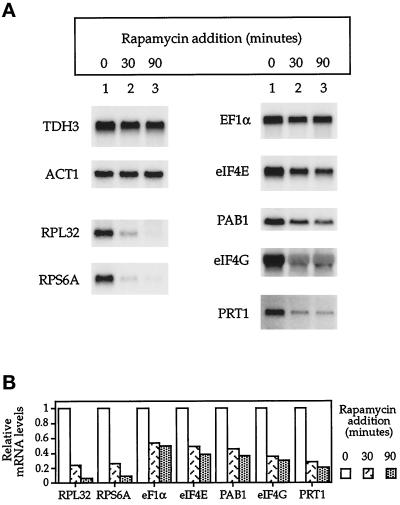
Ribosomal protein gene expression is often coordinated with that of other genes involved in protein synthesis (Woolford and Warner, 1991). We therefore asked whether the levels of several mRNAs coding for proteins involved in translational initiation or elongation were similarly affected by rapamycin treatment (Figure 4). For each of the mRNAs examined, a significant decline was indeed observed within 30–90 min after treatment with the drug, ranging from an ∼50% reduction for TEF1, encoding EF1α, to a >80% reduction for PRT1, a subunit of eIF3 (Naranda et al., 1994; Phan et al., 1998). In no case, however, were the effects as dramatic as that observed for the r-protein mRNAs (Figure 4).
Figure 4.
Analysis of mRNA levels encoding translational initiation and elongation factors after rapamycin treatment. (A) Northern blot analysis of specified mRNAs isolated from cells treated with rapamycin for the period of time indicated. (B) Quantitation of data from A, normalized to ACT1 mRNA levels.
Regulation of r-Protein Gene Expression by the TOR Pathway
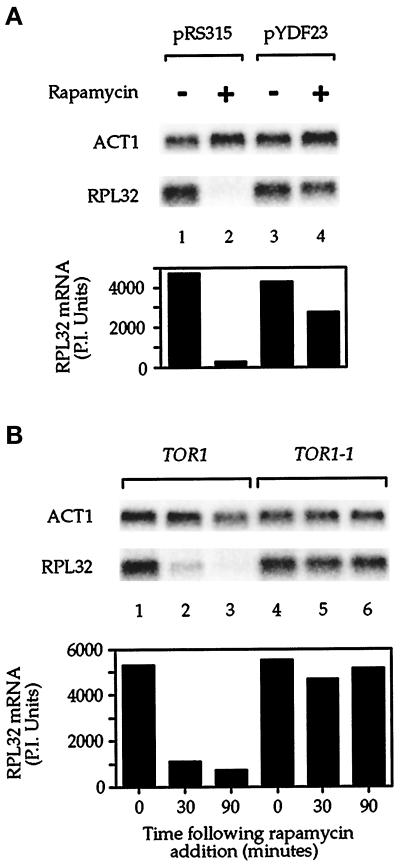
We wanted to confirm that the effect of rapamycin on r-protein mRNA levels was attributable to inhibition of TOR signaling. To this end, we introduced into yeast cells a plasmid that expressed a mutant version of the TOR1 gene, the TOR1-1 allele, which confers partial-dominant rapamycin resistance (Heitman et al., 1991; Zheng et al., 1995). Alternatively, we introduced into cells a control plasmid that lacked the TOR1 gene but expressed an identical auxotrophic marker. The results showed that after rapamycin treatment, cells carrying the plasmid with the TOR1-1 gene contained a significantly higher level of RPL32 mRNA than did cells carrying the control plasmid (Figure 5A, compare lanes 2 and 4). In an independent approach, we also examined the rapamycin-resistant strain JK9-3da that contained the TOR1-1 allele as its sole copy of the TOR1 gene (Barbet et al., 1996). In this strain, RPL32 mRNA levels remained essentially unchanged after incubation with rapamycin, in contrast to an isogenic wild-type strain in which mRNA levels fell dramatically (Figure 5B, compare lanes 2 and 3 with lanes 5 and 6). Together these results provide strong evidence that the observed reduction in r-protein mRNA levels in the presence of rapamycin was specifically the result of a block in the TOR-signaling pathway.
Figure 5.
The TOR pathway regulates r-protein mRNA levels. (A) Cells were transformed with a control plasmid (pRS315 [Sikorski and Heiter, 1989], lanes 1 and 2) or with a plasmid containing the TOR1-1 allele (pYDF23 [Zheng et al., 1995], lanes 3 and 4) and were grown in SC dextrose media lacking leucine to select for plasmid maintenance. Rapamycin was added as indicated, and cells were incubated for an additional 90 min. (B) Wild-type strain JH11-1c (lanes 1–3, TOR1) or TOR1-1 strain JK9-3da (lanes 4–6, TOR1-1) (Barbet et al., 1996) was grown to midlog phase in YPD and treated with rapamycin for the time indicated. In both A and B, cells were harvested after rapamycin treatment, total RNA was prepared, and the specified mRNAs were analyzed by Northern blotting (top). Quantitation of RPL32 mRNA levels is presented as phosphorimager units (P.I. Units), normalized to ACT1 mRNA (bottom).
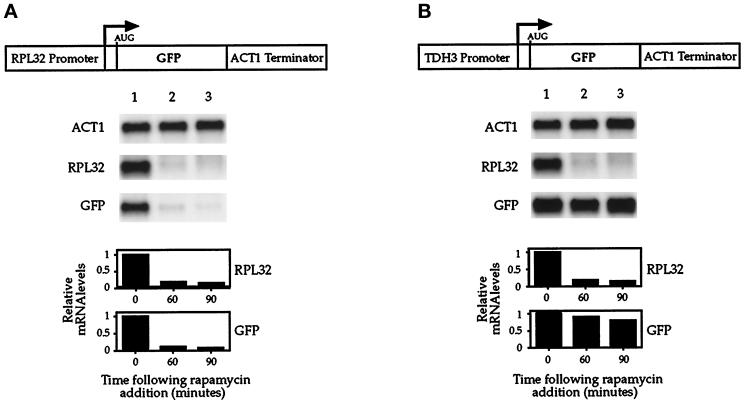
The observed reduction in r-protein mRNA levels could have resulted either from decreased transcription of the r-protein genes or from increased mRNA turnover. To distinguish between these two possibilities, we constructed a plasmid in which the RPL32 promoter drives expression of the cDNA coding for GFP (Figure 6A). The RPL32 promoter was chosen because it is well characterized in terms of sequences required for expression of reporter genes (Dabeva and Warner, 1987; Mizuta and Warner, 1994). For a control, we also constructed a plasmid in which GFP was placed under control of the TDH3 promoter (Figure 6B). This latter promoter was chosen because its relative strength was observed to be similar to that of the RPL32 promoter and because endogenous TDH3 mRNA levels did not change significantly after rapamycin treatment (Figure 4).
Figure 6.
Rapamycin inhibits r-protein gene transcription. Cells were transformed either with pTP113, in which GFP is driven by the RPL32 promoter, (A) or with pTP154, in which GFP is driven by the TDH3 promoter (B). Cells were grown in SC dextrose media lacking uracil to select for plasmid maintenance and were treated with rapamycin for the time indicated. Total RNA was prepared and analyzed by Northern blotting and probed for the specified mRNAs.
Both plasmids were introduced into yeast, and Northern analysis was performed on RNA isolated from untreated as well as from rapamycin-treated cells. The results showed that when GFP was under control of the RPL32 promoter, the level of this mRNA declined rapidly when cells were treated with rapamycin (Figure 6A). In contrast, no such decline was observed in cells when this gene was driven by the TDH3 promoter (Figure 6B). As expected, endogenous RPL32 mRNA levels were reduced to the same extent in cells carrying either plasmid after rapamycin treatment (Figure 6, A and B). These results demonstrated that upstream sequences of the RPL32 gene were sufficient to confer complete rapamycin sensitivity upon an unrelated reporter gene. The RPL32 promoter–GFP reporter plasmid contained ∼46 residues from the 5′-untranslated region of the RPL32 gene, raising the possibility that these sequences contributed to the observed response of this reporter to rapamycin. Construction of an additional control plasmid demonstrated, however, that these sequences did not confer any detectable sensitivity to rapamycin (our unpublished results). Taken together, these results demonstrate that rapamycin affects r-protein gene expression at the level of transcription.
The TOR Pathway Is Required for r-Protein Gene Induction in Response to Improved Nutrient Conditions
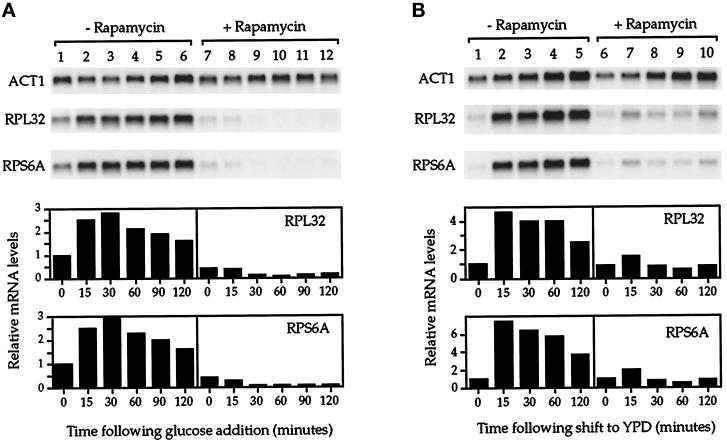
Ribosomal protein gene expression is induced several fold when yeast cells grown on a nonfermentable carbon source, for example, ethanol or glycerol, are transferred to a glucose-containing medium (Kief and Warner, 1981; Kraakman et al., 1993; Griffioen et al., 1994). This induction appears to involve additional regulatory mechanisms that are distinct from those that function during steady-state growth (Griffioen et al., 1996). We therefore wanted to determine whether the TOR pathway was required for this response as well. Accordingly, a yeast culture was grown to midlog phase in minimal media that contained ethanol as a sole carbon source. The culture was split into two, and either rapamycin or drug vehicle alone was added to each half. After a 10-min incubation, glucose was added to each culture, aliquots were removed at subsequent intervals, and RNA was prepared for Northern analysis (Figure 7A). As expected, cells that received drug vehicle alone showed a 2.5- to 3-fold increase in r-protein mRNA levels within 30 min after glucose addition (Figure 7A, −Rapamycin). In striking contrast, cells that received rapamycin showed no increase in r-protein mRNA levels upon addition of glucose but rather showed significantly reduced basal levels of these transcripts (Figure 7A, +Rapamycin). These results demonstrate the importance of TOR signaling for r-protein gene expression during glucose upshift.
Figure 7.
Rapamycin inhibits r-protein gene induction in response to improved nutrient conditions. (A) Glucose upshift experiment. Cells were grown in SC ethanol media to 0.4 OD600/ml. The culture was then split into two, and either drug vehicle alone (lanes 1–6) or rapamycin (lanes 7–12) was added to each half, followed by a 10-min incubation. Glucose was then added to a final concentration of 2% (wt/vol) at time 0, and RNA was prepared from samples taken at the indicated intervals and analyzed by Northern blotting (top). (B) Recovery from starvation experiment. Cells were grown in YPD to 0.4 OD600/ml and then harvested by centrifugation, washed, resuspended in starvation media, and incubated for 12 h. At this point the culture was split into two, and either drug vehicle alone (lanes 1–5) or rapamycin (lanes 6–10) was added to each half, followed by a 10-min incubation. Cells from each culture were then pelleted and resuspended into YPD again, and samples were subsequently taken at the indicated intervals. RNA was then prepared and analyzed by Northern blotting (top). In A and B, quantitation of r-protein mRNA levels is presented, normalized to ACT1 mRNA levels (bottom).
A more dramatic example of induction of r-protein gene expression occurs when cells previously starved for both a carbon and nitrogen source are introduced into rich medium (Griffioen et al., 1996). Thus to extend the above results, we asked whether rapamycin prevented this response as well (Figure 7B). To this end, a yeast culture was grown to midlog phase in rich media (YPD) and then transferred for 12 h to a nutrient-poor media that was unable to support growth. Examination of cells from the culture at this point revealed the presence of predominantly large, unbudded cells, indicative of a G1 arrest (our unpublished results). The culture was then split into two, and one-half received rapamycin, and the other half received drug vehicle. After 10 min, cells were returned to YPD, either with or without rapamycin, aliquots were removed periodically, and RNA was prepared for Northern analysis. Within 15 min of a shift to YPD, cells treated with drug vehicle alone exhibited a five- to sevenfold induction in r-protein mRNA levels (Figure 7B, −Rapamycin). In contrast, this induction was almost completely blocked in cells that had been treated with rapamycin (Figure 7B, +Rapamycin). A relatively weak (∼1.5 fold) increase in r-protein levels was observed at the 15-min time point in rapamycin-treated cells (Figure 7B, lane 7); however, this increase was not sustained, and these transcripts returned to basal levels within 30 min. These results thus confirm the importance of TOR signaling in the regulation of r-protein gene expression in response to improved nutrient conditions.
Repression of r-Protein Gene Expression by Rapamycin Does Not Require Protein Synthesis
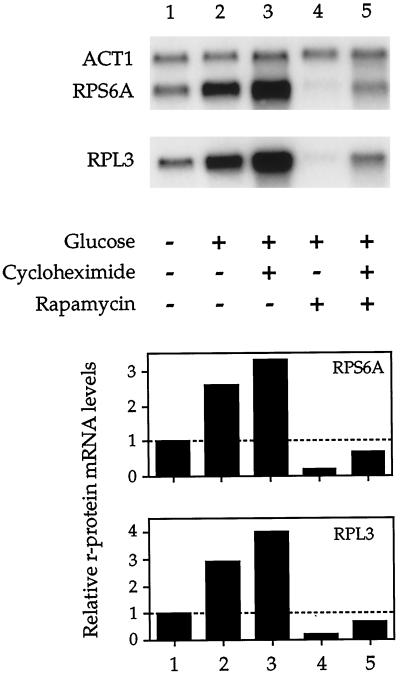
The above experiment demonstrated that rapamycin blocks induction of r-protein gene expression during glucose upshift (Figure 7A). In contrast, it has been reported that these genes are still induced upon glucose addition in the presence of cycloheximide, demonstrating that this induction does not require ongoing protein synthesis (Griffioen et al., 1994). Together these observations provided an opportunity to test whether regulation of r-protein gene transcription by the TOR pathway requires protein synthesis. Specifically, we performed a glucose upshift experiment similar to the one presented in Figure 7A and asked whether rapamycin blocked r-protein gene induction in the presence of cycloheximide. The results of this experiment are presented in Figure 8.
Figure 8.
Rapamycin blocks r-protein gene expression in the absence of ongoing protein synthesis. Cells were grown in SC ethanol to 0.4 OD600/ml, the culture was subdivided, and cells were treated with either rapamycin, cycloheximide, or both as indicated for 10 min. Glucose was then added to a final concentration of 2% (wt/vol) as indicated, and cells were incubated for an additional 30 min and then harvested (this time of incubation corresponded to the peak induction of r-protein gene expression observed during glucose upshift [see Figure 7A, lane 3]). RNA was then isolated and analyzed by Northern blotting.
As before, we observed that r-protein mRNA levels increased significantly when glucose was added to cells grown in minimal media containing ethanol as a sole carbon source (Figure 8, compare lanes 1 and 2). This increase was also observed in cells pretreated with high levels of cycloheximide before addition of glucose (Figure 8, lane 3), demonstrating that induction of these genes still occurred in the absence of protein synthesis, in agreement with previous observations (Griffioen et al., 1994). Control experiments demonstrated that cycloheximide inhibited both protein synthesis and cell growth, confirming that this drug was active (our unpublished results). Importantly, no r-protein gene induction resulted when glucose was added to cells pretreated either with rapamycin alone or with both rapamycin and cycloheximide (Figure 8, lanes 4 and 5, respectively). Interestingly, we consistently observed higher levels of r-protein mRNAs in cells treated with cycloheximide (Figure 8, compare lanes 2 vs. 3 and 4 vs. 5). This difference is likely caused by a reduced rate of turnover of relatively unstable mRNAs in the presence of this drug (Brawerman, 1993). In any event, these results demonstrate that no new protein synthesis is required for inhibition of r-protein gene expression by rapamycin during glucose upshift. This result is consistent with the rapid reduction in r-protein mRNA levels observed when exponentially growing cells are treated with the drug (Figure 2).
rRNA Synthesis and Processing Are Blocked by Rapamycin
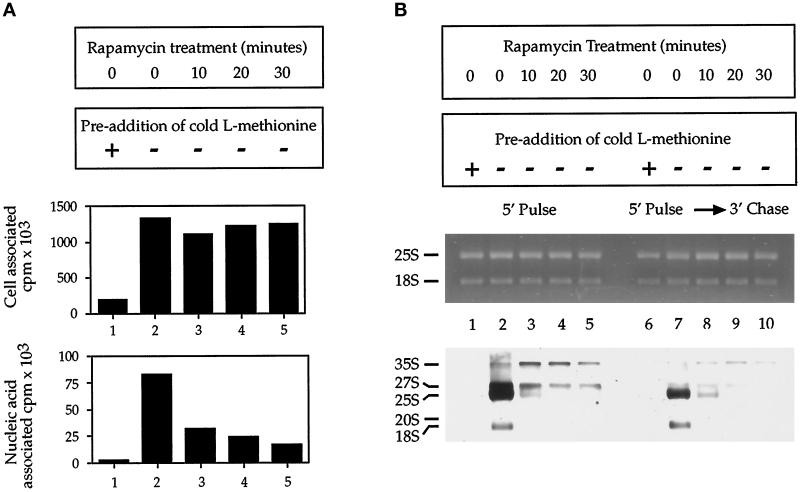
Our experiments have thus far focused on the importance of the TOR-signaling pathway in regulating r-protein gene expression. We wanted to ask whether this regulation extended to other aspects of ribosome biogenesis, in particular rRNA synthesis and processing. For this we took advantage of the fact that 35S precursor rRNA is methylated immediately upon its synthesis and can be selectively labeled using [C3H3]methionine; pulse-chase analysis allows the label to be subsequently followed into intermediate as well as completely processed molecules (Udem and Warner, 1972; Mizuta and Warner, 1994). Accordingly, we asked whether treating yeast cells with rapamycin affected the appearance of precursor and/or processed rRNA after the addition of [C3H3]methionine (Figure 9). In a preliminary experiment, we observed that the drug significantly reduced the total amount of labeled RNA present in cells with a pretreatment time as short as 10 min (Figure 9A, bottom). Importantly, rapamycin did not affect the amount of [C3H3]methionine that associated with cells, demonstrating that the observed reduction in labeled RNA was not caused by a failure of cells to take up the label (Figure 9A, top).
Figure 9.
Rapamycin inhibits synthesis and processing of 35S precursor rRNA. (A) [C3H3]Methionine was added to cells treated with rapamycin for the time indicated, and the amount of label taken up by cells (top) or incorporated into total RNA (bottom) is indicated. Unlabeled l-methionine was added to a final concentration of 1 mM to the sample in lane 1 before addition of [C3H3]methionine to control for uptake of the label. (B) [C3H3]Methionine pulse-chase analysis of rRNA after treatment with rapamycin, with both the ethidium bromide–stained gel (top) and the fluorograph of the gel (bottom), is shown. Unlabeled l-methionine was added to a final concentration of 1 mM to samples in lanes 1 and 6 before addition of [C3H3]methionine to control for uptake of the label.
We next performed a pulse-chase experiment and directly visualized the labeled rRNAs on a formaldehyde-agarose gel followed by fluorography (Figure 9B). Ethidium bromide staining of the gel before fluorography demonstrated that equal amounts of rRNA were loaded in each lane (Figure 9B, top). After a 5-min pulse with [C3H3]methionine, cells that were treated with drug vehicle alone displayed primarily mature 25 and 18S rRNAs, along with detectable levels of 27 and 20S precursors (Figure 9B, bottom, lane 2). After a subsequent chase with cold l-methionine, these precursors were converted completely into mature forms (Figure 9B, bottom, lane 7). In contrast to these results, cells pretreated with rapamycin showed very little incorporation of label after a 5-min pulse with label, producing primarily small amounts of 35 and 27S precursor (Figure 9B, bottom, lanes 3–5). Moreover, these species were not efficiently chased into mature forms of rRNA, particularly at the 20- and 30-min time points (Figure 9B, bottom, lanes 9 and 10). This latter result is consistent with the expected depletion of available r-proteins for use in ribosomal assembly (Woolford and Warner, 1991). These results indicate that the function of the TOR pathway is required for both rRNA transcription as well as processing and, together with our results presented above, lead to the conclusion that this pathway plays an essential role in general ribosome biogenesis.
DISCUSSION
We have demonstrated the importance of TOR signaling in the regulation of ribosome biogenesis in S. cerevisiae. In particular, we have shown that a functional TOR pathway is required for continued transcription of r-protein genes, as well as for the synthesis and processing of 35S precursor rRNA. Moreover, we have shown that this pathway is essential for modulation of r-protein gene expression in response to changes in nutrient conditions. Thus in yeast, TOR signaling couples nutrient availability to the transcription of genes involved in the formation of ribosomes.
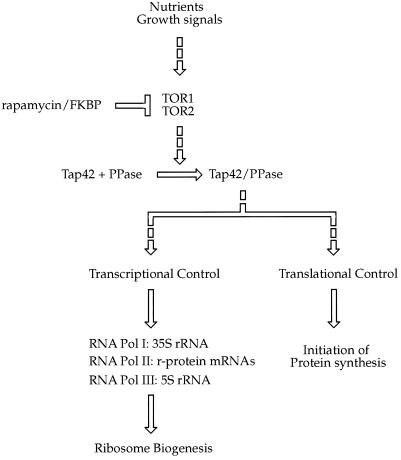
Our results also indicate that control of transcription of rRNA and r-protein genes represents a branch of the TOR pathway that is distinct from its regulation of translational initiation (Figure 10). This conclusion is supported by the rapid decrease in r-protein mRNA levels observed when TOR signaling is blocked by rapamycin, in which levels decline by half in <15 min. Because this rate corresponds to the measured half-lives of these mRNAs (Kim and Warner, 1983) and because rapamycin acts at the level of transcription (Figure 6), drug treatment must result in an essentially immediate block in r-protein gene transcription. Similarly, synthesis of 35S rRNA is severely inhibited after only brief exposure of cells to the drug. These effects rank among the earliest detectable consequences of rapamycin treatment, occurring either before or in parallel with changes in protein synthesis and in advance of any physiological sign of G1 arrest. Taken together, these results argue for direct involvement of this pathway in the transcription of genes involved in ribosome synthesis. While this manuscript was in preparation, Schultz and coworkers reported, using an independent approach, that the TOR pathway is directly involved in the regulation of RNA Pol I and Pol III activity (Zaragoza et al., 1998). Because these polymerases are essential for the synthesis of 35S rRNA (Pol I) and 5S rRNA as well as tRNA (Pol III), their data are in agreement with our results.
Figure 10.
Model for involvement of the TOR pathway in control of protein synthesis as well as transcription of genes encoding ribosomal components (adapted from Thomas and Hall, 1997). Broken arrows indicate that direct interactions between components have not been demonstrated. See text for details. Not depicted in the figure are Bmh1 and Bmh2, the yeast homologues of 14-3-3 proteins, which have been shown recently to be involved in TOR signaling (Bertram et al., 1998).
To date, relatively few components in the TOR pathway have been identified in yeast (Figure 10). In addition to Tor1 and Tor2, other proteins include 1) Pph21 and Pph22, the catalytic subunits of type 2A phosphatase (PP2A), 2) Sit4, a type 2A-related phosphatase, and 3) Tap42, a protein of unknown function that interacts with each of these phosphatases to form one or more protein complexes (collectively referred to as Tap42/PPase in Figure 10) (Di Como and Arndt, 1996; Thomas and Hall, 1997). A mutation in TAP42 inhibits polyribosome formation, suggesting that Tap42/PPase functions upstream of translational initiation (Di Como and Arndt, 1996). It is likely that Tap42/PPase also functions upstream of r-protein and rRNA gene expression for the following reasons (Figure 10). First, either a mutation in TAP42 or overexpression of SIT4 confers rapamycin resistance, indicating that these proteins are likely to act before any major branch point in the TOR pathway (Di Como and Arndt, 1996). Second, mutations in TPD3, the gene for the regulatory A subunit of PP2A, lead to defects in the transcription of genes under control of RNA Pol III (van Zyl et al., 1992). Third, Sit4 has been implicated in RNA Pol II activity, and furthermore, deletion of the SIT4 gene displays synthetic lethality with a tpd3 deletion (van Zyl et al., 1992). These latter results provide evidence of direct involvement of type 2A phosphatases in transcription. Precisely how these phosphatases and their associated subunits regulate both protein synthesis and the activity of each of the three RNA polymerases is presently unknown.
Our results are consistent with a large body of evidence indicating that r-protein synthesis is regulated primarily at the level of transcription (Woolford and Warner, 1991). Indeed, it has become evident in recent years that great complexity exists in the regulation of r-protein genes in response to changes in nutrient availability. For example, it has been shown that these genes display a biphasic response during nutritional upshift, in which distinct regulatory mechanisms appear to govern an initial as well as a sustained increase in transcription (Griffioen et al., 1996). A model derived from these studies suggests that the initial response is independent of the growth potential of the cell, requires protein kinase A, and is regulated both by the Ras-adenylate cyclase pathway and by what has been termed the fermentable growth medium–induced pathway. This latter pathway is defined at present primarily operationally, where a strong initial increase in r-protein gene expression in the absence of adenylate cyclase activity requires a rich growth medium containing a fermentable carbon source (Thevelein, 1994). In contrast, a sustained increase in the transcription of r-protein genes does not require protein kinase A function but depends on the continued ability of cells to grow at an accelerated rate (Griffioen et al., 1996). Our results demonstrate that TOR signaling is essential for both of these steps because rapamycin treatment both inhibits steady-state expression of the r-protein genes as well as prevents their induction during nutritional upshift. The failure to induce r-protein genes during nutrient upshift in the presence of rapamycin could simply reflect a requirement for TOR signaling in general r-protein gene transcription under all conditions. Alternatively, TOR may be involved directly in the regulated expression of these genes in response to changes in nutrient availability. According to this second possibility, the TOR pathway is likely to be intimately tied to other signaling pathways involved in r-protein gene expression, possibly regulating their activity or sharing one or more components and/or targets. In this regard, it is interesting to note that the Ras-adenylate cyclase pathway affects many of the same functions regulated by TOR signaling, including nutritional control of the cell cycle, synthesis of storage carbohydrates, and entry into G0 (Thevelein, 1994). Furthermore, it has been demonstrated recently that BMH1 and BMH2, which encode yeast homologues of 14-3-3 proteins, are involved in the TOR pathway (Bertram et al., 1998). Because these proteins have been shown previously to be involved in Ras signaling, these results provide direct evidence of at least one shared component between these pathways.
At present we do not understand how loss of TOR function results in inhibition of r-protein gene transcription. We have shown this inhibition does not require ongoing protein synthesis, apparently excluding the requirement for de novo synthesis of a transcriptional repressor. We therefore favor the idea that repression involves modification of the activity of one or more factors involved in r-protein gene activation. One obvious candidate is Rap1, a DNA-binding protein that interacts with many r-protein gene promoters and is essential for r-protein gene expression (Woolford and Warner, 1991). Rap1 has been shown to be involved in r-protein gene activation by the Ras-adenylate cyclase pathway (Neuman-Silverberg et al., 1995). This factor is also involved in transcriptional silencing at the mating type loci and at telomeres (Shore, 1994). Recently Rap1 has been shown to be involved in repression of r-protein gene transcription in response to perturbation of the secretory pathway (Mizuta et al., 1998). Specifically, it has been observed that cells expressing a deletion mutation in the RAP1 gene, the rap1-17 allele, fail to repress r-protein gene transcription at the nonpermissive temperature in temperature-sensitive sec mutants. In contrast, we have found that rapamycin inhibits r-protein gene expression equally well in both wild-type and rap1-17 cells (our unpublished results). These results suggest that the TOR pathway regulates r-protein gene expression by a mechanism that is distinct from the signaling pathway that responds to secretory defects. These results do not exclude the possibility, however, that Rap1 is nevertheless important for regulation of r-protein genes by the TOR pathway. Other candidate factors include Abf1, which also controls the activity of many r-protein genes, as well as Gcr1, a protein required for the activity of both r-protein genes as well as genes involved in glycolysis (Santangelo and Tornow, 1990; Tornow et al., 1993). In support of possible involvement of Gcr1 in TOR signaling, we have observed that rapamycin also severely inhibits expression of several glycolytic genes, including ADH1, ENO1, and PGK1 (our unpublished results).
Our results presented here are in apparent contrast to what has been reported previously for mammalian cells, in which regulation of r-protein synthesis by the TOR pathway is at the level of translational initiation (Jefferies and Thomas, 1996; Meyuhas et al., 1996; Thomas and Hall, 1997). These differences are consistent with the fact that in yeast r-protein mRNAs lack 5′TOP sequences and phosphorylation of ribosomal protein S6 is not essential for normal cell growth (Johnson and Warner, 1987), features that are required for the observed translational regulation in mammalian cells. On the other hand, it has not been reported whether rapamycin affects r-protein gene transcription in mammalian cells. Thus it is conceivable that the shift in distribution of 5′TOP mRNAs from polyribosomes to lower molecular weight ribonucleoprotein particles, observed after serum starvation or upon rapamycin treatment, pertains only to previously synthesized transcripts. According to this scenario, transcriptional control of r-protein gene expression would be a common feature among all eucaryotes, whereas translational regulation, via 5′TOP sequences, would represent an additional level of complexity that is restricted to metazoans. This scenario is consistent with evidence indicating that transcription of rRNA genes by RNA Pol I is inhibited by rapamycin in mammalian cells (Mahajan, 1994; Leicht et al., 1996).
Direct control of rRNA and r-protein gene expression by the TOR pathway is consistent with the observed tight coupling that exists between nutrient availability and ribosome synthesis in yeast (Woolford and Warner, 1991; Kraakman et al., 1993; Ju and Warner, 1994). Moreover, as in mammalian cells, by regulating both translational initiation as well as production of new ribosomes, this pathway provides an efficient means by which to alter the overall protein biosynthetic capacity of the cell. The challenge now at hand is to understand how these processes are controlled at the molecular level. Furthermore, TOR signaling governs many important physiological changes in response to nutrient status, many of which require complex changes in gene expression (Barbet et al., 1996) (Cao and Brown, personal communication). Whether each of these responses is strictly the result of changes in protein biosynthesis or whether the TOR pathway plays additional, possibly more direct roles in these processes is an important question. Finally, the mechanism by which the presence of nutrients activates this pathway remains unknown. Only by identifying additional components within this pathway and by understanding their function can we expect to provide answers to these questions.
ACKNOWLEDGMENTS
We thank M. Altmann, G. Crabtree, D. Fiorentino, M. Hall, K. Mizuta, D. Ng, A. Sachs, S. Wells, and J. Warner for antibodies, plasmids, and strains. We thank C. Cao and P. Brown for communication of unpublished results. We are grateful to M. Niwa for advice, encouragement, and discussions throughout the course of these experiments. We also thank Paul Dazin for his help with flow cytometry, V. Denik, J. Nunnari, and J. Warner for discussions, and M. Niwa, C. Patil, G. Pesce, and C. Sidrauski for their comments on this manuscript. This work was supported by grants from the American Cancer Society (to T.P.) and the National Institutes of Health (to P.W.). P.W. is an Investigator of the Howard Hughes Medical Institute.
REFERENCES
- Barbet NC, Schneider U, Helliwell SB, Stansfield I, Tuite MF, Hall MN. TOR controls translation initiation and early G1 progression in yeast. Mol Biol Cell. 1996;7:25–42. doi: 10.1091/mbc.7.1.25. [DOI] [PMC free article] [PubMed] [Google Scholar]
- Beretta L, Gingras A-C, Svitkin YV, Hall MN, Sonenberg N. Rapamycin blocks the phosphorylation of 4E-BP1 and inhibits cap-dependent initiation of translation. EMBO J. 1996;15:658–664. [PMC free article] [PubMed] [Google Scholar]
- Berset C, Trachsel H, Altmann M. The TOR (target of rapamycin) signal transduction pathway regulates the stability of translation initiation factor eIF4G in the yeast Saccharomyces cerevisiae. Proc Natl Acad Sci USA. 1998;95:4264–4269. doi: 10.1073/pnas.95.8.4264. [DOI] [PMC free article] [PubMed] [Google Scholar]
- Bertram PG, Zeng C, Thorson J, Shaw AS, Zheng XFS. The 14-3-3 proteins positively regulate rapamycin-sensitive signaling. Curr Biol. 1998;8:1259–1267. doi: 10.1016/s0960-9822(07)00535-0. [DOI] [PubMed] [Google Scholar]
- Brawerman G. mRNA degradation in eukaryotic cells: an overview. In: Belasco JG, Brawerman G, editors. Control of mRNA Stability. San Diego: Academic; 1993. pp. 149–159. [Google Scholar]
- Dabeva MD, Warner JR. The yeast ribosomal protein L32 and its gene. J Biol Chem. 1987;262:16055–16059. [PubMed] [Google Scholar]
- Di Como CJ, Arndt KT. Nutrients, via the Tor proteins, stimulate the association of Tap42 with type 2A phosphatases. Genes Dev. 1996;10:1904–1916. doi: 10.1101/gad.10.15.1904. [DOI] [PubMed] [Google Scholar]
- Griffioen G, Laan RJ, Mager WH, Planta RJ. Ribosomal protein gene transcription in Saccharomyces cerevisiae shows a biphasic response to nutritional changes. Microbiology. 1996;142:2279–2287. doi: 10.1099/13500872-142-8-2279. [DOI] [PubMed] [Google Scholar]
- Griffioen G, Mager WH, Planta RJ. Nutritional upshift response of ribosomal protein gene transcription in Saccharomyces cerevisiae. FEMS Microbiol Lett. 1994;123:137–144. doi: 10.1111/j.1574-6968.1994.tb07213.x. [DOI] [PubMed] [Google Scholar]
- Heitman J, Movva NR, Hall MN. Targets for cell cycle arrest by the immunosuppressant rapamycin in yeast. Science. 1991;253:905–909. doi: 10.1126/science.1715094. [DOI] [PubMed] [Google Scholar]
- Helliwell SB, Wagner P, Kunz J, Deuter-Reinhard M, Henriquez R, Hall MN. TOR1 and TOR2 are structurally and functionally similar but not identical phosphatidylinositol kinase homologues in yeast. Mol Biol Cell. 1994;5:105–118. doi: 10.1091/mbc.5.1.105. [DOI] [PMC free article] [PubMed] [Google Scholar]
- Hill J, Donald KA, Griffiths DE, Donald G. DMSO-enhanced whole cell yeast transformation. Nucleic Acids Res. 1991;19:5791. doi: 10.1093/nar/19.20.5791. [DOI] [PMC free article] [PubMed] [Google Scholar]
- Jefferies HBJ, Fumagalli S, Dennis PB, Reinhard C, Pearson RB, Thomas G. Rapamycin suppresses 5′TOP mRNA translation through inhibition of p70s6k. EMBO J. 1997;16:3693–3704. doi: 10.1093/emboj/16.12.3693. [DOI] [PMC free article] [PubMed] [Google Scholar]
- Jefferies HBJ, Thomas G. Ribosomal protein S6 phosphorylation and signal transduction. In: Hershey JWB, Mathews MB, Sonenberg N, editors. Translational Control. Cold Spring Harbor, NY: Cold Spring Harbor Laboratory Press; 1996. pp. 389–409. [Google Scholar]
- Johnson SP, Warner JR. Phosphorylation of the Saccharomyces cerevisiae equivalent of ribosomal protein S6 has no detectable effect on growth. Mol Cell Biol. 1987;7:1338–1345. doi: 10.1128/mcb.7.4.1338. [DOI] [PMC free article] [PubMed] [Google Scholar]
- Ju Q, Warner JR. Ribosome synthesis during the growth cycle of Saccharomyces cerevisiae. Yeast. 1994;10:151–157. doi: 10.1002/yea.320100203. [DOI] [PubMed] [Google Scholar]
- Kief DR, Warner JR. Coordinate control of syntheses of rRNA and ribosomal proteins during nutritional shift-up in Saccharomyces cerevisiae. Mol Cell Biol. 1981;1:1007–1015. doi: 10.1128/mcb.1.11.1007. [DOI] [PMC free article] [PubMed] [Google Scholar]
- Kim CH, Warner JR. mRNA for ribosomal proteins in yeast. J Mol Biol. 1983;165:79–89. doi: 10.1016/s0022-2836(83)80243-5. [DOI] [PubMed] [Google Scholar]
- Kjeldgaard NO, Gausing K. Regulation of biosynthesis of ribosomes. In: Nomura M, Tissieres A, Lengyel P, editors. Ribosomes. Cold Spring Harbor, NY: Cold Spring Harbor Laboratory Press; 1974. pp. 369–392. [Google Scholar]
- Kohrer K, Domdey H. Preparation of high molecular weight RNA. Methods Enzymol. 1991;194:398–405. doi: 10.1016/0076-6879(91)94030-g. [DOI] [PubMed] [Google Scholar]
- Kraakman LS, Griffioen G, Zerp S, Groeneveld P, Thevelein JM, Mager WH, Planta RJ. Growth-related expression of ribosomal protein genes in Saccharomyces cerevisiae. Mol Gen Genet. 1993;239:196–204. doi: 10.1007/BF00281618. [DOI] [PubMed] [Google Scholar]
- Leicht M, Simm A, Bertsch G, Hoppe J. Okadaic acid induces cellular hypertrophy in AKR-2B fibroblasts: involvement of the p70S6 kinase in the onset of protein and rRNA synthesis. Cell Growth Differ. 1996;7:1199–1209. [PubMed] [Google Scholar]
- Mahajan PB. Modulation of transcription of rRNA genes by rapamycin. Int J Immunopharmacol. 1994;16:711–721. doi: 10.1016/0192-0561(94)90091-4. [DOI] [PubMed] [Google Scholar]
- Meyuhas O, Avni D, Shama S. Translational control of ribosomal protein mRNAs in eukaryotes. In: Hershey JWB, Mathews MB, Sonenberg N, editors. Translational Control. Cold Spring Harbor, NY: Cold Spring Harbor Laboratory Press; 1996. pp. 363–388. [Google Scholar]
- Mizuta K, Tsujii R, Warner JR, Nishiyama M. The C-terminal silencing domain of Rap1p is essential for the repression of ribosomal protein genes in response to a defect in the secretory pathway. Nucleic Acids Res. 1998;26:1063–1069. doi: 10.1093/nar/26.4.1063. [DOI] [PMC free article] [PubMed] [Google Scholar]
- Mizuta K, Warner JR. Continued functioning of the secretory pathway is essential for ribosome synthesis. Mol Cell Biol. 1994;14:2493–2502. doi: 10.1128/mcb.14.4.2493. [DOI] [PMC free article] [PubMed] [Google Scholar]
- Naranda T, MacMillan SE, Hershey JWB. Purified yeast translational initiation factor eIF-3 is an RNA-binding protein complex that contains the PRT1 protein. J Biol Chem. 1994;269:32286–32292. [PubMed] [Google Scholar]
- Nash R, Tokiwa G, Anand S, Erickson K, Futcher AB. The WHI1+ gene of Saccharomyces cerevisiae tethers cell division to cell size and is a cyclin homolog. EMBO J. 1988;7:4335–4346. doi: 10.1002/j.1460-2075.1988.tb03332.x. [DOI] [PMC free article] [PubMed] [Google Scholar]
- Neuman-Silverberg FS, Bhattacharya S, Broach JR. Nutrient availability and the RAS/cyclic AMP pathway both induce expression of ribosomal protein genes in Saccharomyces cerevisiae but by different mechanisms. Mol Cell Biol. 1995;15:3187–3196. doi: 10.1128/mcb.15.6.3187. [DOI] [PMC free article] [PubMed] [Google Scholar]
- Ng DTW, Brown JD, Walter P. Signal sequences specify the targeting route to the endoplasmic reticulum. J Cell Biol. 1996;134:269–278. doi: 10.1083/jcb.134.2.269. [DOI] [PMC free article] [PubMed] [Google Scholar]
- Noda T, Ohsumi Y. Tor, a phosphatidylinositol kinase homologue, controls autophagy in yeast. J Biol Chem. 1998;273:3963–3966. doi: 10.1074/jbc.273.7.3963. [DOI] [PubMed] [Google Scholar]
- Pedersen S, Celis JE, Nielsen J, Christiansen J, Nielsen FC. Distinct repression of translation by wortmannin and rapamycin. Eur J Biochem. 1997;247:449–456. doi: 10.1111/j.1432-1033.1997.00449.x. [DOI] [PubMed] [Google Scholar]
- Phan L, Zhang X, Asano K, Anderson J, Vornlocher H-P, Greenberg JR, Qin J, Hinnebusch AG. Identification of a translation initiation factor 3 (eIF3) core complex, conserved in yeast and mammals, that interacts with eIF5. Mol Cell Biol. 1998;18:4935–4946. doi: 10.1128/mcb.18.8.4935. [DOI] [PMC free article] [PubMed] [Google Scholar]
- Polymenis M, Schmidt EV. Coupling of cell division to cell growth by translational control of the G1 cyclin CLN3 in yeast. Genes Dev. 1997;11:2522–2531. doi: 10.1101/gad.11.19.2522. [DOI] [PMC free article] [PubMed] [Google Scholar]
- Rose MD, Novick P, Thomas JH, Botstein D, Fink GR. A Saccharomyces cerevisiae genomic plasmid bank based on a centromere-containing shuttle vector. Gene. 1987;60:237–243. doi: 10.1016/0378-1119(87)90232-0. [DOI] [PubMed] [Google Scholar]
- Santangelo GM, Tornow J. Efficient transcription of the glycolytic gene ADH1 and three translational component genes requires the GCR1 product, which can act through TUF/GRF/RAP binding sites. Mol Cell Biol. 1990;10:859–862. doi: 10.1128/mcb.10.2.859. [DOI] [PMC free article] [PubMed] [Google Scholar]
- Schmidt A, Bickle M, Beck T, Hall MN. The yeast phosphatidylinositol kinase homolog TOR2 activates RHO1 and RHO2 via the exchange factor ROM2. Cell. 1997;88:531–542. doi: 10.1016/s0092-8674(00)81893-0. [DOI] [PubMed] [Google Scholar]
- Schmidt A, Kunz J, Hall MN. TOR2 is required for organization of the actin cytoskeleton. Proc Natl Acad Sci USA. 1996;93:13780–13785. doi: 10.1073/pnas.93.24.13780. [DOI] [PMC free article] [PubMed] [Google Scholar]
- Sherman F. Getting started with yeast. Methods Enzymol. 1991;194:3–21. doi: 10.1016/0076-6879(91)94004-v. [DOI] [PubMed] [Google Scholar]
- Shore D. RAP1: a protean regulator in yeast. Trends Genet. 1994;10:408–412. doi: 10.1016/0168-9525(94)90058-2. [DOI] [PubMed] [Google Scholar]
- Sikorski RS, Heiter P. A system of shuttle vectors and yeast host strains designed for efficient manipulation of DNA in Saccharomyces cerevisiae. Genetics. 1989;122:19–27. doi: 10.1093/genetics/122.1.19. [DOI] [PMC free article] [PubMed] [Google Scholar]
- Thevelein JM. Signal transduction in yeast. Yeast. 1994;10:1753–1790. doi: 10.1002/yea.320101308. [DOI] [PubMed] [Google Scholar]
- Thomas G, Hall MN. TOR signaling and control of cell growth. Curr Opin Cell Biol. 1997;9:782–787. doi: 10.1016/s0955-0674(97)80078-6. [DOI] [PubMed] [Google Scholar]
- Tornow J, Zeng X, Gao W, Santangelo GM. GCR1, a transcriptional activator in Saccharomyces cerevisiae, complexes with RAP1 and can function without its DNA binding domain. EMBO J. 1993;12:2431–2437. doi: 10.1002/j.1460-2075.1993.tb05897.x. [DOI] [PMC free article] [PubMed] [Google Scholar]
- Udem SA, Warner JR. rRNA synthesis in Saccharomyces cerevisiae. J Mol Biol. 1972;65:227–242. doi: 10.1016/0022-2836(72)90279-3. [DOI] [PubMed] [Google Scholar]
- van Zyl W, Huang W, Sneddon AA, Stark M, Camier S, Werner M, Marck C, Sentenac A, Broach JR. Inactivation of the protein phosphatase 2A regulatory subunit A results in morphological and transcriptional defects in Saccharomyces cerevisiae. Mol Cell Biol. 1992;12:4946–4959. doi: 10.1128/mcb.12.11.4946. [DOI] [PMC free article] [PubMed] [Google Scholar]
- Warner J. Labeling of RNA and phosphoproteins in Saccharomyces cerevisiae. Methods Enzymol. 1991;194:423–428. doi: 10.1016/0076-6879(91)94033-9. [DOI] [PubMed] [Google Scholar]
- Woolford JL, Jr, Warner JR. The ribosome and its synthesis. In: Broach JR, Pringle JR, Jones EW, editors. The Molecular Biology and Cellular Biology of the Yeast Saccharomyces cerevisiae. Cold Spring Harbor, NY: Cold Spring Harbor Laboratory Press; 1991. pp. 587–626. [Google Scholar]
- Zaragoza D, Ghavidel A, Heitman J, Schultz MC. Rapamycin induces the G0 program of transcriptional repression in yeast by interfering with the TOR signaling pathway. Mol Cell Biol. 1998;18:4463–4470. doi: 10.1128/mcb.18.8.4463. [DOI] [PMC free article] [PubMed] [Google Scholar]
- Zheng X-F, Fiorentino D, Chen J, Crabtree GR, Schreiber SL. TOR kinase domains are required for two distinct functions, only one of which is inhibited by rapamycin. Cell. 1995;82:121–130. doi: 10.1016/0092-8674(95)90058-6. [DOI] [PubMed] [Google Scholar]
- Zheng X-F, Schreiber SL. Target of rapamycin proteins and their kinase activities are required for meiosis. Proc Natl Acad Sci USA. 1997;94:3070–3075. doi: 10.1073/pnas.94.7.3070. [DOI] [PMC free article] [PubMed] [Google Scholar]


