Abstract
We have addressed the question of whether or not Golgi fragmentation, as exemplified by that occurring during drug-induced microtubule depolymerization, is accompanied by the separation of Golgi subcompartments one from another. Scattering kinetics of Golgi subcompartments during microtubule disassembly and reassembly following reversible nocodazole exposure was inferred from multimarker analysis of protein distribution. Stably expressed α-2,6-sialyltransferase and N-acetylglucosaminyltransferase-I (NAGT-I), both C-terminally tagged with the myc epitope, provided markers for the trans-Golgi/trans-Golgi network (TGN) and medial-Golgi, respectively, in Vero cells. Using immunogold labeling, the chimeric proteins were polarized within the Golgi stack. Total cellular distributions of recombinant proteins were assessed by immunofluorescence (anti-myc monoclonal antibody) with respect to the endogenous protein, β-1,4-galactosyltransferase (GalT, trans-Golgi/TGN, polyclonal antibody). ERGIC-53 served as a marker for the intermediate compartment). In HeLa cells, distribution of endogenous GalT was compared with transfected rat α-mannosidase II (medial-Golgi, polyclonal antibody). After a 1-h nocodazole treatment, Vero α-2,6-sialyltransferase and GalT were found in scattered cytoplasmic patches that increased in number over time. Initially these structures were often negative for NAGT-I, but over a two- to threefold slower time course, NAGT-I colocalized with α-2,6-sialyltransferase and GalT. Scattered Golgi elements were located in proximity to ERGIC-53-positive structures. Similar trans-first scattering kinetics was seen with the HeLa GalT/α-mannosidase II pairing. Following nocodazole removal, all cisternal markers accumulated at the same rate in a juxtanuclear Golgi. Accumulation of cisternal proteins in scattered Golgi elements was not blocked by microinjected GTPγS at a concentration sufficient to inhibit secretory processes. Redistribution of Golgi proteins from endoplasmic reticulum to scattered structures following brefeldin A removal in the presence of nocodazole was not blocked by GTPγS. We conclude that Golgi subcompartments can separate one from the other. We discuss how direct trafficking of Golgi proteins from the TGN/trans-Golgi to endoplasmic reticulum may explain the observed trans-first scattering of Golgi transferases in response to microtubule depolymerization.
INTRODUCTION
The Golgi complex plays an important role in processing, maturation, and sorting of newly synthesized secretory and membrane proteins received from the endoplasmic reticulum (ER) and in recycling receptors involved in endocytosis (for review, see Palade, 1975; Rothman, 1994). The Golgi complex may be considered to be composed of three distinct subcompartments: the cis-Golgi network (CGN)/cis-Golgi, the medial-Golgi stack, and the trans-Golgi/trans-Golgi network (TGN) (Mellman and Simons, 1992). The CGN/cis-Golgi receives proteins from the intermediate compartment (IC), is involved in retrieval of a subset of these proteins back to the ER, and plays a role in initial Golgi-specific carbohydrate addition and trimming reactions. The medial-Golgi stack functions as a glycosylation compartment where most of the addition and trimming of carbohydrate moieties take place. The exit side of the Golgi complex is the trans-Golgi/TGN, which plays an essential role in final glycosylation reactions and the sorting of plasma membrane, lysosomal, and secretory proteins to their respective final destinations.
The glycosylation enzymes that modify N-linked oligosaccharides have been hypothesized to be present within the Golgi in the order in which they act (for review, see Dunphy and Rothman, 1985; Kornfeld and Kornfeld, 1985). Morphological data, however, indicate that, contrary to expectation, there is appreciable overlap in the distribution of oligosaccharide-processing enzymes located in the medial-Golgi stack and TGN. In double immunogold labeling experiments, medial enzymes, N-acetylglucosaminyltransferase I (NAGT-I) and α-mannosidase II (Mann-II), and the two more trans enzymes, β-1,4-galactosyltransferase (GalT) and α-2,6-sialyltransferase (ST), overlapped in distribution. About 60% of NAGT-I and Mann-II labeling was in medial-Golgi cisternae, one-third in trans-Golgi cisternae, and essentially none in TGN, whereas for both GalT and ST 60% of labeling was in TGN, ∼40% in trans-Golgi cisternae, and essentially none in medial cisternae (Nilsson et al., 1993; Rabouille et al., 1995a). Hence, proteins such as NAGT-I, Mann-II, GalT, and ST are better thought of as markers for a broader region of the Golgi complex rather than for one specific cisterna. For convenience NAGT-I and Mann-II will be referred to as medial-Golgi/trans-Golgi marker enzymes and GalT/ST as trans-Golgi/TGN enzymes. At the opposite side of the Golgi complex, ERGIC-53 (for review, see Hauri and Schweizer, 1992), a membrane protein with mannose-specific lectin activity (Arar et al., 1995) that appears to shuttle between ER and Golgi, can, at 37°C, be used as a marker of the IC/CGN.
Microtubules play a central role in the juxtanuclear localization of the Golgi complex. Agents that alter the distribution of microtubules have a profound effect on the distribution and integrity of the Golgi complex. A dramatic example of this is the reversible scattering of the Golgi complex after nocodazole-induced microtubule depolymerization. Electron microscopy reveals that the fully scattered Golgi fragments are composed of short, stacked cisternae that resemble intact Golgi stacks (Thyberg and Moskalewski, 1985; Ho et al., 1989). Under this condition newly synthesized proteins may still be transported through and modified by the Golgi complex (Rogalski et al., 1984; Iida and Shibata, 1991), albeit, with a time lag as revealed by the recent experiments of Cole et al. (1996). After drug removal, the Golgi elements translocate along the newly repolymerized microtubules leading to reassembly of an intact Golgi complex (Ho et al., 1989). Fragmentation of the Golgi complex is also seen with microinjection of dominant mutant rab proteins (Nuoffer et al., 1994; Wilson et al., 1994; Zhang et al., 1994) or anti-dynein heavy chain 2 antibodies (Vaisberg et al., 1996). Dispersal of the Golgi complex to the ER is induced by the drug brefeldin A (BFA, e.g., Lippincott-Schwartz et al., 1990) and overexpression of rab6 (Martinez et al., 1997). In cells treated with the drug, ilimaquinone, the Golgi is dispersed to vesicles (Takizawa et al., 1993; Veit et al., 1993). In all cases, the resulting dynamics in organelle structure are likely to be a consequence of the disruption of the normal balance between differing routes of Golgi membrane trafficking and coalescence.
Many models have been proposed for trafficking of proteins through the Golgi complex including tubular connections among Golgi cisterna, cisternal progression and maturation, coat protein I (COPI) vesicle-mediated recycling of resident Golgi proteins, and COPI vesicle-mediated anterograde transport of cargo proteins (for a recent review, see Schekman and Mellman, 1997). Evidence has recently been presented for retrograde recycling of resident Golgi enzymes through early Golgi subcompartments (Hoe et al., 1995; Harris and Water, 1996) and the ER (Cole et al., 1996). At its extremes, retrograde trafficking of Golgi proteins may be either through a sequential, repetitive pathway in which each stage of retrograde transport results in the transfer of proteins one step backward to the adjacent downstream subcompartment (so-called countercurrent flow) or through a direct pathway to the ER from individual Golgi subcompartments followed by subsequent sorting of proteins via anterograde trafficking (so-called cross-current flow, for speculative modeling, see, Rothman, 1981; Rothman and Warren, 1994; Rothman and Wieland, 1996). Of course, in reality, Golgi retrograde trafficking may occur via some combination of these two pathways. If as predicted by Cole et al. (1996) the redistribution of Golgi proteins to scattered Golgi elements during microtubule depolymerization is a consequence of blocked microtubule-dependent Golgi coalescence after protein exit from the ER, then countercurrent cycling should lead to medial proteins scattering before trans/TGN proteins whereas cross-current recycling (direct ER pathway) could well give the opposite result.
Here, we have addressed the question of whether or not Golgi fragmentation, as exemplified by that occurring during drug-induced microtubule depolymerization, is accompanied by the separation of Golgi subcompartments one from another. We have characterized the scattering in response to nocodazole challenge of individual Golgi resident proteins located in different Golgi subcompartments. We describe the redistribution of four resident Golgi cisternal, type II transmembrane proteins: ST, GalT, NAGT-I, and Mann-II, and an IC to CGN type I transmembrane protein: ERGIC-53. The aim here was to ask to what extent Golgi scattering might produce subcompartment separation, perhaps based on retrograde trafficking. We found in comparing the kinetics of scattering of trans/TGN and medial-Golgi proteins following nocodazole addition, that the trans/TGN proteins scattered first. This process was not blocked by the nonhydrolyzable GTP analogue, GTPγS, nor was the formation of scattered Golgi structures following BFA removal in the presence of nocodazole. We infer that Golgi subcompartments can be separated one from the other based on what may be normal membrane-trafficking pathways. These results are inconsistent with sequential, countercurrent models for retrograde trafficking within the Golgi complex (Rothman, 1981; Rothman and Warren, 1994; Rothman and Wieland, 1996). We discuss the possibility of direct, cross-current trafficking of Golgi proteins from the TGN/trans-Golgi to ER followed by subsequent accumulation at or about ER exit sites as an explanation of the observed trans-first scattering of Golgi transferases in response to microtubule depolymerization.
MATERIALS AND METHODS
Reagents
Restriction enzymes were purchased from Promega (Madison, WI) or New England Biolabs (Bainbury, MA). Cell culture reagents were purchased from Life Technologies (Grand Island, NY) and fetal bovine serum from Hyclone Laboratories, Inc. (Logan, UT). Enhanced chemiluminescence reagents (ECL) were purchased from Amersham Life Sciences (Arlington Heights, IL). GTPγS was purchased from Boehringer Mannheim (Mannheim, Germany). 9E10 mouse monoclonal antibody (mAb) against a myc peptide (Evan et al., 1985) was diluted from an ascites preparation for most purposes. For immunoelectron microscopy a hybridoma supernatant was used (gift from Dr. R. Parton, European Molecular Biology Laboratory (EMBL)-Heidelberg, Heidelberg, Germany). G1/93 mouse mAb against human ERGIC-53 was a gift from Dr. H.-P. Hauri (Biozentrum, Basel, Switzerland) (Schweizer et al., 1988). Mouse mAbs directed against chicken α-tubulin were purchased from Sigma Chemical Company (St. Louis, MO) or Amersham Life Sciences. Rabbit polyclonal antibodies directed against the 9E10 peptide were a gift from Dr. J. Burkhardt (EMBL-Heielberg). Rabbit polyclonal antibodies directed against bovine GalT and diluted in a bovine serum albumin saline stabilizer solution as a stock solution were a gift from Dr. J. Shaper (Oncology, Johns Hopkins University School of Medicine, Baltimore, MD). Rabbit polyclonal antibodies directed against vesicular stomatitis virus (VSV) G protein were a gift from Dr. K. Simons (EMBL-Heidelberg). Rabbit polyclonal antibodies against mouse IgG and their horseradish peroxidase conjugate were purchased from Sigma Chemical and rabbit polyclonal antibodies against rat Mann-II were purchased from Dr. K. Moremen (University of Georgia, Athens, GA). Ten nanometers protein A-gold were prepared as described (Slot et al., 1991).
Recombinant DNA
The human NAGT-I cDNA (Kumar et al., 1990) with a myc epitope at its extreme carboxyl terminus was prepared by Dr. T. Nilsson in pSRα expression vector (Nilsson et al., 1993) and was a gift from Dr. T. Nilsson (EMBL-Heidelberg). A full-length human ST containing a C-terminal P5D4 VSV epitope (Rabouille et al., 1995a; generously provided by Dr. S. Munro, Medical Research Council, Cambridge, United Kingdom) was used as a template for the polymerase cahin reaction to place the 9E10 myc epitope (Evan et al., 1985) at the carboxyl terminus of ST, replacing the P5D4 epitope. This was done so that both transfected glycosyltransferases could be localized with the same antibody. The primers were: 5′ primer, 5′-GGATCCGGATCCCATATGATTCACACCAACCTGAAG-3′, and 3′ primer, 5′-GATCCGGATCCTTACAGGTCTTCTTCAGAGATCAGTTTCTGTTCAGGCAGTGAATGGTCCGGAAGCC-3′. The bases encoding the myc epitope are underlined. The polymerase chain reaction product was digested by BamHI and the resulting DNA was ligated into pSRα at the BamHI site. Recombinant plasmids containing ST-myc with correct orientation with respect to the promoter were selected by restriction enzyme digestion and subsequently confirmed by DNA sequencing.
Cell Culture, Transfection, and Infection with tsO45 VSV
Monolayer Vero (African green monkey kidney cells, ATCC CCL 81) cells were cultured in minimal essentail medium supplemented with 10% heat-inactivated fetal calf serum. Mann-II HeLa cells (a gift from Dr. T. Nilsson, EMBL-Heidelberg; Rabouille et al., 1995) were cultured in DMEM supplemented with 10% fetal calf serum and 200 μg/ml Geneticin (G418 sulfate). All cells were routinely grown in 100-mm plastic tissue culture dishes. The cultures were maintained at 37°C in a humidified 5% CO2 incubator.
For DNA transfection, Vero cells were seeded at 1 × 10⁶ cells per 100-mm dish 1 d before transfection so that the cells were approximately 70% confluent on the day of transfection. The plasmid DNAs pSRα-NAGT-I-myc or pSRα-ST-myc were purified using CsCl2 gradient centrifugation according to standard methods and dissolved in distilled water at 1 mg/ml final concentration. The calcium phosphate method (Chen and Okyama, 1987) was used for transfection using approximately 20 μg of DNA for each transfection. The precipitate was left in contact with the cells for 16 h. Cells were then rinsed once with PBS and once with calcium- and magnesium-free medium before additional incubation in complete medium. In transient expression experiments, cells were analyzed by indirect immunofluorescence microscopy 24–36 h after transfection. In stable expression experiments, cells were maintained in the above medium containing 600 μg/ml Geneticin for 2 wk before isolating individual clones. Clones were screened by immunofluorescence using 9E10. Almost 100% of the cells were positive for the myc-epitope. ST- and NAGT-I-myc Vero cells were maintained in the presence of 200 μg/ml Geneticin and recultured from frozen stocks about every 4 wk. Expression of NAGT-I-myc was more stable than ST-myc (80%+ versus ∼66% positive after 6 wk of continuous culture).
Cells were infected with the ts-O45 VSV and maintained at nonpermissive or permissive conditions for analysis of transport of ts-O45-G protein from the ER as previously described (Storrie et al., 1994). ts-O45 VSV stock was a gift from Dr. K. Simons (EMBL-Heidelberg).
Preparation of Golgi Fractions and Immunoblotting
ST- and NAGT-myc were solubilized from isolated Vero Golgi fractions for immunoblotting. Golgi fractions were prepared by minor variations of the flotation procedure of Balch et al. (1984). In brief, for each preparation, cells were harvested by trypsinization from three-confluent 530-cm2 Nunc tissue culture trays. Trypsin activity was quenched with complete culture medium. Washed cells were then homogenized on ice in the presence of protease inhibitors by repeated passage through a 25-gauge syringe needle. The total homogenate was then brought to a sucrose concentration of 1.37 M and Golgi was separated from soluble and many membrane components by flotation in a sucrose step gradient in a Beckman SW40 centrifuge rotor (Fullerton, CA) at 4°C. Golgi fractions were collected at the 0.8/1.2 M sucrose interface. The collected fractions were diluted with 0.25 M sucrose containing protease inhibitors and membranous organelles were pelleted by centrifugation in a SW40 rotor at 25,000 rpm for 30 min. Pellets were resuspended in 100 μl of 0.25 M sucrose, quick frozen with liquid N2, and stored at −80°C. Fractions were solubilized by the addition of 3× Laemmli sample buffer (Laemmli, 1970), heated to 95°C, and polypeptides were separated by SDS-PAGE in a Bio-Rad mini-slab gel apparatus (Richmond, CA). Transfer from gel to nitrocellulose was with a Bio-Rad semidry transfer apparatus. Nonspecific binding to the nitrocellullose was blocked with 0.1% Tween 20 and 5% dried milk in PBS. 9E10 was diluted in blocking buffer as was the horseradish peroxidase-conjugated rabbit anti–mouse IgG secondary antibody. ECL reaction product was developed according to the manufacturer’s recommendation. Polypeptide mobility was determined relative to prestained high molecular weight protein standards (Sigma Chemical).
Drug Treatments and Microinjection
Nocodazole was obtained from Sigma Chemical and stored as a 10 mM stock solution in dimethylsulfoxide at −20°C. Immediately before use, stock drug solutions were diluted to final concentration in complete culture medium. Coverslip cultured cells were incubated at 37°C with 10 μM nocodazole or 5 μg/ml BFA (Epicentre Technology, Madison, WI) for various time periods. For drug removal, coverslip cultured cells were transferred three times to fresh dishes containing complete culture medium and then incubated in culture medium supplemented as appropriate at 37°C for various time periods. Cells were treated with cycloheximide (Storrie et al., 1994) and cytochalasin D (Ho et al., 1990) as previously described.
Cells were microinjected with GTPγS, 30 min prior to the addition of nocodazole or shifting ts-O45 VSV-infected cells to permissive temperature using a Zeiss automated injection system (AIS, Carl Zeiss, Jena, Germany). Diluted GTPγS solutions were prepared by diluting aliquots of a 10 mM GTPγS stock solution stored at −20°C to 500 μM in 140 mM KCl and 1 mg/ml aldehyde fixable fluorescein dextran (70 kDa, Molecular Probes, Eugene, OR). Stock GTPγS aliquots were thawed once and used within 1 month of preparation. The injected volume was between 5 and 10% of the total cell volume.
Immunogold Staining of Cryosections and Scoring of Immunogold Distribution across the Golgi Stack
ST- and NAGT-I-myc Vero cells were grown attached to the surface of 100-mm tissue culture dishes in complete medium for 48 h before use. Cells were detached by proteinase K treatment and fixed in 8% formaldehyde as described previously (Griffiths et al., 1984). Ultrathin cryosections were prepared and labeled with antibodies and 10 nm protein A-gold with one significant modification of previously described procedures (Slot et al., 1991); rabbit anti-mouse IgG antibodies were used as bridging antibodies between the mouse monoclonal antibodies and protein A-gold. Quantitation of distribution was performed on Golgi stacks cut perpendicularly to Golgi cisternal profiles in a manner similar to that of Orci et al. (1997) in scoring coatomer, KDEL receptor, and proinsulin distribution. The Golgi was split into three portions for scoring: the outermost cisternae and associated structures facing toward the cell periphery (→ Cell Surface), the medial-Golgi cisterna, and the innermost cisternae and associated structures facing toward the cell nucleus (→ Nucleus). The distribution of single label immunogold particles in association with each portion was scored on micrographs taken at magnifications between 11,800 and 24,700 and printed as full size images on 8- × 10-inch photographic paper.
Immunofluorescence Microscopy
Cells were grown attached to 10-mm round glass coverslips in complete medium for 24 to 48 h before use. After appropriate drug treatment, microinjected cultures were processed in one of two ways: those labeled for localization of Golgi components were fixed with paraformaldehyde and permeabilized with either saponin (Méresse et al. 1995) or 0.1% Triton X-100, whereas those labeled for tubulin distribution were fixed with paraformaldehyde-glutaraldehyde followed by Triton X-100 extraction (see Herzog et al., 1994). In all other situations, cells were transferred directly to −20°C methanol for 4 min (Ho et al., 1990). Double-label antibody combinations were: GalT/myc (9E10), ERGIC-53 (G1/93)/GalT, ERGIC-53 (G1/93)/myc (rabbit polyclonal antibodies), fixable fluorescein isothiocyanate (FITC)-dextran/myc (9E10 or rabbit polyclonal antibodies), and fixable dextran/tubulin. Secondary antibodies raised in donkeys or goats were purchased from Jackson Immunoresearch (West Grove, PA). Non-cross-reactive combinations of FITC, rhodamine, and Texas Red secondary antibodies were used. In some single-label experiments, Cy3-conjugated secondary antibodies were used. Coverslips were mounted in Mowiol. Cells were observed with either a Zeiss IM-35/Axiovert TV100 inverted microscope or a Zeiss Axiophot microscope fitted with a Zeiss planapochromat (63×, numerical aperture 1.40, oil immersion objective). Fluorescein, rhodamine/Cy3, and Texas Red fluorescence were observed with selective Zeiss filter sets. No bleed-through between fluorescence channels was observed. In most experiments, cells were photographed on Kodak TMAX 3200 film for scoring of cytoplasmic Golgi patches and colocalization comparisons. Focal planes for photography were selected to give the maximal number of in-focus scattered, fluorescent Golgi patches.
In some experiments, cells were photographed with either a Photometrics SenSys charge-coupled device (CCD) camera (Photometrics, Phoenix, AZ, 1317 × 1024 pixel Kodak chip) or a Hamamatsu 3-chip color CCD camera (Hamamatsu City, Japan, three 768 × 512 pixel chips). The Photometrics camera was controlled with IPLab Spectrum software (Signal Analytics, Vienna, VA) and the Hamamatsu camera with OpenLab software (Improvision, London, United Kingdom). To correct for pixel shifts resulting from use of separate dichroic mirrors for multilabel fluorescence visualization with the Zeiss IM35 microscope, cells were stained with mixed, differentially conjugated, secondary antibodies to the same primary antibody and photographed with the Photometrics camera. Using the IPLab Spectrum Multiprobe software extension, standard pixel shift corrections were determined averaging observed pixel shifts for a number of different image pairs.
Scoring of Number of Cytoplasmic Fluorescent Patches
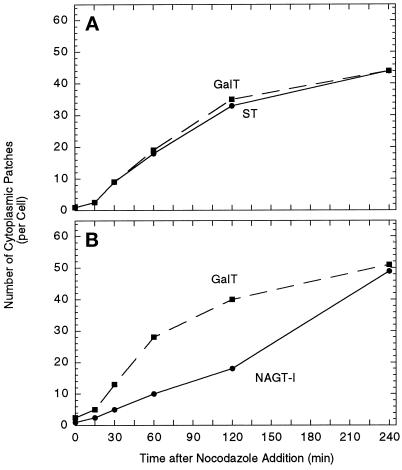
Fluorescent micrographs photographed to 35-mm film were printed at an end magnification of 1200×. Images of similar contrast and intensity for each pairing were overlaid with a grid. Golgi protein-positive scattered punctate structures were marked on the grid with a pen and counted excluding the immediate juxtanuclear Golgi complex. For each time point, approximately 30 cells were scored, with a range of 28–33. For each experimental condition, three experiments were performed in the course of establishing the optimal time course for scoring. The overall kinetics appeared identical within each experimental set. Scoring of two representative experiments are shown for GalT distributions providing an indication of data variation (compare A and B in Figure 6 and A and B in Figure 9).
Figure 6.
The effect of nocodazole treatment on the number of cytoplasmic patches per cell positive for GalT/ST (A) and GalT/NAGT-I (B). Micrographs from the experiments described in Figure 5 were scored for marker distribution. The results of representative experiments are shown.
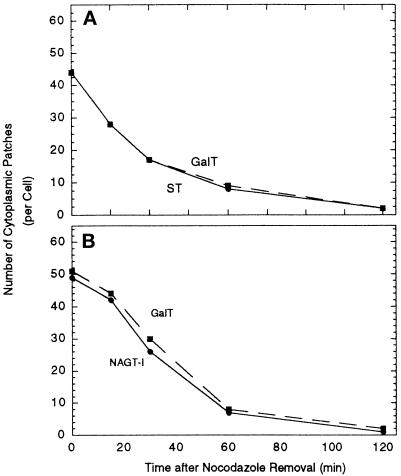
Figure 9.
The effect of nocodazole removal on the number of cytoplasmic patches per cell positive for GalT/ST and GalT/NAGT-I. Micrographs in the experiments described in Figure 8 were scored for overall marker protein distribution patterns.
RESULTS
Our goal was to examine the effect of microtubule polymerization status on individual Golgi proteins and, by inference, on individual subcompartments of the Golgi complex. Because of the lack of available antibodies to Golgi proteins in well-spread primate cells, we decided to produce separate Vero cell clones stably expressing ST-myc or NAGT-I-myc. GalT and ERGIC-53 were localized in Vero cells using antibodies to endogenous proteins. In ST or NAGT-I transfectants, the distributions of the different markers could be characterized by appropriate pairwise double-label immunofluorescent staining. Typically, GalT was paired with ST- or NAGT-I-myc and in some experiments ERGIC-53 was paired with ST- or NAGT-myc. In preliminary experiments, no cross-reactivity of polyclonal antibodies against TGN 46, the human homologue of the TGN marker protein TGN 38 (Banting, personal communication), with Vero cells was observed (Storrie, Banting and Kreis, unpublished observations). Hence, no marker restricted to the TGN was included in these studies. In some experiments, the redistribution of a second medial marker, Mann-II, was compared with that of GalT using a rat Mann-II transfected HeLa cell line (Rabouille et al., 1995a).
Characterization of Stable Vero Cell Lines Expressing ST- and NAGT-I-myc
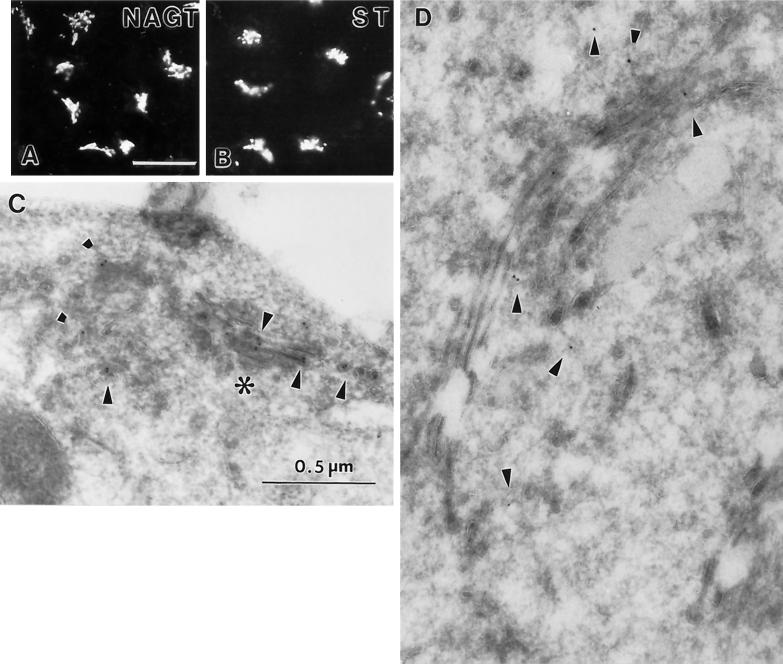
As shown in Figure 1, the NAGT-I- and ST-myc clones showed a strong juxtanuclear signal when stained with mAb 9E10. In single-label experiments, the immunofluorescence distribution of both NAGT-I- (Figure 1A) and ST-myc (Figure 1B) appeared similar to that of endogenous GalT (our unpublished observations). Following single-label immunogold staining for each marker protein, gold particles specific for NAGT-I- or ST-myc were observed to be associated with the Golgi; only negligible labeling of mitochondria or the nucleus was detected. The number of gold particles per Golgi stack ranged from about 2 to as many as 16. Typically the number was between 2 and 5. As shown in Figure 1C, in cross-sections, NAGT-I-myc staining tended to be centrally localized within the Golgi stack in regions where the section fell perpendicularly to the plane of the stack (Figure 1C, asterisk) consistent with its expected more medial distribution, whereas ST-myc staining appeared to be to one side of the stack (Figure 1D). In areas where the section appears to pass obliquely through the organelle, the gold particles cannot be assigned to any subportion of the Golgi (e.g., Figure 1C, left portion).
Figure 1.
Single-label immunolocalization of NAGT-I- and ST-myc stably expressed in Vero cells. Immunofluorescence distribution of NAGT-I- (A) and ST-myc (B). Bar, 20 μm. Immunogold distribution of NAGT-I- (C) and ST-myc (D). Bar, 0.5 μm. Arrowheads point to gold particles. Asterisk (C) indicates a region of the Golgi complex in which the organelle is sectioned perpendicularly to the stack while to the left the section falls obliquely giving rise to a tubular-vesicular appearance. 9E10 mAb was the primary antibody. For immunofluorescence, a Texas Red-conjugated secondary antibody was used.
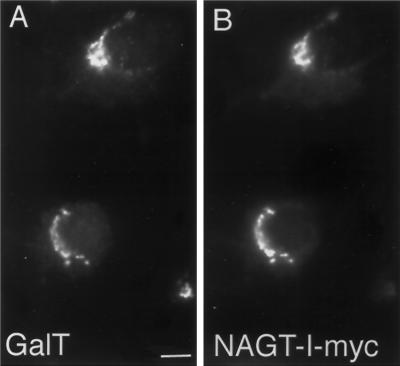
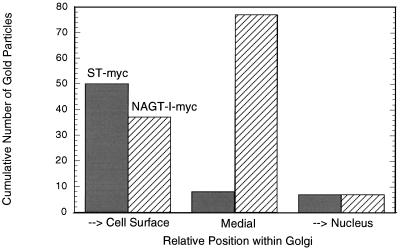
In an effort to better establish the relative distributions of NAGT- and ST-myc within the Golgi, double-label experiments were performed. As shown in Figure 2 by immunofluorescence, there is close correspondence of the distribution of GalT and NAGT-I-myc in transfected cells. Using conventional immunofluorescence microscopy and computer images of overlays, NAGT-I-myc (red channel) and GalT (green channel) were seen to overlap extensively in distribution (our unpublished results). ST-myc and GalT showed indistinguishable distributions by immunofluorescence (our unpublished observations). Computer overlays were software-corrected for pixel shifts during image collection as described in MATERIALS AND METHODS. Double-label immunogold staining of NAGT-I- and ST-myc and endogenous GalT pairings was attempted; unfortunately, our stock-diluted anti-GalT antibodies gave insufficient labeling density. Hence, the extent of polarity of NAGT-I- and ST-myc with respect to the Golgi stack were quantified from the single-label micrographs. As can be seen in Figure 3, ST-myc was located predominantly to the cell surface-facing side of the stack, with NAGT-I-myc overlapping in distribution and showing a predominantly medial distribution. The cell surface-facing side of the stack is conventionally considered to be the trans face of the Golgi (for review, see Schekman and Mellman, 1997). The relative labeling distributions observed for ST- and NAGT-I-myc in Vero cells are in agreement with the previous, more detailed, quantitative double-label electron microscopic localizations of C-terminally epitope-tagged NAGT-I and ST in HeLa cells (Nilsson et al., 1993; Rabouille et al., 1995a). The small number of gold particles per Golgi unit in Vero cells precluded the use of an immunogold electron microscopy approach in the drug experiments described below.
Figure 2.
Double-label immuofluorescent colocalization of endogenous GalT and NAGT-I-myc in stably transfected Vero cells. Cells were double labeled for GalT (polyclonal antibody, green channel, A) and NAGT-I-myc (9E10 mAb, red channel, B). Images were collected with a Photometrics CCD camera. In the two transfected cells, extensive co-localization of the two Golgi proteins was apparent at the immunofluorescent level.
Figure 3.
Single-label immunogold quantitation of the polarized distribution of ST- and NAGT-I-myc in the Golgi of stably transfected Vero cells. ST- and NAGT-I-myc cells were processed for cyrosectioning followed by immunogold staining (10 nm protein A-gold) with 9E10 hybridoma supernatant directed against the myc epitope. The cumulative distribution of gold particle particles across the Golgi complexes sectioned perpendicular to the stack was scored as described in MATERIALS AND METHODS. The distributions of ST- and NAGT-I-myc were scored for 14 and 22 Golgi stacks, respectively.
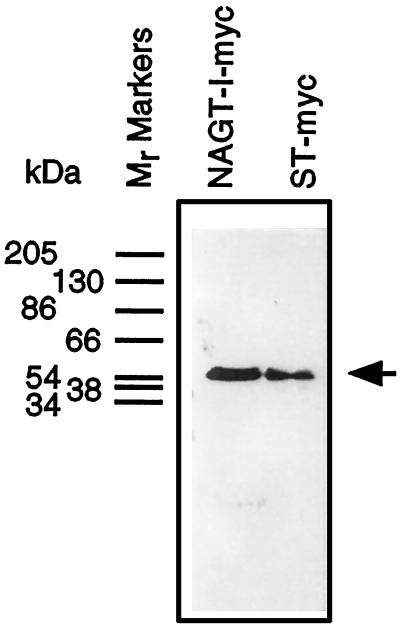
The relative molecular mobility of NAGT-I- and ST-myc synthesized in the stable Vero cells was determined by immunoblotting. Golgi fractions were prepared and solubilized and polypeptides were separated by SDS-PAGE. The polypeptide recognized by 9E10 in either case migrated with a relative mobility of about 54–55 kDa (Figure 4, arrow). This is in agreement with previous results for similar transfectants in HeLa cells (Nilsson et al., 1993; Rabouille et al., 1995a) and consistent with predictions based on sequence information. We conclude that NAGT-I- and ST-myc are synthesized and distributed normally in transfected Vero cells. For the sake of simplicity, we will henceforth refer to these proteins as NAGT-I or ST, respectively.
Figure 4.
Electrophoretic characterization of NAGT-I and ST-myc expressed in stably transfected Vero cells. Golgi fractions were prepared from NAGT-I- and ST-myc Vero cells and solubilized, and equal aliquots of the fractions were applied to wells of a SDS-polyacrylamide gel. After transfer to nitrocellulose, filters were probed with 9E10 mAb diluted in blocking buffer and the primary antibody was then localized by ECL using HRP-conjugated secondary antibody. The position of molecular weight markers are indicated on left side. The prestained mobility standards are: α2-macroglobulin, 205 kDa; β-galactosidase from Escherichia coli, 130 kDa; fructose-6-phosphatase kinase from rabbit muscle, 86.5 kDa; pyruvate kinase from chicken muscle, 66 kDa; fumarase from procine heart, 54 kDa; lactate dehydrogenase from rabbit muscle, 38 kDa; and triosephosphatase from rabbit muscle, 34.2 kDa.
Nocodazole-Induced Scattering of Trans-Golgi/TGN to Peripheral Structures Precedes That of Medial Cisternae
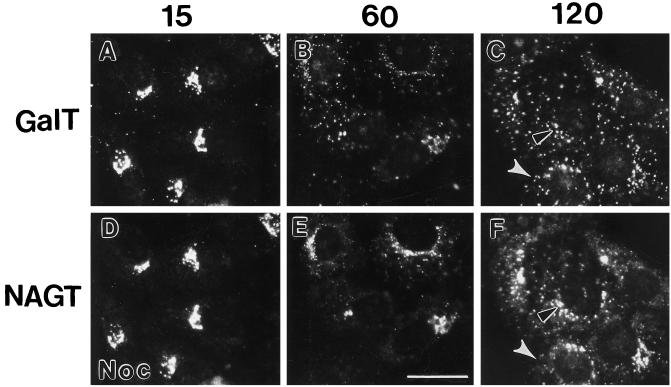
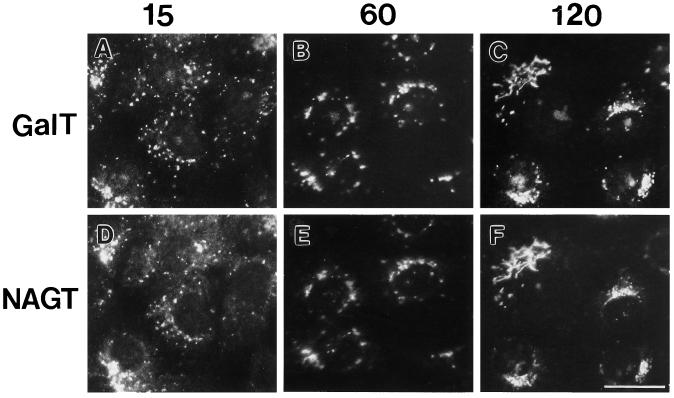
We monitored the distribution of three Golgi-specific type II membrane proteins, ST (trans-Golgi/TGN), GalT (trans-Golgi/TGN), and NAGT-I (medial-Golgi/trans-Golgi), following microtubule depolymerization in Vero cells. In the absence of the microtubule depolymerizing drug, nocodazole, all three proteins showed a compact juxtanuclear distribution (Figures 1 and 2). Fifteen minutes after nocodazole addition, a small number of scattered structures positive for GalT (Figure 5, A and D) or ST (our unpublished observations) fluorescence (scattered fluorescent patches) was observed in addition to juxtanuclear Golgi fluorescence for GalT or ST. Fewer patches were positive for NAGT-I than GalT (compare Figure 5, A and D, small scattered dots in cytoplasm). Microtubules had substantially, but not completely depolymerized at this time point (our unpublished observations). With time (30, 60, 120, and 240 min), the compact juxtanuclear Golgi complex disappeared while the number of cytoplasmic patches positive for each cisternal protein increased, albeit, at differing rates. Qualitatively, the scattering of NAGT-I (Figure 5, E and F) lagged behind that of GalT (Figure 5, B and C; e.g., see black outlined arrowheads in Figure 5, C and F) and ST (our unpublished observations); ST and GalT appeared to redistribute to patches with similar kinetics. As indicated by the white arrowheads in Figure 5, C and F, patches positive for GalT or ST (our unpublished observations) often displayed no detectable NAGT-I staining at time points through 120 min. By 240 min, all three cisternal proteins were found in overlapping fluorescent patches randomly scattered throughout the cytoplasm.
Figure 5.
Effect of nocodazole treatment on the distribution of GalT and NAGT-I. Vero cells (NAGT-I-myc transfectant) were treated with 10 μM nocodazole for 15 min (A and D), 60 min (B and E), and 120 min (C and F). Cells were stained for double-immunofluorescence microscopy using rabbit polyclonal anti-GalT antibodies (FITC channel, A–C) and monoclonal anti-NAGT-I-myc antibody 9E10 (Texas Red channel, D–F). Black arrowheads with white outlines in C and F point to differences in the compact juxtanuclear Golgi-like staining of GalT and NAGT-I. White arrowheads in C and F point to cytoplasmic patches that are strongly stained for GalT but not for NAGT-I. Bar, 20 μm.
Quantitatively, the redistribution of the trans/TGN proteins, ST and GalT, into cytoplasmic patches appeared to be approximately threefold faster than that of the medial-Golgi/trans-Golgi protein, NAGT-I. As enumerated in Figure 6, the number of patches positive for ST and GalT increased in parallel, starting at about 3 per cell at 15 min following drug addition and ending at about 45 per cell at 240 min. The number of NAGT-I-positive patches per cell were decidedly fewer at time points through 120 min, e.g., at 120 min, about 16 NAGT-I-positive fluorescent patches/cell versus about 35 GalT or ST-positive patches/cell (Figure 6). At 240 min following nocodazole addition, the number of GalT- and NAGT-I-positive patches were equal at about 45 per cell and colocalization of the markers was complete. It should be noted that in our assay we observed a maximum of about 50 scattered cytoplasmic structures (immunofluorescent patches) per cell. This is decidedly less than the 100 or more reported by Cole et al. (1996) and may be due either to differences between cell lines and their characteristics or to the greater capacity of a high dynamic range CCD camera to detect both very dim and bright objects in the same field. In our experiments using film, low-brightness objects may well be undetectable due to limited dynamic range. As an additional test, the brightness of staining of the cytoplasmic patches for either GalT versus NAGT-I or GalT versus ST was compared macroscopically from negatives and prints. At all time points through 120 min, the GalT structures were typically more intensely stained for GalT than NAGT-I and showed about equal intensity for GalT and ST. At the late time point, 240 min, staining for all three markers appeared to be about equal.
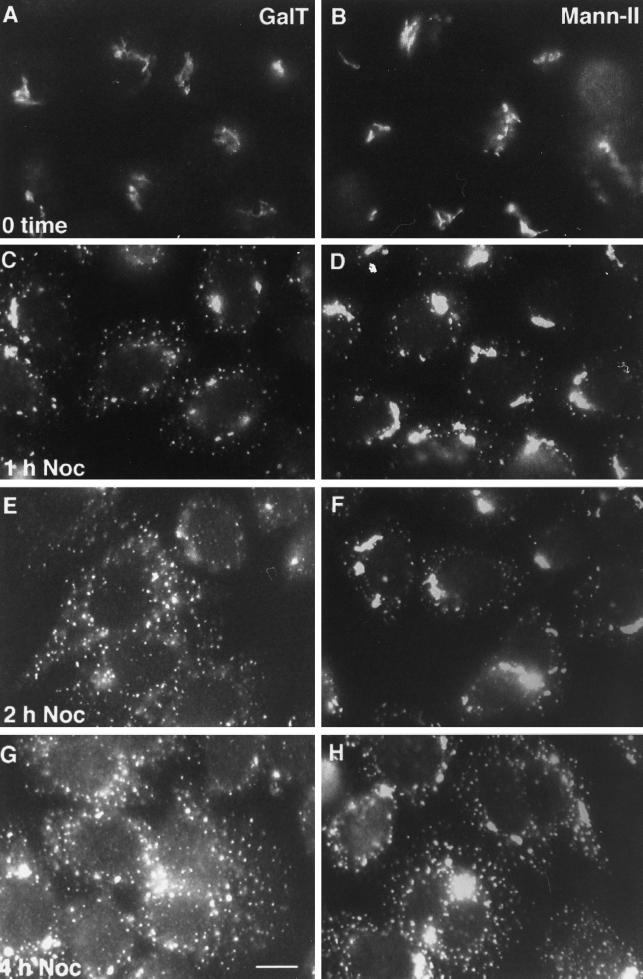
Conceivably, differential scattering kinetics for TGN/trans-Golgi markers, ST and GalT, and a more medial marker, NAGT-I, are an artifact of differential antibody reactivity during nocodazole treatment. We believe that variable display of the epitope tag is an unlikely explanation of our results. Because the epitope tag is placed in the identical luminal position for both tagged transferases, it should be similarly displayed for both NAGT-I and ST. The reference protein, GalT, is the same in both pairings. The membrane permeabilization is with an extractive solvent, methanol. To decrease further the likelihood of an artifactual result, to provide a second medial marker, and to characterize what is true in a second cell type, we have examined the effect of nocodazole-induced microtubule depolymerization on the scattering of GalT and the medial transferase, Mann-II, in HeLa cells transfected with rat Mann-II (Rabouille et al., 1995a). In these experiments, both GalT and Mann-II were localized with polyclonal rabbit antibodies against the polypeptide portion of the proteins; consequently, localizations were with paired, parallel coverslip cultures incubated in the same culture dish. As shown in Figure 7, both GalT and Mann-II had a compact juxtanuclear distribution in control cells; the GalT distribution displayed rapid scattering upon drug treatment whereas that of Mann-II lagged distinctly behind.
Figure 7.
Effect of nocodazole treatment on the distribution of GalT and Mann-II. HeLa cell cultures were either processed immediately for immunofluorescence microscopy (0 time) or treated with 10 μM nocodazole for 1 h (C and D), 2 h (E and F), and 4 h (G and H). Parallel coverslips were then processed either for localization of endogenous GalT (polyclonal anti-bovine GalT antibodies, A, C, E, and G) or transfected rat Mann-II (polyclonal anti-rat Mann-II antibodies, B, D, F, and H). A Cy3-conjugated secondary antibody was used in all cases. Bar, 10 μm.
Our data clearly suggest that nocodazole-induced scattering of trans-Golgi/TGN enzymes precedes that of medial-Golgi enzymes. Early scattering must thus lead to at least a partial separation of medial from trans enzymes. Only separate fragmentation of an essentially NAGT-I/Mann-II-negative subcompartment, the TGN (Nilsson et al., 1993; Rabouille et al., 1995a), could give rise to the observed NAGT-I-negative patches. Moreover, the data suggest that dispersed TGN segments of the Golgi, initially decidedly enriched in GalT/ST, serve as an accumulation site for trans- and medial-Golgi components containing substantial amounts of NAGT-I and Mann-II.
Reassembly of the Golgi Complex following Nocodazole Removal
Vero cells treated with nocodazole for 4 h (full scattering of GalT, NAGT-I, and ST) were fixed at various time points following nocodazole removal. Fifteen minutes after drug removal, occasional, juxtanuclear, compact clusters of fluorescent patches were seen; although most of the GalT (Figure 8A), NAGT-I (Figure 8D) and ST (our unpublished observations) staining remained in scattered cytoplasmic patches. Fifteen minutes after drug removal, microtubules were already repolymerized and radiated outward from the centrosomal area (our unpublished observations). Progressive accumulation of patches around the circumference of the nucleus occurred over time. At 60 and 120 min, there was an accumulation of cisternal Golgi proteins into a compact juxtanuclear distribution, presumably accompanied by membrane fusion (Figure 8, B, C, E, and F). Qualitatively, there was little apparent difference in the distribution of GalT, NAGT-I, and ST (our unpublished observations) at all time points following nocodazole removal. Quantitatively, the kinetics of Golgi reassembly were the same for all three Golgi membrane proteins and the number of scattered cytoplasmic patches positive for each decreased in parallel (Figure 9). During the whole process of Golgi reassembly, both NAGT-I/GalT and ST/GalT in each double-labeling experiment appeared to colocalize within the stained structures (our unpublished results). All three cisternal Golgi markers behaved identically during the process of juxtanuclear Golgi reassembly, suggesting that this process occurs concomitantly with respect to the individual cisternae.
Figure 8.
Reassembly of Golgi complex after removal of nocodazole. NAGT-I-myc Vero cells were treated with 10 μM nocodazole for 240 min to completely fragment the Golgi complex. After brief washes, the cells were incubated in drug-free medium for 15 min (A and D), 60 min (B and E), and 120 min (C and F). Cells were processed for double immunofluorescence as described in the legend of Figure 5. The reassembly process for the ST marker was similar. Bar, 20 μm.
Scattered Cisternal Golgi Markers Show Extensive Colocalization with ERGIC-53
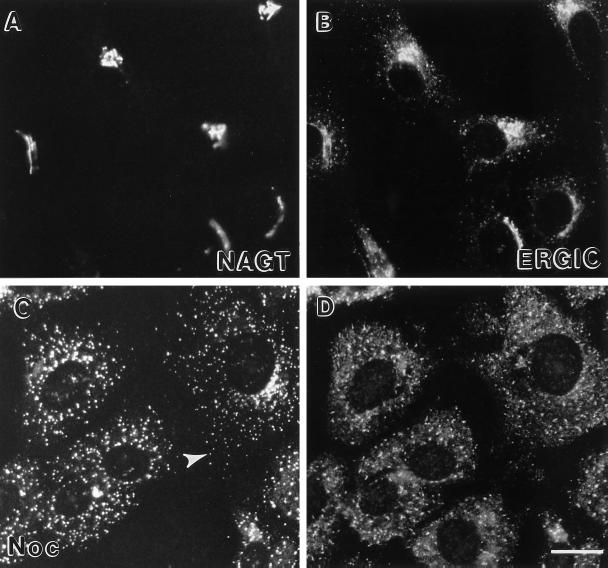
We also characterized the distribution of all three cisternal markers and ERGIC-53 which normally resides in the IC/CGN in Vero cells. ERGIC-53 has been shown previously to be present in cytoplasmic patches after nocodazole treatment (Lippincott-Schwartz et al., 1990; Cole et al., 1996). Before nocodazole treatment, ERGIC-53 was distributed in the same general area as that of NAGT-I, but NAGT-I had a more continuous and compact staining pattern than ERGIC-53, which appeared more as a juxtanuclear cluster of dots with some more scattered dots (Figure 10, A and B). To determine the comparative effect of nocodazole on both, we characterized distributions over a 240-min period for the pairing GalT/ERGIC-53 and for all three cisternal proteins at the late time point, 240 min; at which time cisternal markers such as NAGT-I would be expected to be fully distributed to peripheral patches. After 240 min of nocodazole treatment, ERGIC-53 and NAGT-I were as expected scattered in cytoplasmic patches (Figure 10, C and D). General, but not complete, correspondence of NAGT-I and ERGIC-53 staining was observed; occasional NAGT-I-positive structures appeared to be negative for ERGIC-53 (e.g., white arrowhead, Figure 10C). Similar results were seen when ST or GalT distributions were compared with ERGIC-53 (our unpublished observations). ERGIC-53 scattering was complete within 60 min and at all time points scattered GalT patches were typically in close association with ERGIC-53-positive structures.
Figure 10.
Effect of nocodazole treatment on the distribution of NAGT-I and ERGIC-53. Vero cells treated with nocodazole for 0 min (A and B) or 4 h (C and D) were processed for indirect immunofluorescence using polyclonal anti-myc antibodies to localize NAGT-I-myc (rhodamine channel, A and C) and the monoclonal anti-ERGIC-53 antibody G1/93 (FITC channel, B and D). White arrowhead in C points to an example of NAGT-I-positive cytoplasmic patch which appeared negative for ERGIC-53. Bar, 20 μm.
Effect of Putative Inhibitors on the Formation of Scattered Golgi Protein-positive Structures
As expected from previous results (Turner and Tartakoff, 1989; Cole et al., 1996), pretreatment of Vero or HeLa cells with cycloheximide (100 μg/ml) to inhibit protein synthesis or cytochalasin D to fully disperse actin-based microfilaments (Ho et al., 1990) had no effect on subsequent Golgi scattering upon addition of nocodazole (our unpublished observations). Furthermore, no statistically significant loss in antigenicity of the Golgi marker proteins was detected during a 6-h exposure of Vero cells to cycloheximide (our unpublished observations).
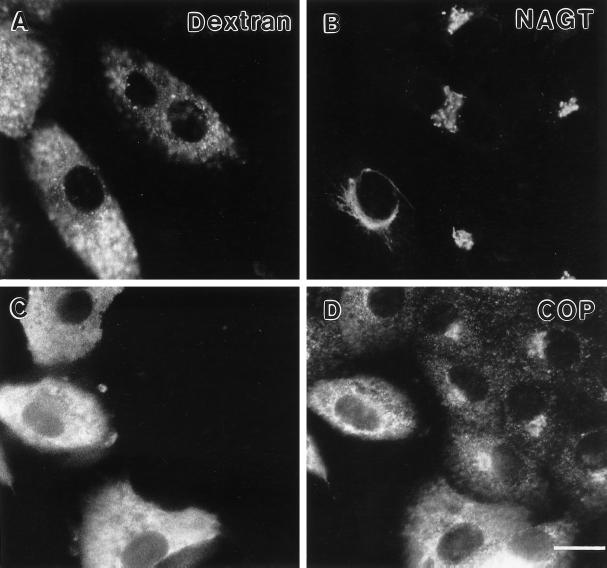
As GTP plays an important role in the initiation of vesicle-mediated transport processes in the secretory pathway (for review, see Kreis et al. 1995), the effect of microinjection of the nonhydrolyzable GTP analogue, GTPγS, was investigated. GTPγS blocks transport from the ER to Golgi and intra-Golgi transport in permeabilized cells (Beckers et al., 1989; Schwaninger et al., 1992), and inhibits transport of VSV-G protein in isolated Golgi stacks (Melançon et al., 1987). NAGT-I- and ST-myc Vero cells were microinjected with a 500 μM GTPγS solution prior to the addition of nocodazole. As the microinjection volume is about 5–10% of that of the cell, the predicted intracellular concentration of GTPγS is between 25 and 50 μM. Nocodazole was then added 30 min after microinjection of GTPγS. As shown in Figure 11, A (fluorescent dextran-coinjected marker) and B (NAGT), microinjection of GTPγS had little, if any, effect over a 4.5-h period on gross Golgi morphology as seen by immunofluorescence. Similarly, little, if any, effect was seen on ST distribution (our unpublished observations). The normal juxtanuclear distribution of the COPI protein β-COP, however, was altered to a more disperse cytoplasmic distribution (Figure 11, C and D; Pepperkok et al., in preparation). Microinjection had no obvious effect on microtubule distribution or the ability of nocodazole to induce rapid depolymerization of microtubules as seen by immunofluorescent staining with antitubulin antibody (our unpublished observations). Furthermore, microinjected GTPγS blocked ts-O45-G transport from the ER to the plasma membrane when cells were shifted from nonpermissive to permissive temperature (our unpublished observations; Pepperkok et al., in preparation), indicating that the GTPγS concentration was sufficient to inhibit the activity of small GTPases involved in biosynthetic transport processes in vivo.
Figure 11.
Effect of microinjected GTPγS on the distribution of NAGT-I and β-COP in Vero cells. Cells were coinjected with GTPγS (500 μM stock concentration) and fixable FITC-dextran, fixed with paraformaldehyde after a 4.5-h incubation, and processed for immunofluorescent staining. Microinjected cells (FITC channel, A and C). First antibodies were 9E10 mAb and rabbit polyclonal anti-EAGE antibody for the localization of NAGT-I-myc (rhodamine channel, B) and β-COP (rhodamine channel, D), respectively. Note that in the microinjected cells the distribution of NAGT-I remained compact and juxtanuclear whereas that of β-COP became more disperse. Bar, 20 μm.
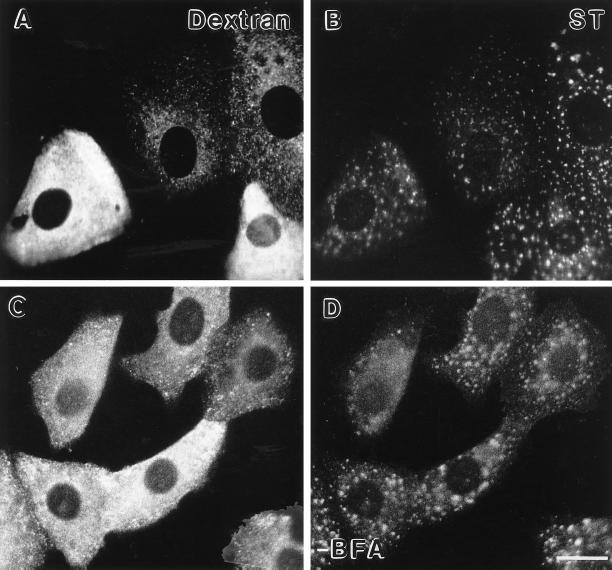
As shown in Figure 12, A and B, 500 μM GTPγS did not block nocodazole-induced dispersal of ST to scattered peripheral fluorescent patches in a 4-h end point assay. Likewise, microinjected GTPγS did not block the redistribution of ST from ER to scattered peripheral fluorescent patches following transfer of BFA-treated cells to BFA-free media containing nocodazole. BFA induces the redistribution of Golgi transferases to the ER. In parallel experiments, little, if any, effect was seen on NAGT-I dispersal to scattered fluorescent structures under either condition (our unpublished observations). Both ST and NAGT-I are fully dispersed to the ER after treatment of cells for 3 h with 5 μg/ml BFA (our unpublished observations; Yang, 1995). In kinetic experiments, no effect of GTPγS on Golgi scattering after a 1- or 2-h nocodazole treatment was noted for either Vero or HeLa cells (our unpublished observations). We conclude from these experiments that transport vesicles such as those recruited by ARF for transport of VSV-G between the ER and the Golgi complex are unlikely to be involved in either the redistribution of Golgi components to scattered cytoplasmic structures following microtubule depolymerization or in the redistribution of these components from the ER to form what may be an initial intermediate in Golgi reassembly. This last conclusion is similar to one reached by Acharya et al. (1995) for initial steps in Golgi reassembly following ilimaquinone-induced Golgi dispersal.
Figure 12.
Effect of microinjected GTPγS on nocodazole-induced redistribution of ST to scattered peripheral structures. Cells were coinjected with GTPγS (500 μM stock concentration) and fixable FITC-dextran prior to the addition of nocodazole. In A and B, cells were exposed to nocodazole for 4 h with no prior BFA treatment (+Noc). In C, D, cells were exposed to nocodazole for 2 h following a 3-h BFA treatment (−BFA + Noc) which resulted in the dispersal of the ST-myc to the ER (Yang, 1995). Cells were then fixed with paraformaldehyde and processed for immunofluorescent staining. Microinjected cells (FITC channel, A and C). ST-myc (rhodamine channel, 9E10 first antibody, B and D). Note that in either case the ST is distributed in a scattered patchy fluorescence pattern in the microinjected cells. Bar, 20 μm.
DISCUSSION
We have asked if during the process of Golgi fragmentation in response to microtubule depolymerization Golgi subcompartments separate one from another. We have used stably transfected primate cells expressing transfected Golgi membrane proteins to compare and contrast the effect of microtubule disruption on individual Golgi subcompartments. The Golgi localization and subcompartmentalization of the transfected proteins was established by fluorescence and electron microscopy. The aim was to ask whether the kinetics of Golgi protein scattering in response to microtubule depolymerization might be consistent with subcompartment separation perhaps based on sequential countercurrent retrograde trafficking between adjacent Golgi subcompartments. In comparing the kinetics of redistribution of trans/TGN and medial-Golgi proteins by immunofluorescence following nocodazole addition, we found that the trans/TGN proteins scattered first. This redistribution was not blocked by GTPγS, nor was the formation of scattered Golgi-positive structures following BFA removal in the presence of nocodazole. These results strongly suggest that Golgi subcompartments separate during organelle fragmentation. They are inconsistent with sequential countercurrent traffic models for Golgi disassembly in response to microtubule disruption. Rather they raise the speculative possibility that direct cross-current cycling of Golgi proteins through the ER leads to subcompartment separation followed by reassociation through accumulation of these proteins at or about ER exit sites in the absence of microtubules.
Trans/TGN Golgi Enzymes Redistribute Rapidly in Response to Microtubule Disruption
Pairwise immunofluorescent comparisons of Golgi protein redistribution in response to nocodazole-induced microtubule depolymerization constituted the central evidence that trans/TGN proteins scatter approximately threefold more rapidly than medial proteins. For the trans/TGN proteins ST and GalT redistribution from a compact juxtanuclear Golgi complex was more than 50% complete within 1 h whereas it took the medial protein NAGT-I more than 2 h to reach the same extent of scattering in Vero cells. The reference protein in each pairing was GalT. By selection of the appropriate focal plane, the overall distributions for each individual Golgi protein could be assessed per cell in a single immunofluorescence micrograph. Similar results were seen for a GalT/Mann-II (medial) pairing in HeLa cells. Based on the similar behavior of ST/GalT and NAGT-I/Mann-II using a variety of antibodies to either the epitope tag or polypeptide backbone, we propose that our results are not an artifact of differential antibody/antigen reactivity. The Golgi reassembly experiments in Vero cells in which the kinetics for redistribution of all three cisternal proteins from a scattered patchy pattern to a compact juxtanuclear pattern were the same provided further support for the validity of the immunofluorescence assay. This result also suggests an important mechanistic difference between Golgi dispersion and collection. Our data suggest that in vivo the Golgi is an asymmetric structure in which the trans-Golgi/TGN can be physically dissociated from the medial-Golgi in an anisotropic process. The data give additional support to a tripartite model for Golgi structure, CGN/cis-Golgi, medial-Golgi stack, trans-Golgi/TGN, proposed by Mellman and Simons (1992).
Potential Routes for Golgi Scattering during Microtubule Depolymerization
Golgi fragmentation in response to microtubule depolymerization has been conceived as a process in which individual Golgi stacks tethered and stabilized by microtubules become unlinked from one another and sever to smaller but complete stacks which subsequently scatter toward the cell periphery to give small unit Golgi stacklets distributed throughout the cytoplasm (for example, see Rothman and Warren, 1994). In such a mechanism, each Golgi stacklet as it scatters would contain continuously a complete set of Golgi enzymes arranged in a polarized cisternal manner. All membrane proteins would be expected to scatter upon microtubule depolymerization with the similar kinetics. Our data clearly show that this is not the case. The two trans markers and by inference the TGN containing these proteins scatters more rapidly than the two medial markers and by inference the core Golgi subcompartment(s). Hence, we conclude that Golgi scattering in response to microtubule depolymerization is not the result of unlinking unit Golgi stacklets from one another.
The present data suggest that the initial scattered Golgi structure, unlike a complete Golgi stack, should not be fully functional. As demonstrated by our experiments, the initial scattered Golgi element must be an incomplete stacklet; it was decidedly enriched in trans Golgi/TGN proteins and deficient in medial proteins. We predict as a consequence of this trans-first anisotropic scattering process that the initial scattered structure as well as residual juxtanuclear Golgi elements are incapable of normal protein processing. Consistent with this prediction, Cole et al. (1996) found that during the initial stages of Golgi scattering there is an ∼1-h gap in Golgi function in protein processing. As shown previously by Rogalski et al. (1984), Iida and Shibata (1991), and Cole et al. (1996), scattered Golgi elements formed after a few hours of drug treatment can be completely functional for protein processing and secretion.
Two key points that must be explained by any model of Golgi disassembly during microtubule depolymerization are how anisotropic scattering is produced and why the Golgi proteins fail to collect juxtanuclearly in the nocodazole-treated cell. As emphasized earlier by Turner and Tartakoff (1989), Golgi scattering in response to microtubule depolymerization is an active process. It is temperature and energy dependent and, based on inhibitor results, does not involve actin-based motors (Turner and Tartakoff, 1989; Cole et al., 1996; present work). Cole et al. (1996) have proposed that this Golgi scattering is due to the accumulation of cycling Golgi proteins at or about ER exit sites. In other words, Golgi proteins normally cycle through the ER. Failure to collect juxtanuclearly is a consequence of the lack of effective minus end-directed motor activity to transport continuously forming Golgi elements at ER exit sites to the cell center. Distinct isoforms of the minus end-directed motor protein, cytoplasmic dynein, are known to be associated with the Golgi complex (Vaisberg et al., 1996). Microinjection of antidynein (Vaisberg et al., 1996) or antidynactin subunit (Burkhardt et al., 1998), a regulatory subunit of dynein, results in Golgi scattering. Golgi proteins collect juxtanuclearly as an ensemble as microtubules polymerize following nocodazole removal (present work). Anisotropic Golgi scattering could be readily interpreted in the framework of ER cycling if it is assumed that there is direct recycling of Golgi membrane proteins from the organelle to the ER. Such a process has been termed cross-current retrograde trafficking (Rothman, 1981; Rothman and Warren, 1994; Rothman and Wieland, 1996). If the major retrograde trafficking pathway was from the TGN to the ER, then proteins predominantly resident in the medial-Golgi subcompartment such as NAGT-I and Mann-II would follow behind the TGN/trans-Golgi proteins ST and GalT.
Trans-first Golgi membrane cycling to the ER as postulated here might be a consequence of 1) cisternal progression (for a recent review, see Schekman and Mellman, 1997); 2) the greater stability of the central medial portion of the stack compared with the TGN/trans-Golgi due to greater interactions with other Golgi cisternae or matrix components/microtubules (Slusarewicz et al., 1994; Nakamura et al., 1995); or 3) the greater tendency of the TGN to periplasmic fusion within tubules. The challenge for the future will be to produce direct rather than indirect molecular evidence for normal cycling of Golgi proteins to the ER. In this context, it should be noted that expression of mutant rab6 in HeLa cells leads to a pronounced ER-like distribution of Golgi GalT (Martinez et al., 1997).
Generality of GTPγS-insensitive Steps in Golgi Scattering and Reassembly Processes
The insensitivity to microinjected GTPγS of Golgi scattering during microtubule depolymerization observed here suggests that dissociative vesicle-mediated anterograde transport of proteins through the organelle does not play a major role in Golgi scattering. This may point to important parallels with other Golgi disassembly and reassembly processes. In vivo, overexpression of the GTP bound rab6 mutant rab6 Q72L produces a much more emphatic ER-like GalT distribution pattern than does overexpression of wild-type rab6; overexpression of the GDP-bound mutant does not induce a redistribution of GalT staining (Martinez et al., 1997). In vitro, Golgi disassembly upon addition of mitotic cell extracts is insensitive to GTPγS or AlF, both inhibitors of GTP-binding protein activity (Rabouille et al., 1995b). Similarly the partially in vitro-reconstituted reassembly of Golgi fragmented by either mitosis or the drug ilimaquinone has been shown to be insensitive to GTPγS and AlF in the first case (Rabouille et al., 1995b) and to GTPγS in the second (Acharya et al., 1995). As shown here and also by Acharya et al. (1995), GTPγS at the concentrations used blocks VSV-G protein transport from the ER to the cell surface, indicating that dissociative vesicle populations involved in anterograde transport of secretory proteins through the Golgi are not the driving force in Golgi fragmentation. The GTPγS effect on intra-Golgi transport is thought to be due to inhibition of ARF protein activity (Taylor et al., 1992).
It should be noted that two other reports regarding the effect of inhibition of GTP hydrolysis on Golgi scattering during microtubule disruption have appeared. In the first (Wehland and Sandoval, 1983), the stock concentration of the nonhydrolyzable GTP derivative injected was 200-fold greater than the concentration used here. This high concentration has profound effects on the organization of microtubules in cells, suggesting compounding factors for any conclusions drawn from these experiments. In the second (Cole et al., 1996), AlF was used at unspecified concentrations in vivo. AlF is a membrane-permeant effector of trimeric GTP-binding protein activity. Under both of these conditions, Golgi scattering was affected. Multiple mechanisms may be involved; in vitro AlF can inhibit intra-Golgi transport in extracts depleted of ARF (Taylor et al., 1992). It should be noted that at the concentration used, microinjected GTPγS would not be expected to affect sar1p homologue COPII-dependent processes (R. Pepperkok, personal communication).
Conclusions
Scattering of Golgi proteins in response to microtubule depolymerization is a trans-first anisotropic process. Golgi subcompartments likely separate from one another. These data are consistent with the possibility that there may be direct retrograde cycling of Golgi components to the ER.
ACKNOWLEDGMENTS
The constructs were made in collaboration with Thomas E. Kreis and Rainer Pepperkok (University of Geneva, Geneva, Switzerland). We would like to express our great appreciation to Gareth Griffiths and Tommy Nilsson, EMBL-Heidelberg, for providing facilities for the electron microscopy and microinjection experiments. We would like to thank J. Burkhardt, H.-P. Hauri, S. Munro, T. Nilsson, R. Parton, J. Shaper, and K. Simons for the gift of antibodies, plasmids, or cells. Discussions over coffee with Tommy Nilsson, Janis Burkhardt, Sabine Röttger, and Jamie White, all EMBL-Heidelberg, on the nature of the Golgi complex are much appreciated. The insightful comments of Janis Burkhardt, Thomas E. Kreis, Rainer Pepperkok, Brenda Shirley, and Richard A. Walker on the manuscript are gratefully acknowledged. This work was supported in part by a grant from the United States National Science Foundation to B.S.
REFERENCES
- Acharya U, Jacobs R, Peters J-M, Watson N, Farquhar M G, Malhotra V. The formation of Golgi stacks from vesiculated Golgi membranes requires two distinct fusion events. Cell. 1995;82:895–904. doi: 10.1016/0092-8674(95)90269-4. [DOI] [PubMed] [Google Scholar]
- Arar C, Carpentier V, Le Caer JP, Monsigny M, Legrand A, Roche AC. ERGIC-53, a membrane protein of the endoplasmic reticulum-Golgi intermediate compartment, is identical to MR60, an intracellular mannose-specific lectin of myelomonocytic cells. J Biol Chem. 1995;270:3551–3553. doi: 10.1074/jbc.270.8.3551. [DOI] [PubMed] [Google Scholar]
- Balch WE, Dunphy WG, Braell WA, Rothman JE. Reconstitution of the transport of protein between successive compartments of the Golgi measured by the coupled incorporation of N-acetylglucosamine. Cell. 1984;39:405–416. doi: 10.1016/0092-8674(84)90019-9. [DOI] [PubMed] [Google Scholar]
- Beckers CJM, Balch WE. Calcium and GTP: essential components in vesicular trafficking between the endoplasmic reticulum and Golgi apparatus. J Cell Biol. 1989;108:1245–1256. doi: 10.1083/jcb.108.4.1245. [DOI] [PMC free article] [PubMed] [Google Scholar]
- Burkhardt JK, Echeverri CJ, Nilsson T, Vallee RB. Overexpression of the dynamitin (p50) subunit of the dynactin complex disrupts dynein-dependent maintenance of membrane organelle distribution. J Cell Biol. 1997;132:469–484. doi: 10.1083/jcb.139.2.469. [DOI] [PMC free article] [PubMed] [Google Scholar]
- Chen C, Okyama H. High-efficiency transformation of mammalian cells by plasmid DNA. Mol Cell Biol. 1987;7:2745–2752. doi: 10.1128/mcb.7.8.2745. [DOI] [PMC free article] [PubMed] [Google Scholar]
- Cole NB, Sciaky N, Marotta A, Song J, Lippincott-Schwartz J. Golgi dispersal during microtubule disruption: regeneration of Golgi stacks at peripheral endoplasmic reticulum exit sites. Mol Biol Cell. 1996;7:631–650. doi: 10.1091/mbc.7.4.631. [DOI] [PMC free article] [PubMed] [Google Scholar]
- Dunphy WG, Rothman JE. Compartmental organization of the Golgi stacks. Cell. 1985;42:13–21. doi: 10.1016/s0092-8674(85)80097-0. [DOI] [PubMed] [Google Scholar]
- Evan GI, Lewis GK, Ramsay G, Bishop JM. Isolation of monoclonal-antibodies specific for human c-myc proto-onco-gene product. Mol Cell Biol. 1985;5:3610–3616. doi: 10.1128/mcb.5.12.3610. [DOI] [PMC free article] [PubMed] [Google Scholar]
- Griffiths G, McDowall A, Back R, Dubochet J. On the preparation of cryosections for immunocytochemistry. J Ultrastruct Res. 1984;89:65–78. doi: 10.1016/s0022-5320(84)80024-6. [DOI] [PubMed] [Google Scholar]
- Harris SL, Water MG. Localization of a yeast early Golgi mannosyltransferase, Och1p, involves retrograde transport. J Cell Biol. 1996;132:985–998. doi: 10.1083/jcb.132.6.985. [DOI] [PMC free article] [PubMed] [Google Scholar]
- Hauri H-P, Schweizer A. The endoplasmic reticulum-Golgi intermediate compartment. Curr Opin Cell Biol. 1992;4:600–608. doi: 10.1016/0955-0674(92)90078-Q. [DOI] [PMC free article] [PubMed] [Google Scholar]
- Herzog M, Draeger A, Ehler E, Small JV. Immunofluorescence microscopy of the cytoskeleton: double and triple immunofluorescence. In: Celis JE, editor. Cell Biology: A Laboratory Handbook. Vol. 2. San Diego: Academic Press; 1994. pp. 355–360. [Google Scholar]
- Ho WC, Allan VJ, Van Meer G, Berger EG, Kreis TE. Reclustering of scattered Golgi elements occurs along microtubules. Eur J Cell Biol. 1989;48:250–263. [PubMed] [Google Scholar]
- Ho WC, Storrie B, Pepperkok R, Ansorge W, Karecla P, Kreis TE. Movement of interphase Golgi apparatus in fused mammalian cells and its relationship to cytoskeletal elements and rearrangement of nuclei. Eur J Cell Biol. 1990;52:315–327. [PubMed] [Google Scholar]
- Hoe MH, Slusarewicz MT, Watson R, Warren G. Evidence for recycling of the resident medial/trans Golgi enzyme, N-acetylglucosaminyltransferase I, in IdlD cells. J Biol Chem. 1995;270:25057–25063. doi: 10.1074/jbc.270.42.25057. [DOI] [PubMed] [Google Scholar]
- Iida H, Sibata Y. Functional Golgi units in microtubule-disrupted cultured atrial myocytes. J Histochem Cytochem. 1991;39:1349–1355. doi: 10.1177/39.10.1719068. [DOI] [PubMed] [Google Scholar]
- Kornfeld R, Kornfeld S. Assembly of asparagine-linked oligosaccharides. Annu Rev Biochem. 1985;54:631–664. doi: 10.1146/annurev.bi.54.070185.003215. [DOI] [PubMed] [Google Scholar]
- Kreis TE, Lowe M, Pepperkok R. COPs regulating membrane traffic. Annu Rev Cell Dev Biol. 1995;11:677–706. doi: 10.1146/annurev.cb.11.110195.003333. [DOI] [PubMed] [Google Scholar]
- Kumar RJ, Yang J, Larsen RD, Stanley P. Cloning and expression of N-acetylglucosaminyltransferase I, the medial Golgi transferase that initiates complex N-linked carbohydrate formation. Proc Natl Acad Sci USA. 1990;87:9948–9952. doi: 10.1073/pnas.87.24.9948. [DOI] [PMC free article] [PubMed] [Google Scholar]
- Laemmli UK. Cleavage of structural proteins during the assembly of the head of bacteriophage T4. Nature. 1970;227:680–685. doi: 10.1038/227680a0. [DOI] [PubMed] [Google Scholar]
- Lippincott-Schwartz J, Donaldson JG, Schweizer A, Berger EG, Hauri H-P, Yuan LC, Klausner RD. Microtubule-dependent retrograde transport of proteins into the ER in the presence of brefeldin A suggests an ER recycling pathway. Cell. 1990;60:821–836. doi: 10.1016/0092-8674(90)90096-w. [DOI] [PubMed] [Google Scholar]
- Martinez O, Antony C, Pehau-Arnaudet G, Berger EG, Salamero J, Goud B. GTP-bound forms of rab6 induce the redistribution of Golgi proteins into the endoplasmic reticulum. Proc Natl Acad Sci USA. 1997;94:1828–1833. doi: 10.1073/pnas.94.5.1828. [DOI] [PMC free article] [PubMed] [Google Scholar]
- Melançon P, Glick BS, Malhotra V, Weidman PJ, Serafini T, Gleason ML, Orci L, Rothman JE. Involvement of GTP-binding “G” proteins in transport through the Golgi stack. Cell. 1987;51:1053–1062. doi: 10.1016/0092-8674(87)90591-5. [DOI] [PubMed] [Google Scholar]
- Mellman I, Simons K. The Golgi complex: in vitro veritas? Cell. 1992;68:829–840. doi: 10.1016/0092-8674(92)90027-A. [DOI] [PMC free article] [PubMed] [Google Scholar]
- Méresee S, Gorvel J-P, Chavier P. The rab7 GTPase resides on a vesicular compartment connected to lysosomes. J Cell Sci. 1995;108:3349–3358. doi: 10.1242/jcs.108.11.3349. [DOI] [PubMed] [Google Scholar]
- Nakamura N, Rabouille C, Watson R, Nilsson T, Hui N, Slusarewicz P, Kreis TE, Warren G. Characterization of a cis-Golgi matrix protein, GM 130. J Cell Biol. 1995;131:1715–1726. doi: 10.1083/jcb.131.6.1715. [DOI] [PMC free article] [PubMed] [Google Scholar]
- Nilsson T, Pypaet M, Hoe MH, Slusarewicz P, Berger EG, Warren G. Overlapping distribution of two glycosyltransferases in the Golgi apparatus of HeLa cells. J Cell Biol. 1993;120:5–13. doi: 10.1083/jcb.120.1.5. [DOI] [PMC free article] [PubMed] [Google Scholar]
- Nuoffer C, Davidson HW, Matteson J, Meinkoth J, Balch WE. A GDP-bound form of rab1 inhibits protein export from the endoplasmic reticulum and transport between Golgi compartments. J Cell Biol. 1994;125:225–237. doi: 10.1083/jcb.125.2.225. [DOI] [PMC free article] [PubMed] [Google Scholar]
- Palade GE. Intracellular aspects of the process of protein secretion. Science. 1975;189:347–358. doi: 10.1126/science.1096303. [DOI] [PubMed] [Google Scholar]
- Rabouille C, Hui N, Hunte F, Kieckbusch R, Berger EG, Warren G, Nilsson T. Mapping the distribution of Golgi enzymes involved in the construction of complex oligosaccharides. J Cell Sci. 1995a;108:1617–1627. doi: 10.1242/jcs.108.4.1617. [DOI] [PubMed] [Google Scholar]
- Rabouille C, Misteli T, Watson R, Warren G. Reassembly of Golgi stacks from mitotic Golgi fragments in a cell-free system. J Cell Biol. 1995b;129:605–618. doi: 10.1083/jcb.129.3.605. [DOI] [PMC free article] [PubMed] [Google Scholar]
- Rogalski AA, Bergman JE, Singer SJ. Effect of microtubule assembly status on the intracellular processing and cell surface expression of an integral protein of plasma membrane. J Cell Biol. 1984;99:1101–1109. doi: 10.1083/jcb.99.3.1101. [DOI] [PMC free article] [PubMed] [Google Scholar]
- Rothman JE. The Golgi apparatus: two organelles in tandem. Science. 1981;213:1212–1219. doi: 10.1126/science.7268428. [DOI] [PubMed] [Google Scholar]
- Rothman JE. Mechanisms of intracellular protein transport. Nature. 1994;372:55–63. doi: 10.1038/372055a0. [DOI] [PubMed] [Google Scholar]
- Rothman JE, Warren G. Implications of the SNARE hypothesis for intracellular membrane topology and dynamics. Curr Biol. 1994;4:220–233. doi: 10.1016/s0960-9822(00)00051-8. [DOI] [PubMed] [Google Scholar]
- Rothman JE, Wieland FT. Protein sorting by transport vesicles. Science. 1996;272:227–234. doi: 10.1126/science.272.5259.227. [DOI] [PubMed] [Google Scholar]
- Schekman R, Mellman I. Does COPI go both ways? Cell. 1997;90:197–200. doi: 10.1016/s0092-8674(00)80326-8. [DOI] [PubMed] [Google Scholar]
- Schwaninger R, Plutner H, Bokock GM, Balch WE. Multiple GTP-binding proteins regulate vesicular transport from the ER to the Golgi membranes. J Cell Biol. 1992;119:1077–1096. doi: 10.1083/jcb.119.5.1077. [DOI] [PMC free article] [PubMed] [Google Scholar]
- Schweizer A, Fransen JAM, Bachi T, Ginsel L, Hauri H-P. Identification, by a monoclonal antibody, of a 53-kD protein associated with a tubulo-vesicular compartment at the cis-side of the Golgi apparatus. J Cell Biol. 1988;107:1643–1653. doi: 10.1083/jcb.107.5.1643. [DOI] [PMC free article] [PubMed] [Google Scholar]
- Slot JW, Geuze HJ, Gigengack S, Lienhard GE, James DE. Immuno-localization of the insulin regulatable glucose transporter in brown adipose tissue of the rat. J Cell Biol. 1991;113:123–135. doi: 10.1083/jcb.113.1.123. [DOI] [PMC free article] [PubMed] [Google Scholar]
- Slusarewicz P, Nilsson T, Hui N, Watson R, Warren G. Isolation of a matrix that binds medial Golgi enzymes. J Cell Biol. 1994;124:405–413. doi: 10.1083/jcb.124.4.405. [DOI] [PMC free article] [PubMed] [Google Scholar]
- Storrie B, Pepperkok R, Stelzer EHK, Kreis TE. The intracellular mobility of a viral membrane glycoprotein measured by confocal microscope fluorescence recovery after photobleaching. J Cell Sci. 1994;107:1309–1319. doi: 10.1242/jcs.107.5.1309. [DOI] [PubMed] [Google Scholar]
- Takizawa RA, Yucei JK, Veit B, Faulkner JD, Deernick T, Sato G, Ellisman M, Malhotra V. Complete vesiculation of Golgi membranes and inhibition of protein transport by a novel sea sponge metabolite ilimaquinone. Cell. 1993;73:1079–1090. doi: 10.1016/0092-8674(93)90638-7. [DOI] [PubMed] [Google Scholar]
- Taylor TC, Kahn RA, Melançon P. Two distinct members of the ADP-ribosylation factor family of GTP-binding proteins regulate cell-free intra-Golgi transport. Cell. 1992;70:69–79. doi: 10.1016/0092-8674(92)90534-j. [DOI] [PubMed] [Google Scholar]
- Thyberg J, Moskalewski S. Microtubules and the organization of the Golgi complex. Exp Cell Res. 1985;159:1–16. doi: 10.1016/s0014-4827(85)80032-x. [DOI] [PubMed] [Google Scholar]
- Turner JR, Tartakoff AM. The response of the Golgi complex to microtubule alterations: the roles of metabolic energy and membrane traffic in Golgi complex organization. J Cell Biol. 1989;109:2081–2088. doi: 10.1083/jcb.109.5.2081. [DOI] [PMC free article] [PubMed] [Google Scholar]
- Vaisberg EA, Grissom PM, McIntosh JR. Mammalian cells express three distinct dynein heavy chains that are localized to different cytoplasmic organelles. J Cell Biol. 1996;133:831–842. doi: 10.1083/jcb.133.4.831. [DOI] [PMC free article] [PubMed] [Google Scholar]
- Veit B, Yucei JK, Malhotra V. Microtubule independent vesiculation of Golgi membranes and the reassembly of vesicles into Golgi stacks. J Cell Biol. 1993;122:1197–1206. doi: 10.1083/jcb.122.6.1197. [DOI] [PMC free article] [PubMed] [Google Scholar]
- Wehland J, Sandoval IV. Cells injected with guanosine 5′-[α, β-methylene]triphosphate, an α, β-nonhydrolyzable analog of GTP, shown anomalous patterns of tubulin polymerization affecting cell translocation, intracellular movement, and the organization of Golgi elements. Proc Natl Acad Sci USA. 1983;80:1938–1941. doi: 10.1073/pnas.80.7.1938. [DOI] [PMC free article] [PubMed] [Google Scholar]
- Wilson BS, Nuoffer C, Meinkoth JL, McCaffery M, Feramisco JR, Balch WE, Farquhar MG. A rab1 mutant affecting guanine nucleotide exchange promotes disassembly of the Golgi apparatus. J Cell Biol. 1994;125:557–571. doi: 10.1083/jcb.125.3.557. [DOI] [PMC free article] [PubMed] [Google Scholar]
- Yang W. Studies on the structural organization of Golgi complex. Ph.D. dissertation. Blacksburg, VA: Virginia Polytechnic Institute and State University; 1995. [Google Scholar]
- Zhang C-J, Rosenwald AG, Willingham MC, Skuntz S, Clark J, Kahn RA. Expression of a dominant allele of human ARF1 inhibits membrane traffic in vivo. J Cell Biol. 1994;124:289–300. doi: 10.1083/jcb.124.3.289. [DOI] [PMC free article] [PubMed] [Google Scholar]


