Abstract
We use time-resolved imaging to examine the lysis dynamics of non-adherent BAF-3 cells within a microfluidic channel produced by the delivery of single highly-focused 540 ps duration laser pulses at λ = 532 nm. Time-resolved bright-field images reveal that the delivery of the pulsed laser microbeam results in the formation of a laser-induced plasma followed by shock wave emission and cavitation bubble formation. The confinement offered by the microfluidic channel constrains substantially the cavitation bubble expansion and results in significant deformation of the PDMS channel walls. To examine the cell lysis and dispersal of the cellular contents, we acquire time-resolved fluorescence images of the process in which the cells were loaded with a fluorescent dye. These fluorescence images reveal cell lysis to occur on the nanosecond to microsecond time scale by the plasma formation and cavitation bubble dynamics. Moreover, the time-resolved fluorescence images show that while the cellular contents are dispersed by the expansion of the laser-induced cavitation bubble, the flow associated with the bubble collapse subsequently re-localizes the cellular contents to a small region. This capacity of pulsed laser microbeam irradiation to achieve rapid cell lysis in microfluidic channels with minimal dilution of the cellular contents has important implications for their use in lab-on-a-chip applications.
1 Introduction
Microfluidic devices have emerged as effective platforms for handling small samples and integrating multiple processes required for lab-on-a-chip (LOC) experiments.1–3 These characteristics are particularly attractive for chemical analysis of single cells and cellular structures.4–8 In many analytical applications, cells are loaded with single or multiple biochemical indicators and subsequently lysed for chemical separation, purification, and/or analysis of the cellular contents. Single cell analytics performed on a microfluidic platform show promise for providing very high throughput (10 cells min−1)9 as compared to some conventional techniques like capillary electrophoresis (≤20 cells day−1).8 Successful microfluidic platforms for cell analytics will integrate the processes necessary for both sample preparation and analysis including sample purification, cell separation and sorting, cell injection, cell lysis and chemical analysis.5,9,10
Rapid and precise cell lysis is needed in many LOC applications in order to make cell contents available for subsequent analysis, separation, and/or purification. For analytical applications it is critical that cell lysis be accomplished on a time scale faster than the biochemical activity of the analyte of interest. To date, cell lysis for analytical purposes has been achieved using chemical, electrical, and optical means.9–13 Chemical lysis of nucleated mammalian cells occurs on time scales of several to tens of seconds13,14 and is adequate for analytes whose chemical states change on much longer time scales such as DNA, RNA, and most proteins. However many biochemical processes within cells occur on sub-second to second time scales including the production of second messengers and signaling lipids or the activation of kinases and phosphatases. Thus faster means for cell lysis are needed for accurate characterization of the biochemical dynamics of these substances on a single cell basis.
The production of high electric field strengths in specific locations within microfluidic devices has been utilized by several groups to provide rapid cell lysis in LOC devices.9,11,12,15 These studies have demonstrated the ability to achieve lysis on time scales as rapid as ∼100 ms. Thus this approach appears to provide the cell lysis capability necessary for the analysis of rapid biochemical dynamics in a single cell. However, this use of electrical methods for cell lysis possesses a few disadvantages. Specifically, the electrodes required for generation of the electric field must be fabricated and integrated into the device. This increases the design complexity and fabrication cost of the single-use LOC device and also limits the location of cell lysis to fixed regions within the device.
Highly-focused pulsed laser microbeams have also been utilized successfully to provide the targeted lysis of single adherent cells for analytical applications.16,17 Time-resolved imaging studies of this process in a standard Petri-dish environment has revealed the dynamics of the laser microbeam-mediated cell lysis process.18–20 Specifically, the delivery of a pulsed laser microbeam to a confluent monolayer of adherent cells results in the formation of a laser-induced plasma (ionized gas) followed by the radiation of a pressure shock wave and cavitation bubble formation, expansion, and collapse. These processes from initiation to completion occur on a typical time scale of tens of microseconds. Depending on the location of the cell relative to the site of the laser microbeam delivery, cell lysis is observed to occur on the nanosecond to microsecond time scale with the cavitation bubble dynamics serving as an efficient means to mix the lysed cellular contents.21
This success has motivated our interest to examine the use of pulsed laser microbeam irradiation to lyse suspension cells in a microfluidic environment. The use of pulsed laser microbeams for rapid cell lysis in microfluidic channels may be particularly advantageous for LOC applications. First, the use of pulsed laser microbeam irradiation does not require the incorporation of any specialized on-chip instrumentation. This reduces greatly the design complexity and cost of the individual microdevice thereby making it economical to dispose of the LOC device after a single-use. Rather, one must invest in a laser platform and a microscope objective to deliver the laser radiation into the microdevice. Second, the laser microbeam can be directed to any optically-accessible location within the microdevice. This provides tremendous flexibility with respect to the timing and location of cell lysis; enabling potentially the analysis of several cells at multiple device locations. Third, the sheer speed of laser microbeam-based lysis process makes it ideal for analytical applications where the analyte of interest displays rapid kinetics.
Using time-resolved bright-field and fluorescence microscopies, we have examined pulsed laser microbeam lysis of suspension cells in a microfluidic environment on the nanosecond to second time scale. This examination provides the basis for understanding the mechanism and dynamics of the lysis of suspension cells using pulsed laser microbeams, as well as the possible dispersal and dilution of the cellular contents. These issues are critical for evaluating their potential use in future LOC applications.
2 Materials and methods
2.1 Microfluidic channel fabrication
The microfluidic device master was fabricated by spin coating a SU-8 photoresist layer onto a silicon wafer. The microchannel pattern was etched using standard photolithography techniques. Fig. 1a and 1b show the microchannel design that consists of a straight channel with one inlet and one outlet. The channel dimensions are 50 μm width × 30 μm height with an overall length of 2 cm and height of 3 mm. To facilitate the introduction of cells and fluid into the channel without clogging, the inlet and outlet were designed with a triangular shape that gradually narrows to the 50 μm width of the microchannel.
Fig. 1.
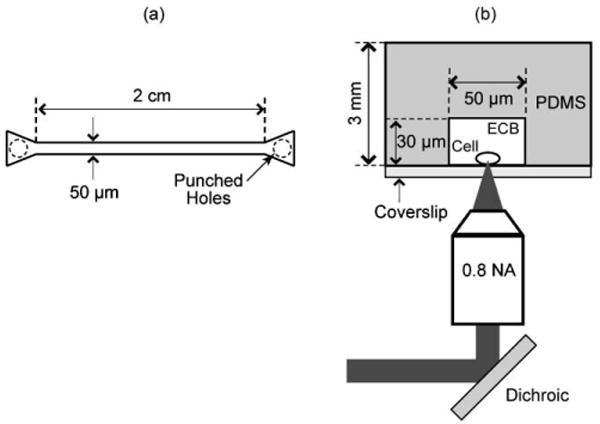
(a) Top view of microfluidic chip design. (b) Experiment geometry.
The microfluidic channel shown in Fig. 1a was fabricated from poly(dimethylsiloxane) (PDMS) using casting techniques. A two-part silicone resin (Sylgard 184, Dow Corning Corp.) was mixed in a 10 : 1 ratio (part A/part B, v/v), poured over the silicon master, degassed, and cured at 70 °C for 1 h. The cured polymer was peeled from the silicon master, plasma treated, and sealed against a number 0 glass coverslip after punching holes at the inlet and outlet for access.
2.2 Loading cells with fluorescent compounds
We used non-adherent BAF-3 cells, cultivated in growth media with 10% fetal bovine serum (FBS) solution. The cells were loaded with a CellTracker™ Red dye (Invitrogen-Molecular Probes, CMTPX C34552) that contains a chloromethyl group. The reagent diffuses freely through the cell membrane and once inside, the chloromethyl group reacts with thiols in the cytosol which transforms it into a cell-impermeant fluorescent dye.22
The fluorescent CellTracker™ Red dye was loaded into the cells by first centrifuging the cells at 1000g for 1 min to separate the cells from the growth medium (GM). The GM was replaced with a physiologic extracellular buffer (ECB) composed of 135 mM NaCl, 5 mM KCl, 10 mM HEPES, 2 mM MgCI2, 2 mM CaCl2, and adjusted to pH 7.4 with NaOH. After replacing the GM with ECB, the cells are resuspended and the washing procedure is repeated two times to ensure the complete removal of the GM. The ECB buffer is replaced by a 5 μm solution of the CellTracker™ Red (λex = 577 nm, λem = 602 nm) in ECB. The cells were incubated at room temperature in the dark for 30 min. The ECB buffer washing procedure is then repeated three times to remove the excess dye from solution. Finally, the cells are incubated in ECB for 30 min at 37 °C.
The cells were loaded into the microfluidic channel by inserting a drop of the cell solution at the inlet. Vacuum is applied at the outlet to initiate the flow of cells and ECB into the channel. The remaining liquid at the inlet is removed with a micropipette. To stop the flow, the same volume of cell solution is poured at the inlet and at the outlet of the microchannel. In this way the cells drop to the bottom of the channel as depicted in Fig. 1b.
2.3 Lasers and illumination
We use an EKSPLA SL332 Nd:YAG laser that emits 540 ps pulses at λ = 532 nm with an intrinsic pulse energy variation of ±5%. As depicted in Fig. 2, the laser pulses are linearly polarized and directed to a half-wave (λ/2) plate to rotate the polarization. The polarization-sensitive beam splitter divides the beam into separate low energy and high energy beam lines. The low energy beam line is made to pass through a spatial filter and directed into the epifluorescence port of an inverted microscope (Zeiss Axiovert 100) where it is reflected by a dichroic (580dcxr, Chroma Technology Corp. Rockingham, VT) to be focused into the sample by a water immersion microscope objective (Zeiss, Achroplan 40×, 0.8 NA). The objective focuses the laser pulse approximately 2 μm above the cover glass slide and at the center of the microchannel as shown in Fig. 1b. The high-energy portion of the beam is directed into a cuvette containing a fluorescent dye (LDS 590 or LDS 698, Exciton, Dayton, OH, USA). The fluorescent emission from the cuvette is coupled into a 600 μm-diameter multimode optical fiber. The length of the optical fiber is chosen to deliver the illumination for bright-field or fluorescence imaging at the desired time delay relative to the arrival of the pulsed laser microbeam in the microfluidic channel.
Fig. 2.
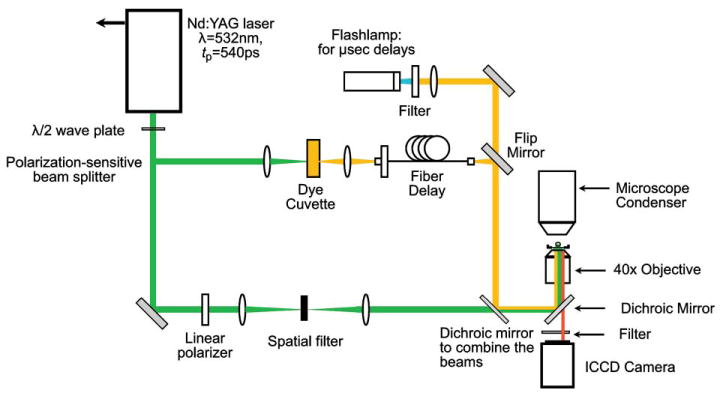
Experiment setup for time-resolved fluorescence imaging.
2.4 Bright-field imaging
The experimental setup for the time resolved imaging in bright field configuration has been described elsewhere.18,19 The fluorescent dye (LDS 698, Exciton, Dayton, OH, USA) used in the cuvette emits light at λem = 698 nm. The fluorescence emission from the cuvette is collected by a lens and focused into an optical fiber that guides it into the condenser of the microscope to illuminate the sample (not shown). This light is transmitted by the dichroic in the microscope cube so that it can pass through to the camera. For longer time delays we use a flashlamp triggered by the laser for illumination. A long pass filter (LP 570, Edmund Optics, Barrington, NJ, USA) is used on the microscope cube to block any reflections of λ = 532 nm light from the pulsed laser microbeam.
2.5 Fluorescence imaging
Fig. 2 depicts the experimental setup employed for time-resolved fluorescent imaging. To provide illumination, we use a dye (LDS 590, Exciton, Dayton, OH, USA) in the cuvette that emits light at λem = 590 nm which is coupled into an optical fiber. The fiber emission is directed along the same path as the laser pulse that is focused into the sample. This is done by using a dichroic mirror that transmits the λ = 532 nm light from the laser and reflects the fluorescent emission from the cuvette into the epifluorescence port of the microscope. The λ = 590 nm emission from the optical fiber is reflected by the dichroic in the microscope cube (580dcxr, Chroma Technology Corp. Rockingham, VT) into the rear aperture of the microscope objective to illuminate the sample. The light from the optical fiber is divergent, and thus illuminates a wide field of view after passing through the microscope objective. By varying the length of the optical fiber, we can change the time delay of the illumination with respect to the arrival of the pulsed laser microbeam into the sample. For longer time delays (>4.5 μs) we replace the fiber optic illumination with flashlamp illumination (Nanolite KL-L, High-Speed Photo System, Wedel, Germany) triggered by the laser. The output of the flashlamp is directed through a narrow band pass filter (HQ580/20×, Chroma Technology Corp. Rockingham, VT) centered at λ = 580 nm and follows the same optical path as the light from the optical fiber. A narrow band pass filter (HQ630/6 m, Chroma Technology Corp. Rockingham, VT) centered at λ = 630 nm is used at the bottom of the microscope cube to block the excitation light and transmit only the fluorescence emission from the CellTracker™ Red dye to the camera.
2.6 Camera
The images were acquired using a gated intensified CCD camera (Princeton Instruments PI-MAX 512, Roper Scientific, Trenton, NJ) that was triggered by a TTL pulse from the laser Q-switch. For the bright-field images we use a 1 ns gate time for images taken with a time delay up to 1500 ns. For the pictures taken with the flashlamp, we use a 10 ns gate time for time delays of 4.5 to 20 μs, and 1 μs gate time for time delays ≥1 ms. For the fluorescence images, a 10 ns gate time is used for pictures taken with a time delay up to 1500 ns. For images acquired using flashlamp excitation, a 400 ns gate time is used for delay times in the interval 4.5 to 20 μs, and gate times of l μs for time delays ≥1 ms. Longer exposure times are necessary when using the flashlamp for illumination as its specific intensity in the spectral window for fluorescent excitation is much lower than the emission provided by the dye cuvette.
3 Results and discussion
3.1 Energy threshold for pulsed laser microbeam-induced plasma formation
As discussed in the Introduction, laser-microbeam cell lysis is initiated by the formation of a laser-induced plasma. To perform the cell lysis study, we first must determine the minimum laser pulse energy necessary to reliably form a laser-induced plasma formation in the microfluidic channel. To establish this, we filled the microfluidic channel with the ECB and determined the probability of plasma formation at discrete pulse energies. This data for the probability of plasma formation p vs. pulse energy Ep, shown in Fig. 3 was fit to a Gaussian error function which adequately models the stochastic nature of laser-induced plasma formation23
Fig. 3.
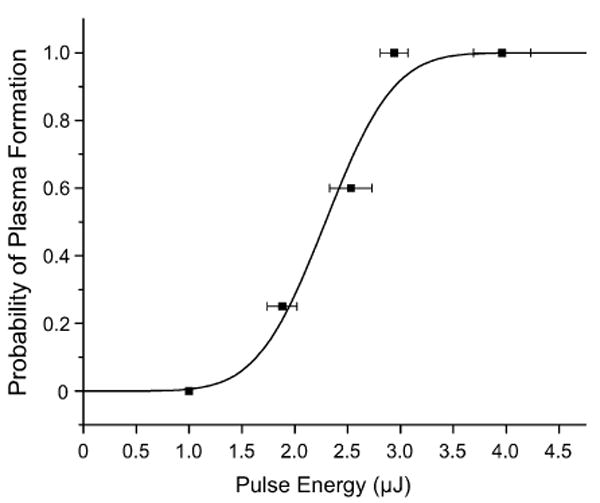
Probability of plasma formation within the microfluidic channel as a function of pulse energy. The plasma threshold energy and sharpness governing the probability as predicted by the Gaussian error function are Ep = 2.29 ± 0.08 μJ and S = 1.4 ± 0.3 μJ−1. See text for further details.
| (1) |
where , Eth is the ‘threshold’ energy for plasma formation, i.e., the pulse energy that creates a plasma 50% of the time, and S governs the ‘sharpness’ of the Gaussian error function. The parameters determined by the fit shown in Fig. 3 are S = 1.4 ± 0.3 μJ−1 and Eth = 2.29 ± 0.8 μJ.
From the result of this experiment we adjusted the mean laser pulse energy to 4.63 μJ, corresponding to 2 × Eth. This ensures that a plasma is formed by the delivery of every laser pulse. The plasma formation within the focal volume provides a mechanism for energy absorption in an otherwise transparent medium. This energy deposition in the plasma results in a violent expansion and the emission of a shock wave. This expansion results in plasma cooling and electron-ion recombination. The end result is the formation of a cavitation bubble that expands and collapses on a microsecond time scale.18,19,24
3.2 Plasma formation, shock wave propagation, and cavitation bubble dynamics within the PDMS microfluidic channel
Fig. 4 provides a series of time-resolved bright-field images that depict the dynamics produced by the delivery of the pulsed laser microbeam into the microfluidic channel. There is no flow in the channel and scale bar is 50 μm in length. To provide the clearest visualization of the plasma formation, shock wave emission and cavitation bubble dynamics, this image series was performed without the presence of any cells in the microfluidic channel. The presence of cells do not alter significantly the dynamics shown. Each picture shown was acquired from a different event. Nevertheless, we found the process to be very reproducible so long as the laser microbeam is positioned in the same location within the channel. At 13 ns following the arrival of the pulsed laser microbeam in the channel, a rapidly expanding cavitation bubble has already formed. Moreover, portions of the shock wave that result from the plasma formation and cavitation bubble expansion are beginning to propagate out of the microfluidic channel and into the PDMS. At 27 ns the cavitation bubble has continued to expand and the shock wave is no longer circular due to the difference in propagation velocities in the ECB and PDMS. The further expansion of the cavitation bubble results in deformation of the microfluidic channel walls as evident in the images taken at delay times of 91 ns and 239 ns. A maximum bubble volume of 220 pL is attained at a time of 1.47 μs following the arrival of the pulsed laser microbeam. The subsequent bubble collapse results in two residual gas bubbles as seen at a delay time of 18.55 μs. The gas content of the bubble diffuses into the liquid on a time scale of seconds. Sometimes the two residual bubbles are seen to coalesce into a single bubble at 20 ms.
Fig. 4.
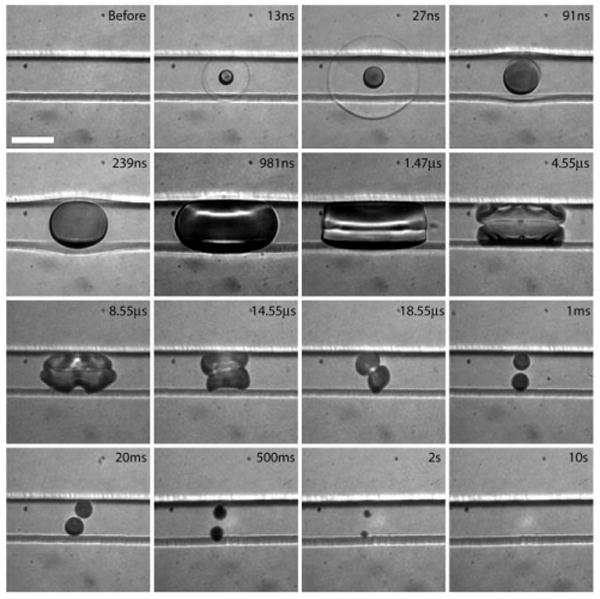
Bright-field images of the cavitation bubble dynamics inside the microfluidic channel on times scales spanning 9 orders of magnitude from 10 ns to 10 s. Scale bar = 50 μm.
Two aspects of the observed dynamics warrant further discussion. First, the deformation of the walls of the PDMS channel is very effective in dissipating the mechanical energy of the cavitation bubble thereby reducing significantly its overall volume. In fact, in a separate experiment, we delivered a pulsed laser microbeam under the same focusing conditions and energy to an open dish containing ECB and observed a maximum cavitation bubble volume of 2.6 nL; a volume nearly 12× larger than that observed in the microfluidic channel. This reduction in bubble size (and mechanical bubble energy) is due directly to the energy dissipation produced by the mechanical deformation of the microfluidic channel as well the shear stress offered by the channel walls that impedes the outward fluid flow of the ECB as the bubble expands. The reduction in mechanical bubble energy is significant. The bubble energy Eb is given by Eb = Vmax(P0 − pv), i.e., the product of the maximum bubble volume Vb and the difference in the ambient and vapor pressures (p0 − pv).25,26 Simple calculations reveal that over 5.5% of the incident laser pulse energy is converted to mechanical cavitation bubble energy when formed in an open environment which is reduced to a mere 0.47% when the bubble is formed within the confines of the flexible PDMS microfluidic channel. A more rigid channel material (e.g., glass or polyethylene) or larger channel width would be less effective in dissipating the bubble energy and would likely result in a larger cavitation bubble size and mechanical disruption over a much larger region in the channel. Second, the residual bubbles observed on the millisecond to second time scales following the laser microbeam delivery are likely due to degassing from the PDMS channels and/or dissolved gas present in the ECB. This may prove to be an impediment for electrophoresis. However, we expect that this can be mitigated with the development of gas-impermeant coatings for the PDMS channels and/or degassing the ECB and chip in vacuum prior to the procedure.
3.3 Lysis dynamics of suspension cells within the PDMS microfluidic channel
With knowledge of the characteristics of the physical process initiated by the delivery of the pulsed laser microbeam into the microfluidic channel, we sought to visualize the cell lysis process. Fig. 5 provides bright field images of a single BAF-3 cell within the microchannel before and after pulsed laser microbeam irradiation. Because the cavitation bubble possesses much greater contrast than a BAF-3 cell in both bright-field and phase-contrast image modalities, we resorted to the use of time-resolved fluorescence imaging to visualize the cell lysis process produced by the pulsed laser microbeam. Fig. 6 provides a series of time-resolved fluorescence images that depict the interaction of a single BAF-3 cell (loaded with the CellTracker™ dye) with the laser-induced cavitation bubble at delay times similar to those shown in Fig. 4. The small difference in delay times between the individual panels in the two figures is due to the slightly different lengths of the optical path for the excitation used for the fluorescence images and the illumination for the bright-field images. There is no flow in the channel and the scale bar length is 50 μm. Because the imaging system is only capable of a single exposure during the time course of the lysis process, each picture shown was acquired from a different lysis event. Nevertheless, we found the process to be very reproducible so long as the cell and laser microbeam were positioned in the same location within the channel (shown in Fig. 1b).
Fig. 5.
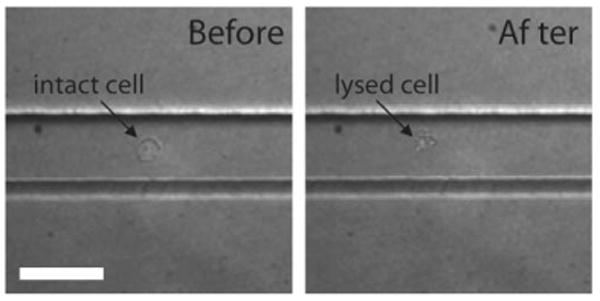
Bright-field images of a BAF-3 cell within the microchannel before and after delivery of the pulsed laser microbeam in the microfluidic channel. Scale bar = 50 μm.
Fig. 6.
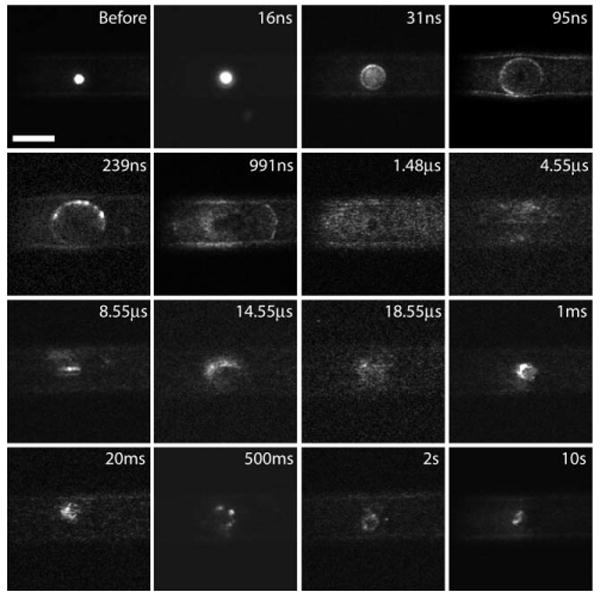
Fluorescent cell lysis dynamics inside the microfluidic chip. Fluorescent images of the laser-microbeam cell lysis process inside the microfluidic channel on times scales spanning 9 orders of magnitude from 10 ns to 10 s. Scale bar = 50 μm.
At 16 ns we see that the light emission from the plasma produced by the pulsed laser microbeam irradiation excites the fluorescence of the cell and makes the cell very bright. At 31 ns the outline of the bubble is clearly visible because during its expansion it compresses the cell against the top and side walls of the microchannel and the fluorescent contents have already started to be released from the cell. At 95 ns and 239 ns time delays, the cell appears to have been lysed completely and the fluorescent cytosol has been dispersed around the entire periphery of the bubble as well as almost the entire length of the microfluidic channel within the field of view. In this and many of the following images, there appears to be a dark spot in the center that has roughly the same size of the cell (before frame). This is likely due to photobleaching of the fluorescent dye by the intense ultraviolet/visible luminescence produced by the laser microbeam-induced plasma.
The spatial patterns of the individual panels in Fig. 6 bear strong correlation to the corresponding bright-field image panels in Fig. 4 that depict the cavitation bubble dynamics. At time delays of 991 ns and 1.481 μs the outline of the bubble is still clearly visible and the fluorescent cytosol is fully dispersed. After 1.481 μs the bubble begins to collapse. The bubble collapse is accompanied by a inward fluid flow back towards the center of the bubble. This achieves a significant measure of ‘re-concentration’ of the fluorescent cytosol as seen at time delays of 14.55 μs and after. At 1 ms we see the outline of the two residual bubbles whose vapor contents begin diffusing into the liquid. The shadow of the two bubbles surrounded by the fluorescent contents can still be seen at times up to 2 s after the pulse is delivered. Remarkably, even at 2 s and 10 s following the delivery of the laser microbeam, we see that while there is fluorescence dispersed throughout the microfluidic channel there is a particularly high concentration of the fluorescence in the region occupied by the cell prior to the lysis process.
3.4 Cell positioning
In performing these experiments, we observed that in order to disrupt the cell membrane completely, it is important to position the focal volume of the pulsed laser microbeam within a few micrometers of the center of the cell. If this co-localization of the focal volume of the pulsed laser microbeam with the cell is not achieved, the cavitation bubble simply pushes the cell towards either the wall of the microfluidic channel or along the length of the channel itself. While the cell is sometimes lysed by being crushed against the wall, in the majority of cases the cell remains intact.
Fig. 7 provides an example of a case where the cell is positioned at several micrometers away from the center of the channel while the laser focus is maintained at the center of the channel and 2 μm above glass coverslip. At a delay time of 489 ns the cell can be seen to be crushed against the side of the microfluidic channel. This is very different than the case shown in Fig. 6 where the contents of the cell are well-dispersed around the periphery of the cavitation bubble. A couple of seconds following the laser pulse, the cell is still largely intact, however it has leaked some of the fluorescent dye. This result is typical and demonstrates the need for micrometer precision when positioning the cell relative to the focal volume of the pulsed laser microbeam in order to obtain reproducible cell lysis inside microfluidic chips.
Fig. 7.
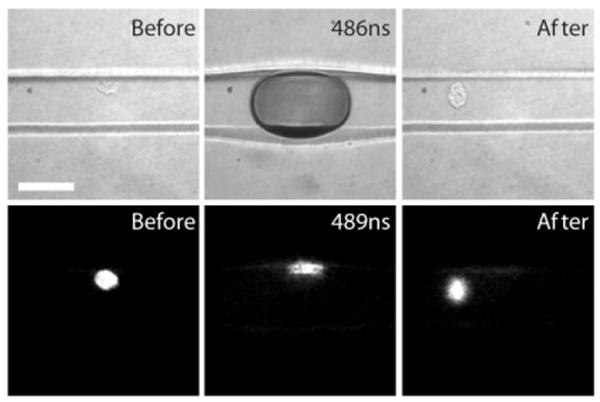
Attempted lysis of the cell not positioned in the center of the microfluidic channel. Scale bar = 50 μm.
3.5 Dilution of cell contents
To estimate the dilution of the fluorescent dye after lysis, we examined an area encompassing 50 μm × 50 μm of the fluorescent images before lysing the cell and 10 s following delivery of the pulsed laser microbeam. In both images, the fluorescence excitation was provided using the emission from the fluorescent dye cell and the camera gate width was 10 ns. Fig. 8a and b show the cell before and after lysis, respectively. Fig. 8c and d show only the 50 μm × 50 μm area over which the fluorescence was measured. The integrated fluorescent intensity in Fig. 8d is 75% of that in Fig. 8c. This is a typical result. In 6 cases in which such a comparison was made the detected integrated fluorescence 10 s post-lysis was consistently between 65% and 80% of the pre-lysis image.
Fig. 8.
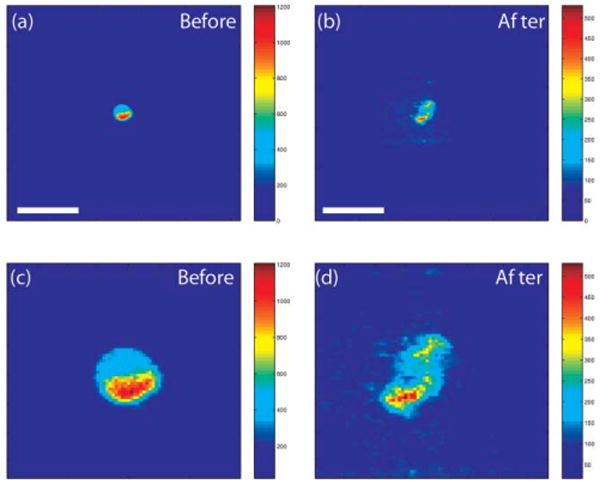
(a) Cell before lysis, (b) after lysis (scale bar = 50 μm). The size of the two bottom frames is 50 × 50 μm.
Closer examination of the images shown in Fig. 6 reveal that at time delays of 1 ms to 2 s, while there is a focal region of intense fluorescence within the channel, there is also a ‘diffuse background’ of fluorescence throughout the entire channel. However, the image at 10 s reveals only a focal region of fluorescence amidst a dark and nearly fluorescence-free background. This observation is consistent with the notion that both small molecules (glutathione and peptides) and large proteins and organelles within the cytosol are labeled by the CellTracker dye. The small molecules have a large mass diffusivity and are highly mobile. As a result they disperse within a few seconds following the lysis event leaving the larger cellular constituents behind.
There are two important implications for these observations. Small molecules, such as ATP, glucose, amino acids, or Mg2+, which play key roles in many cellular reactions, are likely to be rapidly diluted by the combined effects of the laser-mediated phenomena and diffusion. Thus to the extent that these molecules are diluted, cellular reactions that require their presence will be dramatically slowed and their reactions effectively terminated on millisecond time scales by laser-based lysis. By contrast, slowly diffusing molecules such as large proteins, protein complexes, and organelles are effectively re-concentrated by the reverse fluid flow created by the collapsing bubble. These large entities (with small mass diffusivities) remain in a tight plug and are available for analysis or manipulation at essentially undiluted concentrations compared to that in the cell. Thus, for large cellular molecules with very low diffusion coefficients, the laser achieves rapid cell lysis with minimal dilution.
4 Conclusions
The results of the time-resolved bright-field and fluorescence imaging have provided a detailed view of the dynamics of cell lysis produced by the delivery of a pulsed laser microbeam within a microfluidic channel. The deformation of the PDMS microfluidic channel walls is effective in dissipating the mechanical energy of the cavitation bubble and confining it to a sub-nL volume. The initial release and dispersion of the cell contents occurs on the sub-microsecond time scale. This characteristic of pulsed laser microbeam cell lysis makes it a strong candidate for analytical applications where the biochemical dynamics of the analyte of interest is very rapid.
Another positive characteristic of the pulsed laser microbeam cell lysis process is that while the initial dispersion and dilution of the cell contents is significant, the fluid flow associated with the cavitation bubble collapse relocalizes the cell contents with minimal dilution. This re-localization of the cell contents is consistent with the present understanding of cavitation bubble dynamics in microfluidic channels.21,27 The end effect is that cellular biochemical reactions are effectively terminated on the millisecond time scale. While the small molecular constituents of the cytosol will disperse rapidly due to diffusion, large, slowly diffusing molecules will be present within a tight plug at nearly undiluted concentrations. These characteristics are particularly advantageous for subsequent analysis or manipulation of these cellular constituents. Given the relative ease with which optical methods can be integrated with microfluidic devices, we expect that the use of pulsed laser microbeam cell lysis may provide a powerful method for a broad variety of LOC applications.
Acknowledgments
We acknowledge support from the National Institutes of Health via the Laser Microbeam and Medical Program P41-RR-01192 and R01-EB04436.
References
- 1.He MY, Kuo JS, Chiu DT. Electro-generation of single femtoliter- and picoliter-volume aqueous droplets in microfluidic systems. Appl Phys Lett. 2005;87(3):031916. [Google Scholar]
- 2.He M, Edgar JS, Jeffries GDM, Lorenz RM, Shelby JP, Chiu DT. Selective encapsulation of single cells and subcellular organelles into picoliter- and femtoliter-volume droplets. Anal Chem. 2005;77(6):1539–1544. doi: 10.1021/ac0480850. [DOI] [PubMed] [Google Scholar]
- 3.Lorenz RM, Edgar JS, Jeffries GDM, Chiu DT. Microfluidic and optical systems for the on-demand generation and manipulation of single femtoliter-volume aqueous droplets. Anal Chem. 2006;78(18):6433–6439. doi: 10.1021/ac060748l. [DOI] [PubMed] [Google Scholar]
- 4.Chiu DT. Micro- and nano-scale chamical analysis of individual sub-cellular compartments. Trends Anal Chem. 2003;22(9):528–536. [Google Scholar]
- 5.Andersson H, van den Berg A. Microfluidic devices for cellomics: A review. Sens Actuators, B. 2003;92(3):315–325. [Google Scholar]
- 6.Voldman J. Engineered systems for the physical manipulation of single cells. Curr Opin Biotechnol. 2006;17(5):532–537. doi: 10.1016/j.copbio.2006.07.001. [DOI] [PubMed] [Google Scholar]
- 7.Yi C, Li CW, Ji S, Yang M. Microfluidics technology for manipulation and analysis of biological cells. Anal Chim Acta. 2006;560(1–2):1–23. doi: 10.1016/j.aca.2018.06.054. [DOI] [PubMed] [Google Scholar]
- 8.Sims CE, Allbritton NL. Analysis of single mammalian cells on-chip. Lab Chip. 2007;7(4):423–440. doi: 10.1039/b615235j. [DOI] [PubMed] [Google Scholar]
- 9.McClain MA, Culbertson CT, Jacobson SC, Allbritton NL, Sims CE, Ramsey JM. Microfluidic devices for the high-throughput chemical analysis of cells. Anal Chem. 2003;75(21):5646–5655. doi: 10.1021/ac0346510. [DOI] [PubMed] [Google Scholar]
- 10.Toner M, Irimia D. Blood-on-a-chip. Annu Rev Biomed Eng. 2005;7:77–103. doi: 10.1146/annurev.bioeng.7.011205.135108. [DOI] [PMC free article] [PubMed] [Google Scholar]
- 11.Munce NR, Li J, Herman PR, Lilge L. Microfabricated system for parallel single-cell capillary electrophoresis. Anal Chem. 2004;76(17):4983–4989. doi: 10.1021/ac0496906. [DOI] [PubMed] [Google Scholar]
- 12.Ling YY, Yin XF, Fang ZL. Simultaneous determination of glutathione and reactive oxygen species in individual cells by microchip electrophoresis. Electrophoresis. 2005;26(24):4759–4766. doi: 10.1002/elps.200500232. [DOI] [PubMed] [Google Scholar]
- 13.Sun Y, Yin XF. Novel multi-depth microfluidic chip for single cell analysis. J Chromatogr, A. 2006;1117(2):228–233. doi: 10.1016/j.chroma.2006.03.088. [DOI] [PubMed] [Google Scholar]
- 14.Ocvirk G, Szarka RJ, Salimi-Moosavi H, Arriaga EA, Andersson PE, Smith R, Dovichi NJ, Harrison DJ. β-Galactosidase assays of single-cell lysates on a microchip: A complementary method for enzymatic analysis of single cells. Proc IEEE. 2004;92(1):115–125. [Google Scholar]
- 15.Wang HY, Lu C. A magnetic microstirrer and array for microfluidic mixing. Chem Commun. 2006:3528–2530. doi: 10.1039/b605722e. [DOI] [PubMed] [Google Scholar]
- 16.Sims CE, Meredith GD, Krasieva TB, Berns MW, Tromberg BJ, Allbritton NL. Laser-micropipet combination for single-cell analysis. Anal Chem. 1998;70(21):4570–4577. doi: 10.1021/ac9802269. [DOI] [PubMed] [Google Scholar]
- 17.Li H, Sims CE, Wu HY, Allbritton NL. Spatial control of cellular measurement with the laser micropipet. Anal Chem. 2001;73(19):4625–4631. doi: 10.1021/ac0105235. [DOI] [PubMed] [Google Scholar]
- 18.Rau KR, Guerra AG, III, Vogel A, Venugopalan V. Investigation of laser-induced cell lysis using time-resolved imaging. Appl Phys Lett. 2004;84(15):2940–2942. [Google Scholar]
- 19.Rau KR, Quinto-Su PA, Hellman AN, Venugopalan V. Pulsed laser microbeam induced cell lysis: Time-resolved imaging and analysis of hydrodynamic effects. Biophys J. 2006;91(15):317–329. doi: 10.1529/biophysj.105.079921. [DOI] [PMC free article] [PubMed] [Google Scholar]
- 20.Quinto-Su PA, Venugopalan V. Mechanisms of laser cellular microsurgery. Methods Cell Biol. 2007;82:113–151. doi: 10.1016/S0091-679X(06)82004-2. [DOI] [PubMed] [Google Scholar]
- 21.Hellman AN, Rau KR, Yoon HH, Bae S, Palmer JF, Phillips KS, Allbritton NL, Venugopalan V. Laser-induced mixing in microfluidic channels. Anal Chem. 2007;79(12):4484–4492. doi: 10.1021/ac070081i. [DOI] [PubMed] [Google Scholar]
- 22.Molecular Probes, Inc. CellTracker™ probes for long-term tracing of living cells, Publication #MP 02925. 2006. [Google Scholar]
- 23.Vogel A, Nahen K, Theisen D, Noack J. Plasma formation in water by picosecond and nanosecond Nd:YAG laser pulses—Part I: Optical breakdown at threshold and superthreshold irradiance. IEEE J Sel Top Quantum Electron. 1996;2(4):847–860. [Google Scholar]
- 24.Vogel A. Nonlinear absorption: Intraocular microsurgery and laser lithotripsy. Phys Med Biol. 1997;42(5):895–912. doi: 10.1088/0031-9155/42/5/011. [DOI] [PubMed] [Google Scholar]
- 25.Cole RH. Underwater Explosions. Princeton University Press; 1948. [Google Scholar]
- 26.Brennen CE. Cavitation and Bubble Dynamics. Oxford University Press; New York: 1995. [Google Scholar]
- 27.Zwann E, Le Gac S, Tsuji K, Ohl CD. Controlled cavitation in microfluidic systems. Phys Rev Lett. 2007;98(25):254501. doi: 10.1103/PhysRevLett.98.254501. [DOI] [PubMed] [Google Scholar]


