

Abstract
In this paper, we introduce a fast and accurate side-chain modeling method, named OPUS-Rota. In a benchmark comparison with the methods SCWRL, NCN, LGA, SPRUCE, Rosetta, and SCAP, OPUS-Rota is shown to be much faster than all the methods except SCWRL, which is comparably fast. In terms of overall χ 1 and χ 1+2 accuracies, however, OPUS-Rota is 5.4 and 8.8 percentage points better, respectively, than SCWRL. Compared with NCN, which has the best accuracy in the literature, OPUS-Rota is 1.6 percentage points better for overall χ 1+2 but 0.3 percentage points weaker for overall χ 1. Hence, our algorithm is much more accurate than SCWRL with similar execution speed, and it has accuracy comparable to or better than the most accurate methods in the literature, but with a runtime that is one or two orders of magnitude shorter. In addition, OPUS-Rota consistently outperforms SCWRL on the Wallner and Elofsson homology-modeling benchmark set when the sequence identity is greater than 40%. We hope that OPUS-Rota will contribute to high-accuracy structure refinement, and the computer program is freely available for academic users.
Keywords: rotamers, side-chain modeling, structure prediction, high-accuracy refinement
In the post-genomic era, computational structure prediction has becoming increasingly important and powerful. Accurately determining a protein structure from its amino acid sequence, however, is still very challenging. One of the most pressing bottlenecks is the fast and accurate modeling of side-chain conformations, which is particularly important in high-accuracy refinement of predicted structure models.
The most successful side-chain modeling methods employ rotamer libraries to reduce the space of conformations that must be sampled (Ponder and Richards 1987; Dunbrack Jr. and Karplus 1993; DeMaeyer et al. 1997; Dunbrack Jr. and Cohen 1997; Lovell et al. 2000). In the rotamer approach, side-chain conformations are restricted to a small set of positions drawn from a rotamer library of likely conformations, which are, in turn, derived from a database of high-resolution X-ray structures. Many rotamer-based side-chain modeling methods have been developed, such as those with enhanced sampling schemes (Goldstein 1994; Gordon and Mayo 1999; Pierce et al. 2000; Looger and Hellinga 2001; Desmet et al. 2002; Canutescu et al. 2003; Chazelle et al. 2004; Kingsford et al. 2005; Xu 2005; Xie and Sahinidis 2006; Chong and Leong 2007; Georgiev and Donald 2007; Hartmann et al. 2007; Santana et al. 2007; Spassov et al. 2007), those with powerful energy functions (Xiang and Honig 2001; Jacobson et al. 2002; Liang and Grishin 2002; Gray et al. 2003; Eyal et al. 2004; Peterson et al. 2004; Hartmann et al. 2007; Leaver-Fay et al. 2007; Lopes et al. 2007; Xiang et al. 2007; Zhu et al. 2007), those that allow small deviations in standard rotamer conformations (Mendes et al. 1999; Wang et al. 2005; Jain et al. 2006), and one that uses environment-specific substitution probabilities (Smith et al. 2007). Non-rotameric methods include Grow-to-Fit MD (Zhang and Duan 2006).
The current state-of-the-art side-chain prediction methods leave room for improvement in accuracy and speed. Fast rotamer methods such as SCWRL (Canutescu et al. 2003) can rapidly find the global minimum by using a simple pairwise energy function and dead-end elimination (DEE) (Goldstein 1994). The accuracy of this approach is limited because the energy function is oversimplified, and accurate potential functions are essential in side-chain modeling (Xiang and Honig 2001; Hartmann et al. 2007). However, the more accurate energy functions, such as the ones in the methods NCN (Peterson et al. 2004) and LGA (Liang and Grishin 2002), often contain long-range and multi-body terms, which are computationally expensive. Since the speed of execution in side-chain modeling is crucial in the iterative process of high-accuracy refinement, new fast and accurate methods are urgently needed.
In this study, we present a new method, OPUS-Rota, for modeling side-chain conformations. OPUS-Rota employs two important energy terms in addition to the commonly used rotamer frequency and van der Waals (vdW) potential terms. The first energy term is a newly developed orientation-sensitive potential called OPUS-PSP (Lu et al. 2008), which is specifically designed to describe side-chain packing interactions. Since OPUS-PSP is a short-range, pairwise, and coarse-grained all-atom potential, it allows for fast and accurate calculation during intensive sampling. Another energy term is a pairwise explicit solvation energy term, which accounts for solvation effects without dramatically increasing computational cost. With the help of a heat bath Monte Carlo (Newman and Barkema 1999) sampling scheme and neighbor lists for all energy terms, OPUS-Rota can perform rapid sampling with high accuracy.
Based on our benchmark study using a 65-protein test set, OPUS-Rota is comparable in speed with SCWRL while achieving much more accurate side-chain placement. Compared with several other side-chain modeling methods that are more accurate than SCWRL, such as NCN, OPUS-Rota is typically one or two orders of magnitude faster while achieving similar or better accuracy on the same test set. In addition, OPUS-Rota consistently outperforms SCWRL on the Wallner and Elofsson homology-modeling benchmark set when sequence identity is >40% (Wallner and Elofsson 2005).
Results
Prediction accuracy definitions and tests
OPUS-Rota was first tested on a set of 65 high-resolution X-ray structures used in the literature (Peterson et al. 2004; Jain et al. 2006). The detailed results for each protein are presented both for overall (all residues) and for core residues in Table 1. Core residues are those residues whose solvent accessible ratio is <17%. With this definition, 53.5% of residues are considered core residues. The accuracy of χ 1 is defined as the percentage of residues whose predicted χ 1 dihedral is no more than 40° from the native value, and the accuracy of χ 1+2 is defined as the percentage of residues for which both χ 1 and χ 2 are in the 40° range. For more details regarding all of these definitions, see Materials and Methods.
Table 1.
The accuracy of OPUS-Rota on a 65-protein test set


Table 1 shows that the performance of OPUS-Rota, like other modeling methods, is protein dependent. For proteins such as 1cbn, 1c9o, 1igd, 1noa, 1rcf, and 7rsa, the core residues can be modeled almost perfectly. In general, the accuracies may fluctuate by ∼0.3 percentage points because our random sampling procedure produces slightly different results given the same set of initial conditions.
The histograms in Figure 1 illustrate the distributions of proteins by the measure of accuracy. The small variances of the χ 1 accuracies (open squares) suggest that OPUS-Rota is a generally consistent method across many types of proteins. In fact, the overall χ 1 accuracy never drops below 79.9% for the 65-protein test set, and all but four of the 65 proteins have core-residue χ 1 accuracies >90%. As expected, the χ 1 accuracy distributions are narrow relative to those of χ 1+2 (solid circles). Overall χ 1+2 accuracy is >70% for 61 of 65 proteins, and all but one protein have core-residue χ 1+2 accuracies >80%.
Figure 1.

Histograms of OPUS-Rota prediction accuracies for 65-protein test set. (Solid lines) Overall accuracies, (dotted lines) core residue accuracies, (open squares) χ 1 accuracy, (solid circles) χ 1+2 accuracy.
Figure 2 shows the accuracy of OPUS-Rota for each residue type. Serine has the lowest χ 1 accuracy for all residues and for core residues. The energetics of Ser are challenging to model because Ser has two side-chain heavy atoms (Oγ and Cβ), and it frequently has hydrogen bonding between its side-chain and main-chain atoms. In addition, many serines in the 65 test proteins have alternative positions.
Figure 2.

The accuracy of OPUS-Rota for each residue type. (A) Overall χ 1and χ 1+2 accuracies. (B) Core residue χ 1 and χ 1+2 accuracies (core residues are defined as the residues whose solvent-accessible ratio is below a cutoff of 17%). Ser has the lowest χ 1 accuracy for all residues (A) and for core residues (B). Polar and charged residues such as Glu and Lys are expected to have low χ 1+2 accuracy, especially for flexible surface residues. Hydrophobic and aromatic residues consistently have high accuracy except for His, which has high χ 1 accuracy but low χ 1+2 accuracy.
Polar and charged residues are expected to have low χ 1+2 accuracy, especially for flexible surface residues. Some studies (Holm and Sander 1992; Jacobson et al. 2002) suggest that the side-chain accuracy of surface residues can be improved by considering crystal contacts, since inter-protein contacts eliminate many possible surface residue rotamers. Crystal contacts are not considered in OPUS-Rota because the purpose of the current study is to predict side-chain positions from the sequence and main-chain conformation only.
Hydrophobic and aromatic residues consistently have high accuracy except for His, which has high χ 1 accuracy (overall ∼93%) but low χ 1+2 accuracy (overall ∼60%, core ∼70%). Low χ 1+2 accuracy is found even for core histidines, perhaps because it is difficult to model His flip states without knowing the protonation status.
Performance comparison with other methods
OPUS-Rota outperforms other methods in the literature in terms of combined speed and accuracy (see Table 2). On the same 65-protein test set, our algorithm is much faster than all others except SCWRL (Canutescu et al. 2003), which is comparably fast. The speed of SCWRL is inconsistent, however. For some large proteins (e.g., 1qlw), SCWRL may require very long computation time because of its combinatorial search of all rotamer states. The computational efficiency of OPUS-Rota, on the other hand, scales linearly with protein size. In addition, OPUS-Rota achieves 5.4 and 8.8 percentage points better accuracies than SCWRL for overall χ 1 and χ 1+2, respectively, and 5.7 and 9.5 percentage points better accuracies for core-residue χ 1 and χ 1+2. Compared with NCN (Peterson et al. 2004), which has the best accuracy in the literature, OPUS-Rota is 1.6 percentage points better for overall χ 1+2 but 0.3 points weaker for overall χ 1, and it is 0.4 and 1.3 percentage points better than NCN for core-residue χ 1 and χ 1+2.
Table 2.
The accuracy and speed of OPUS-Rota and several other side-chain modeling methods on the 65-protein test set

Sensitivity analysis of individual energy terms
To see how each energy term contributes to performance, the accuracy of four versions of OPUS-Rota were tested, each of which excluded a single term. For each three-term version of the energy function, the weights for the terms were kept the same as for the full four-term version. It was found that those weights were robust during attempts of re-optimization (see Materials and Methods). The results are summarized in Table 3. The terms ranked in descending order of contribution are: vdW potential, rotamer frequency term, orientation energy, and solvation energy.
Table 3.
The contribution of the energy terms of OPUS-Rota to its accuracy

With the addition of the orientation energy term OPUS-PSP, the overall χ 1 and χ 1+2 accuracies increased 0.7 and 1.9 percentage points, respectively, while core-residue χ 1 and χ 1+2 accuracies improved by 0.6 and 1.5. Most strikingly, χ 1 accuracy of Cys increased 5.3 percentage points, χ 1 and χ 1+2 accuracies of Asp increased by 4.0 and 5.0 points, respectively, χ 1+2 accuracies of Trp and His increased 4.8 and 4.4 points, respectively, core-residue χ 1 and χ 1+2 accuracies of Glu increased 3.4 and 4.8, respectively, and χ 1+2 accuracies of Arg and Lys improved by more than two percentage points. The results suggest that our orientation potential can effectively improve the side-chain modeling accuracy for big aromatic residues and polar or charged residues. The orientation energy term yields no apparent improvements for small hydrophobic residues, perhaps because other energy terms are already sufficient to model them.
In addition, we noticed that by including a specialized set of Lennard-Jones parameters, which allows, for example, main-chain and side-chain hydrogen bonding interactions, the overall χ 1 and χ 1+2 accuracies increased by approximately one percentage point each.
Tests using protein backbones predicted by homology modeling
In order to assess side-chain modeling performance in structure prediction, we tested both SCWRL and OPUS-Rota on the Wallner and Elofsson homology-modeling benchmark set (Wallner and Elofsson 2005). The main chains of the target proteins were extracted from structures generated by Modeller (Sali and Blundell 1993; Fiser et al. 2000) according to the template structures and alignments. Both types of structures output by Modeller, the initial structures whose conformations were mainly copied from the templates, and the final structures optimized by Modeller, were tested in terms of side-chain modeling accuracies of the χ 1 and χ 2 dihedral angles. SCWRL was found to be very slow in a few cases, and it stalled on protein 1qvb, which was therefore excluded from the accuracy results of SCWRL. For comparison, the results also include the side-chain accuracies for the initial and final structures generated by Modeller.
In general, the accuracy of side-chain placement on modeled main chains is worse than that on the native main chains for both SCWRL and OPUS-Rota. In addition, the accuracy falls with decreasing sequence identity, since the templates are becoming less similar to the target structures. This suggests that the quality of the side-chain modeling is sensitive to the accuracy of the main-chain coordinates.
As shown in Figure 3, OPUS-Rota performs consistently better than SCWRL when sequence identity is >40%. For initial structures with sequence identity >90%, overall χ 1 and χ 1+2 accuracies are 2.9 and 3.2 percentage points better than SCWRL, and core residue χ 1 and χ 1+2 accuracies are 4.3 and 5.3 percentage points better. For final structures with sequence identity >90%, overall χ 1 and χ 1+2 accuracies are 2.1 and 2.0 percentage points better than SCWRL, and core residue χ 1 and χ 1+2 accuracies are 3.4 and 4.5 percentage points better. The performance improvement is less when sequence identity is low. For sequence identity <40%, both methods have low accuracy, which is expected since the template structures are so far away from the target structures.
Figure 3.

Side-chain modeling accuracy for structures predicted by homology modeling in the Wallner and Elofsson benchmark set. Modeller generated the initial structures by copying aligned residues from the template, and then it added loops and refined these initial structures to produce the final structures. Side-chain modeling methods OPUS-Rota and SCWRL were then applied on main chains extracted from both the initial (left column) and the final (right column) structures from Modeller. The side-chain modeling accuracies of OPUS-Rota (circles), SCWRL (triangles), and Modeller (plotted for reference, squares) are shown as functions of the percentage of sequence identity. The structures are binned in sequence identity ranges of 10 percentage points, from 30% to 100%, and the modeling accuracies are averaged. (A) Overall χ 1 accuracy, (B) overall χ 1+2 accuracy, (C) core residue χ 1 accuracy, and (D) core residue χ 1+2 accuracy.
One additional observation is that, for higher sequence identity, there is a consistent trend that the modeling accuracies based on the initial structures are better than those based on the final structures. In addition, the gains in modeling accuracy of OPUS-Rota over SCWRL are consistently larger on the initial structures than on the final structures after the refinement by Modeller. Together, these two findings imply that there is still significant room to improve homology-modeling methods.
Discussion
In this paper, we introduce a new side-chain modeling method, OPUS-Rota, and demonstrate that it is fast and accurate compared with the leading methods in the literature, such as SCWRL (Canutescu et al. 2003), NCN (Peterson et al. 2004), LGA (Liang and Grishin 2002), SPRUCE (Jain et al. 2006), Rosetta (Wang et al. 2005), and SCAP (Xiang and Honig 2001). In terms of speed, OPUS-Rota is matched only by SCWRL. On a 65-protein native test set, in terms of χ 1 and χ 1+2 accuracies, OPUS-Rota is 5.4 and 8.8 percentage points better for all residues and 5.7 and 9.5 points better for core residues, respectively, than SCWRL. OPUS-Rota is also 1.6 percentage points better for overall χ 1+2 and 0.3 points weaker for overall χ 1 than NCN, which has the best accuracy in the literature. In other words, OPUS-Rota is more accurate than SCWRL with similar execution speed, and it is as accurate as or better than the most accurate methods in the literature, but with runtime that is one or two orders of magnitude shorter. Finally, and most importantly, in terms of combined speed and accuracy, OPUS-Rota outperforms all the methods available. In additional tests on the Wallner and Elofsson benchmark for homology modeling (Wallner and Elofsson 2005), OPUS-Rota outperforms SCWRL when the sequence identity is >40%. It is noted here that homology-modeled structures whose sequence identity is <40% deviate substantially from the native structures. Thus, the performance of side-chain modeling methods on those structures does not necessarily reflect the true capability of the methods.
OPUS-Rota is fast because it employs only pairwise, short-range energy terms, allowing for rapid energy updates when adjusting a single side chain per sampling step. The rotamer frequency, vdW, and orientation energy terms are by nature single-body or pairwise, but the solvation energy is typically a multi-body interaction. To sidestep the computational complexity of a multi-body calculation, OPUS-Rota uses the pairwise approximation method of Zhang et al. (2004) to calculate the solvent-accessible surface area. This pairwise method saves considerable CPU time because residue-by-residue updates require recalculating the contributions of the adjusted side chain only. In addition, pairwise, short-range energy terms permit the use of neighbor lists, which speed up calculation by rapidly referencing nearby interaction partners, e.g., atoms or blocks, for a specified side chain. Another time-saving feature is that these neighbor lists are generated such that they require no updates during sampling.
OPUS-Rota is accurate because it employs a specialized set of energy terms, including the side-chain packing potential OPUS-PSP, which has already been shown to outperform other statistical potentials in decoy recognition (Lu et al. 2008). OPUS-PSP is very sensitive to side-chain orientation and can therefore recognize subtle differences between rotamer states, yet it is tolerant to small deviations from a specific rotamer state. In addition, our specialized set of Lennard-Jones parameters favor main-chain and side-chain hydrogen and sulfide-bonding interactions.
Along with its strong overall side-chain modeling capabilities, OPUS-Rota shows significant improvement in modeling aromatic side chains due to several design features. First, the rotamer frequency term emphasizes the contributions of aromatic residues to the total energy. Second, the vdW potential is softer for aromatic side chains. This is necessary to allow the aromatic side-chain rotamers to find their preferred rotamer angles without being too inhibited by steric constraints, especially inside the crowded protein core. Third, the OPUS-PSP term is inherently more sensitive to the orientation of the aromatic planes.
We hope that a faster and more accurate side-chain modeling method like OPUS-Rota will contribute to high-accuracy structure refinement. The OPUS-Rota computer program may be obtained from us or through the website http://sigler.bioch.bcm.tmc.edu/MaLab.
Methods
The core components of OPUS-Rota are a heat bath Monte Carlo sampling scheme (Newman and Barkema 1999) and a four-term energy function, which includes the newly developed orientation-sensitive side-chain packing potential, OPUS-PSP (Lu et al. 2008). OPUS-Rota identifies native-like side-chain positions from several possible rotamer candidates in Dunbrack's backbone-dependent rotamer library (Dunbrack Jr. and Karplus 1993).
Energy function
The total energy function has four terms:
where Erot is the rotamer frequency term, Evdw is a modified 6-12 Lennard-Jones (LJ) potential, Eorient is the side-chain packing potential OPUS-PSP (Lu et al. 2008), and Esolvation is the solvation energy term. The three weights wvdw = 1.0, worient = 0.15, and wsolvation = 0.1 are optimized against a small set of high-resolution structures consisting of PDB structures 1aac, 1bpi, 1isu, 1ptx, 1xnb, 256b, 2erl, 2hbg, 2ihl, 5rxn, and 9rnt. These proteins were also included in the studies of other methods (Xiang and Honig 2001; Liang and Grishin 2002; Jain et al. 2006). The total energy excludes the contributions of pure interactions between main-chain groups since they are invariant during sampling.
Rotamer frequency term
The rotamer frequency term Erot takes the form:
 |
where, for N residues and residue index m ∈ [1,N], p(Rm | øm,ψm,Am) is the probability of a rotamer Rm whose main-chain dihedral angles are øm and ψm and whose residue type is Am, p(Rm = 1 | øm,ψm,Am) is the probability of the most likely rotamer (Rm = 1) with the same main-chain configuration, and γ is the scaling factor set to three for big aromatic residues, zero for Gly and Ala, and unity otherwise. The choice of γ allows aromatic side chains to contribute more to the total energy. The rotamer frequencies are derived from Dunbrack's rotamer library (Dunbrack Jr. and Karplus 1993).
Van der Waals (vdW) potential
Similar to what was previously used in the literature (Kuhlman et al. 2003; Lu et al. 2008), the vdW potential function for two atoms i and j takes the form:
 |
where d
*
ij = dij / aij, dij is the distance between atoms i and  are atomic radii and ei, ej are well depths, and λ is a scaling factor for the repulsive term, which is set to unity if both atoms i and j are aromatic carbons and 1.6 otherwise. To avoid deterring hydrogen and disulfide bonding, aij is chosen as the equilibrium position for atoms with hydrogen or disulfide bonds. The details of the LJ parameters and summation rules are described in our OPUS-PSP paper (Lu et al. 2008). To speed up calculation, the LJ cutoff distance is d*ij = 2.5, and the LJ potential is calculated and tabulated as a function of d*2
ij.
are atomic radii and ei, ej are well depths, and λ is a scaling factor for the repulsive term, which is set to unity if both atoms i and j are aromatic carbons and 1.6 otherwise. To avoid deterring hydrogen and disulfide bonding, aij is chosen as the equilibrium position for atoms with hydrogen or disulfide bonds. The details of the LJ parameters and summation rules are described in our OPUS-PSP paper (Lu et al. 2008). To speed up calculation, the LJ cutoff distance is d*ij = 2.5, and the LJ potential is calculated and tabulated as a function of d*2
ij.
Orientation-dependent side-chain packing potential
The term E orient is our recently developed orientation-dependent statistical potential derived from side-chain packing, called OPUS-PSP (Lu et al. 2008). OPUS-PSP represents each amino acid as a connected subset of 19 rigid blocks, which are used to characterize the orientation preference of protein side-chain packing. For a pair of block types a and b in contact with a packing orientation Ωab, the orientation potential takes the form:
Here, n(a,b) is a weighting term for block size, defined as the average number of pairs of heavy atoms in contact, and
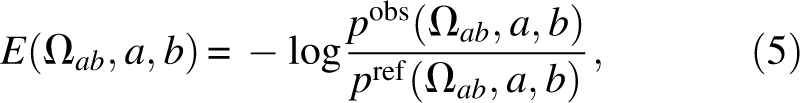 |
where p obs is the probability with respect to all observed contact states for any block pair extracted from the nonredundant structure database, and p ref is the probability for the reference state. The summation includes all block pairs in nonconsecutive residues and in contact without severe steric clash, which occurs when an atom pair has an interatomic distance <0.7 aij. Details of E orient can be found in the OPUS-PSP paper (Lu et al. 2008).
Solvation energy
Following the method of Eisenberg and McLachlan (1986), the solvation energy Esolvation takes the form:
 |
where Si is the solvent-accessible surface area (SASA) of atom i, and Δσi is the atomic solvent parameter from Sharp et al. (1991). To rapidly calculate SASA, OPUS-Rota adopts the pairwise approximation method of Zhang et al. (2004), for which we use d = 1.2 Å and r = 2.6 Å. The vdW radii of the atoms are specifically chosen to be 1.55 Å for nitrogen, 1.7 Å for carbon, 1.52 Å for oxygen, and 1.8 Å for sulfur. For the whole residue, the pairwise approximation method for calculating SASA is accurate with only ∼2% deviation from the conventional solvent-accessible surface calculated by the method of Legrand and Merz (1993). The pairwise method was also found to be comparably accurate when calculating the solvation energy from the SASA of each atom.
When calculating the full solvent-accessible surface ab initio, the pairwise approximation method is actually more computationally expensive than that of Legrand and Merz (1993). The short-range and pairwise nature of the approximation, however, permits very efficient residue-by-residue updates, since only the surface area associated with the altered side chain and its neighbor atoms must be recomputed. Some additional cost-saving features include the pre-calculation of fixed contributions such as those from the main chain. In addition, inverse cosine and inverse tangent functions are all pre-tabulated.
Neighbor lists
Because all the energy terms in OPUS-Rota are short-range and pairwise, the energy calculation may be accelerated by implementing neighbor lists, which catalog all pairs of atoms or blocks whose pairwise distance is within the range of the interaction. Since the main-chain is fixed, we may pre-compute the neighbor lists for each energy term by estimating a lower bound for the distance between two atoms (or blocks) using the inverse triangle inequality: ‖x − y − z‖ ≥ ‖x‖ − ‖y‖ − ‖z‖. Let d(i, j) be the distance between atoms i and j, and Cβ(i) be the Cβ atom corresponding to the residue of atom i. Then,
 |
where max(d(·)) is calculated using all possible rotamer conformations. Given that the distance between any two Cβ atoms (Cα atoms for Gly) is constant for a fixed main chain, then the minimum distance between any two atoms can be estimated before the model building begins. By recording all atom pairs whose minimum distance is within the interaction cutoff, the neighbor lists can be efficiently established without updates during sampling.
Conformational sampling
The sampling method in OPUS-Rota is simulated annealing by heat bath Monte Carlo (Newman and Barkema 1999). Despite its simplicity, it is able to rapidly identify near-native conformations when combined with neighbor list techniques and efficient energy updates.
Simulated annealing by heat bath Monte Carlo
Heat bath Monte Carlo is more efficient than conventional Monte Carlo when the states are discrete and limited, e.g., the rotamer conformations for one side chain. In OPUS-Rota, the move set for a given main-chain conformation is the collection of rotamer states from Dunbrack's rotamer library (Dunbrack Jr. and Karplus 1993), selected in order of highest to lowest probability until the cumulative probability reaches at least 99.5%. In this way, almost all possible rotamers can be presented for sampling.
The acceptance probability of a move from the prior rotamer state o to a new state n is
where 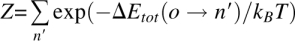 for all possible states {n′}, ΔEtot (o → n) is the total energy change from o to n, kB is the Boltzmann constant (set to unity), and T is temperature. In the case of ΔEtot (o → n) / kBT > 7, the probability of change is <0.001, and thus rotamer n is excluded from the current step without evaluating the Boltzmann factor.
Sampling is initiated by positioning all side chains at the rotamers with minimum main chain side-chain energy. At this first step, side-chain–side-chain interactions are not considered because neighboring side chains are not yet populated, and the solvation energy is also excluded from the calculation. A rotamer state is excluded from sampling if its main chain side-chain energy is 7.5 units higher than that of the lowest energy state for the residue.
For each cycle of simulation, all residues except for Gly and Ala are optimized once by heat bath Monte Carlo at a constant temperature in a random order. The temperature is gradually decreased from 2.5 to 0.05 over a total of 97 cycles, followed by three cycles of zero temperature energy minimization. Cys disulfide bonds are not specifically modeled during sampling, as our approach is already as accurate as the methods in the literature (see Table 2). Since the solvation energy calculation is slower than that of any other energy term, and since SASA is less meaningful when the structure suffers from severe steric clash, the solvation energy term is turned off for the first 60 cycles and enabled afterward.
Energy updates
Because all energy terms are short-range and pairwise and each move set involves only one side chain, the change in total energy is equal to the change in energy contribution of the single side chain. In addition, certain repetitively used energy terms, such as the side-chain–main-chain energies for all rotamer candidates, are pre-calculated and stored in memory.
Moreover, in calculating the SASA for each atom, the contributions from main-chain atoms and generic side chains (represented as a sphere for each side chain; see Zhang et al. [2004] for more details) are also pre-calculated for all rotamer states. Hence, each Monte Carlo move only requires evaluating the side-chain–side-chain SASA contributions, enabling OPUS-Rota to efficiently recalculate the solvation energy using the pairwise approximation method.
Test set and accuracy analysis
Two test sets were used in this study, a native set and a predicted set. The native test set consists of 65 proteins used by Peterson et al. (2004) and Jain et al. (2006). In order to optimize the flip states of Asn, Gln, and His, all native structures (but none of the predicted structures) were pre-processed by REDUCE (Word et al. 1999). This 65-protein set was the primary basis for comparing OPUS-Rota with the side-chain modeling algorithms SCWRL (Canutescu et al. 2003), NCN (Peterson et al. 2004), LGA (Liang and Grishin 2002), SPRUCE (Jain et al. 2006), Rosetta (Wang et al. 2005), and SCAP (Xiang and Honig 2001).
The second test set is the Wallner and Elofsson benchmark for homology modeling (Wallner and Elofsson 2005), which was used to test side-chain modeling on predicted main-chain structures. The benchmark set consists of 1058 pairs of aligned template structures and target native structures. The structures have resolutions better than 3 Å and R-factors <0.25, and the native structures are provided for comparison only. In addition, out of the original 1060 structure pairs in the benchmark set, one pair was eliminated because the native structure consisted entirely of Cα atoms, and another pair was discarded due to a large percentage of unresolved Asn/Asp (Asx) and Gln/Glu (Glx) residues. Modeller (Sali and Blundell 1993; Fiser et al. 2000) was first applied to generate complete structures by homology modeling. The main chains were extracted from these predicted structures for subsequent side-chain modeling. In this study, only SCWRL and OPUS-Rota were tested.
To check the accuracy of the algorithms, we consider χ 1 and χ 1+2 accuracies, where χ 1 accuracy is defined as the percentage of residues whose predicted χ 1 dihedral is no more than 40° from their native values, and where χ 1+2 accuracy is restricted to cases in which both χ 1 and χ 2 are within 40° of the native value. Furthermore, the overall average χ 1+2 accuracy calculation excludes Val, Ser, Thr, and Cys (Peterson et al. 2004; Jain et al. 2006), since these residues have no χ 2 angle. If the native residues have alternative positions, the predicted rotamer is considered to be correct if it satisfies any of the alternative positions using the χ 1 and χ 1+2 criteria above.
For our analysis of residues in the protein core, the core residues are defined as the residues whose solvent-accessible ratio, the percentage of exposed surface area of the residue in the whole protein with respect to that of the residue alone (Jain et al. 2006), is below a specified cutoff. For a cutoff of 17%, 53.5% of residues are regarded as core residues, which nearly matches the core residue percentages in studies of SPRUCE (Jain et al. 2006) (53.8%) and NCN (Peterson et al. 2004) (54.3%). In order to compare our method with the state of the art (Peterson et al. 2004; Jain et al. 2006), our core region definition includes 10%–15% more core residues than many conventional studies (Holm and Sander 1992; Xiang and Honig 2001; Liang and Grishin 2002). Note that when the conventional definition of core residues is used, the core residue accuracy for OPUS-Rota increases by ∼0.7 percentage points for both χ 1 and χ 1+2.
Acknowledgments
This work was supported by a grant from the National Institutes of Health and a grant from the National Science Foundation. A.D.D. was supported by a pre-doctoral fellowship from the Keck Center through the National Library of Medicine Computational Biology and Medicine Training Program (NLM Grant No. 5T15LM07093).
Footnotes
Reprint requests to: Jianpeng Ma, Baylor College of Medicine, One Baylor Plaza, BCM-125, Houston, TX 77030, USA; e-mail: jpma@bcm.tmc.edu; fax: (713) 796-9438.
Article and publication are at http://www.proteinscience.org/cgi/doi/10.1110/ps.035022.108.
References
- Canutescu, A.A., Shelenkov, A.A., Dunbrack R.L., Jr A graph-theory algorithm for rapid protein side-chain prediction. Protein Sci. 2003;12:2001–2014. doi: 10.1110/ps.03154503. [DOI] [PMC free article] [PubMed] [Google Scholar]
- Chazelle, B., Kingsford, C., Singh, M. A semidefinite programming approach to side chain positioning with new rounding strategies. INFORMS Journal on Computing. 2004;16:380–392. [Google Scholar]
- Chong, K.F., Leong, H.W. A merge-decoupling dead end elimination algorithm for protein side-chain conformation. Int. J. Data Min. Bioinformatics. 2007;1:372–388. doi: 10.1504/ijdmb.2007.012966. [DOI] [PubMed] [Google Scholar]
- DeMaeyer, M., Desmet, J., Lasters, I. All in one: A highly detailed rotamer library improves both accuracy and speed in the modelling of side chains by dead-end elimination. Fold. Des. 1997;2:53–66. doi: 10.1016/s1359-0278(97)00006-0. [DOI] [PubMed] [Google Scholar]
- Desmet, J., Spriet, J., Lasters, I. Fast and accurate side-chain topology and energy refinement (FASTER) as a new method for protein structure optimization. Proteins. 2002;48:31–43. doi: 10.1002/prot.10131. [DOI] [PubMed] [Google Scholar]
- Dunbrack R.L., Jr, Cohen, F.E. Bayesian statistical analysis of protein side-chain rotamer preferences. Protein Sci. 1997;6:1661–1681. doi: 10.1002/pro.5560060807. [DOI] [PMC free article] [PubMed] [Google Scholar]
- Dunbrack R.L., Jr, Karplus, M. Backbone-dependent rotamer library for proteins. Application to side-chain prediction. J. Mol. Biol. 1993;230:543–574. doi: 10.1006/jmbi.1993.1170. [DOI] [PubMed] [Google Scholar]
- Eisenberg, D., McLachlan, A.D. Solvation energy in protein folding and binding. Nature. 1986;319:199–203. doi: 10.1038/319199a0. [DOI] [PubMed] [Google Scholar]
- Eyal, E., Najmanovich, R., McConkey, B.J., Edelman, M., Sobolev, V. Importance of solvent accessibility and contact surfaces in modeling side-chain conformations in proteins. J. Comput. Chem. 2004;25:712–724. doi: 10.1002/jcc.10420. [DOI] [PubMed] [Google Scholar]
- Fiser, A., Do, R.K., Sali, A. Modeling of loops in protein structures. Protein Sci. 2000;9:1753–1773. doi: 10.1110/ps.9.9.1753. [DOI] [PMC free article] [PubMed] [Google Scholar]
- Georgiev, I., Donald, B.R. Dead-end elimination with backbone flexibility. Bioinformatics. 2007;23:I185–I194. doi: 10.1093/bioinformatics/btm197. [DOI] [PubMed] [Google Scholar]
- Goldstein, R.F. Efficient rotamer elimination applied to protein side-chains and related spin glasses. Biophys. J. 1994;66:1335–1340. doi: 10.1016/S0006-3495(94)80923-3. [DOI] [PMC free article] [PubMed] [Google Scholar]
- Gordon, D.B., Mayo, S.L. Branch-and-terminate: A combinatorial optimization algorithm for protein design. Structure. 1999;7:1089–1098. doi: 10.1016/s0969-2126(99)80176-2. [DOI] [PubMed] [Google Scholar]
- Gray, J.J., Moughon, S., Wang, C., Schueler-Furman, O., Kuhlman, B., Rohl, C.A., Baker, D. Protein–protein docking with simultaneous optimization of rigid-body displacement and side-chain conformations. J. Mol. Biol. 2003;331:281–299. doi: 10.1016/s0022-2836(03)00670-3. [DOI] [PubMed] [Google Scholar]
- Hartmann, C., Antes, I., Lengauer, T. IRECS: A new algorithm for the selection of most probable ensembles of side-chain conformations in protein models. Protein Sci. 2007;16:1294–1307. doi: 10.1110/ps.062658307. [DOI] [PMC free article] [PubMed] [Google Scholar]
- Holm, L., Sander, C. Fast and simple Monte Carlo algorithm for side chain optimization in proteins: Application to model building by homology. Proteins. 1992;14:213–223. doi: 10.1002/prot.340140208. [DOI] [PubMed] [Google Scholar]
- Jacobson, M.P., Friesner, R.A., Xiang, Z., Honig, B. On the role of the crystal environment in determining protein side-chain conformations. J. Mol. Biol. 2002;320:597–608. doi: 10.1016/s0022-2836(02)00470-9. [DOI] [PubMed] [Google Scholar]
- Jain, T., Cerutti, D.S., McCammon, J.A. Configurational-bias sampling technique for predicting side-chain conformations in proteins. Protein Sci. 2006;15:2029–2039. doi: 10.1110/ps.062165906. [DOI] [PMC free article] [PubMed] [Google Scholar]
- Kingsford, C.L., Chazelle, B., Singh, M. Solving and analyzing side-chain positioning problems using linear and integer programming. Bioinformatics. 2005;21:1028–1036. doi: 10.1093/bioinformatics/bti144. [DOI] [PubMed] [Google Scholar]
- Kuhlman, B., Dantas, G., Ireton, G.C., Varani, G., Stoddard, B.L., Baker, D. Design of a novel globular protein fold with atomic-level accuracy. Science. 2003;302:1364–1368. doi: 10.1126/science.1089427. [DOI] [PubMed] [Google Scholar]
- Leaver-Fay, A., Butterfoss, G.L., Snoeyink, J., Kuhlman, B. Maintaining solvent accessible surface area under rotamer substitution for protein design. J. Comput. Chem. 2007;28:1336–1341. doi: 10.1002/jcc.20626. [DOI] [PubMed] [Google Scholar]
- Lee, B., Richards, F.M. The interpretation of protein structures: Estimation of static accessibility. J. Mol. Biol. 1971;55:379–400. doi: 10.1016/0022-2836(71)90324-x. [DOI] [PubMed] [Google Scholar]
- Legrand, S.M., Merz, K.M. Rapid approximation to molecular-surface area via the use of boolean logic and look-up tables. J. Comput. Chem. 1993;14:349–352. [Google Scholar]
- Liang, S., Grishin, N.V. Side-chain modeling with an optimized scoring function. Protein Sci. 2002;11:322–331. doi: 10.1110/ps.24902. [DOI] [PMC free article] [PubMed] [Google Scholar]
- Looger, L.L., Hellinga, H.W. Generalized dead-end elimination algorithms make large-scale protein side-chain structure prediction tractable: Implications for protein design and structural genomics. J. Mol. Biol. 2001;307:429–445. doi: 10.1006/jmbi.2000.4424. [DOI] [PubMed] [Google Scholar]
- Lopes, A., Alexandrov, A., Bathelt, C., Archontis, G., Simonson, T. Computational sidechain placement and protein mutagenesis with implicit solvent models. Proteins. 2007;67:853–867. doi: 10.1002/prot.21379. [DOI] [PubMed] [Google Scholar]
- Lovell, S.C., Word, J.M., Richardson, J.S., Richardson, D.C. The penultimate rotamer library. Proteins. 2000;40:389–408. [PubMed] [Google Scholar]
- Lu, M., Dousis, A., Ma, J. OPUS-PSP: An orientation-dependent statistical all-atom potential derived from side-chain packing. J. Mol. Biol. 2008;376:288–301. doi: 10.1016/j.jmb.2007.11.033. [DOI] [PMC free article] [PubMed] [Google Scholar]
- Mendes, J., Baptista, A.M., Carrondo, M.A., Soares, C.M. Improved modeling of side-chains in proteins with rotamer-based methods: A flexible rotamer model. Proteins. 1999;37:530–543. doi: 10.1002/(sici)1097-0134(19991201)37:4<530::aid-prot4>3.0.co;2-h. [DOI] [PubMed] [Google Scholar]
- Newman, M.E.J., Barkema, G.T. Monte Carlo methods in statistical physics. Oxford University Press; Oxford, UK: 1999. [Google Scholar]
- Peterson, R.W., Dutton, P.L., Wand, A.J. Improved side-chain prediction accuracy using an ab initio potential energy function and a very large rotamer library. Protein Sci. 2004;13:735–751. doi: 10.1110/ps.03250104. [DOI] [PMC free article] [PubMed] [Google Scholar]
- Pierce, N.A., Spriet, J.A., Desmet, J., Mayo, S.L. Conformational splitting: A more powerful criterion for dead-end elimination. J. Comput. Chem. 2000;21:999–1009. [Google Scholar]
- Ponder, J.W., Richards, F.M. Tertiary templates for proteins. Use of packing criteria in the enumeration of allowed sequences for different structural classes. J. Mol. Biol. 1987;193:775–791. doi: 10.1016/0022-2836(87)90358-5. [DOI] [PubMed] [Google Scholar]
- Sali, A., Blundell, T.L. Comparative protein modelling by satisfaction of spatial restraints. J. Mol. Biol. 1993;234:779–815. doi: 10.1006/jmbi.1993.1626. [DOI] [PubMed] [Google Scholar]
- Santana, R., Larranaga, P., Lozano, J.A. Side chain placement using estimation of distribution algorithms. Artif. Intell. Med. 2007;39:49–63. doi: 10.1016/j.artmed.2006.04.004. [DOI] [PubMed] [Google Scholar]
- Sharp, K.A., Nicholls, A., Friedman, R., Honig, B. Extracting hydrophobic free energies from experimental data: Relationship to protein folding and theoretical models. Biochemistry. 1991;30:9686–9697. doi: 10.1021/bi00104a017. [DOI] [PubMed] [Google Scholar]
- Smith, R.E., Lovell, S.C., Burke, D.F., Montalvao, R.W., Blundell, T.L. Andante: Reducing side-chain rotamer search space during comparative modeling using environment-specific substitution probabilities. Bioinformatics. 2007;23:1099–1105. doi: 10.1093/bioinformatics/btm073. [DOI] [PubMed] [Google Scholar]
- Spassov, V.Z., Yan, L., Flook, P.K. The dominant role of side-chain backbone interactions in structural realization of amino acid code. ChiRotor: A side-chain prediction algorithm based on side-chain backbone interactions. Protein Sci. 2007;16:494–506. doi: 10.1110/ps.062447107. [DOI] [PMC free article] [PubMed] [Google Scholar]
- Wallner, B., Elofsson, A. All are not equal: A benchmark of different homology modeling programs. Protein Sci. 2005;14:1315–1327. doi: 10.1110/ps.041253405. [DOI] [PMC free article] [PubMed] [Google Scholar]
- Wang, C., Schueler-Furman, O., Baker, D. Improved side-chain modeling for protein–protein docking. Protein Sci. 2005;14:1328–1339. doi: 10.1110/ps.041222905. [DOI] [PMC free article] [PubMed] [Google Scholar]
- Word, J.M., Lovell, S.C., Richardson, J.S., Richardson, D.C. Asparagine and glutamine: Using hydrogen atom contacts in the choice of side-chain amide orientation. J. Mol. Biol. 1999;285:1735–1747. doi: 10.1006/jmbi.1998.2401. [DOI] [PubMed] [Google Scholar]
- Xiang, Z., Honig, B. Extending the accuracy limits of prediction for side-chain conformations. J. Mol. Biol. 2001;311:421–430. doi: 10.1006/jmbi.2001.4865. [DOI] [PubMed] [Google Scholar]
- Xiang, Z.X., Steinbach, P.J., Jacobson, M.P., Friesner, R.A., Honig, B. Prediction of side-chain conformations on protein surfaces. Proteins. 2007;66:814–823. doi: 10.1002/prot.21099. [DOI] [PMC free article] [PubMed] [Google Scholar]
- Xie, W., Sahinidis, N.V. Residue-rotamer-reduction algorithm for the protein side-chain conformation problem. Bioinformatics. 2006;22:188–194. doi: 10.1093/bioinformatics/bti763. [DOI] [PubMed] [Google Scholar]
- Xu, J.B. Proceedings of the 9th Annual International Conference on Research in Computational Molecular Biology. RECOMB 2005; Cambridge, MA: 2005. Rapid protein side-chain packing via tree decomposition; pp. 423–439. [Google Scholar]
- Zhang, W., Duan, Y. Grow to fit molecular dynamics (G2FMD): An ab initio method for protein side-chain assignment and refinement. Protein Eng. Des. Sel. 2006;19:55–65. doi: 10.1093/protein/gzj001. [DOI] [PubMed] [Google Scholar]
- Zhang, N., Zeng, C., Wingreen, N.S. Fast accurate evaluation of protein solvent exposure. Proteins. 2004;57:565–576. doi: 10.1002/prot.20191. [DOI] [PubMed] [Google Scholar]
- Zhu, K., Shirts, M.R., Friesner, R.A. Improved methods for side chain and loop predictions via the protein local optimization program: Variable dielectric model for implicitly improving the treatment of polarization effects. J. Chem. Theory Comput. 2007;3:2108–2119. doi: 10.1021/ct700166f. [DOI] [PubMed] [Google Scholar]