Abstract
Glutathione-S-transferase (GST)-fusion proteins are used extensively for structural, biochemical, and functional analyses. Although the conformation of the target protein is of critical importance, confirmation of the folded state of the target is often not undertaken or is cumbersome because of the requirement to first remove the GST tag. Here, we demonstrate that it is possible to record conventional 15N-HSQC NMR spectra of small GST-fusion proteins and that the observed signals arise almost exclusively from the target protein. This approach constitutes a rapid and straightforward means of assessing the conformation of a GST-fusion protein without having to cleave the GST and should prove valuable, both to biochemists seeking to check the conformation of their proteins prior to functional studies and to structural biologists screening protein constructs for suitability as targets for structural studies.
Keywords: NMR spectroscopy, GST fusion, protein conformation, GST pulldown
The structural, biochemical, and functional analysis of a protein requires that the protein be expressed and purified in a folded, functional form. A common means of achieving this is by expressing the target protein fused to a protein affinity tag, such as glutathione-S-transferase (GST) (Smith 2000), maltose-binding protein (MBP) (Sachdev and Chirgwin 2000), thioredoxin (Trx) (LaVallie et al. 2000), or ubiquitin (Catanzariti et al. 2004). These affinity tags allow for rapid purification of the fusion protein and can also result in high levels of expression, as well as enhanced solubility and stability of the target protein. For these reasons, fusion protein systems have been used extensively to generate proteins in sufficient quantity and purity for structural studies using either NMR spectroscopy or X-ray crystallography (Jeon et al. 2005; Tyler et al. 2005). GST-tagged proteins in particular have also proven useful for characterizing protein–protein and protein–DNA interactions, either by confirming existing interactions through directed GST-pulldown experiments (Fox et al. 1998) or by serving as “bait” to capture previously unknown protein or nucleic acid binding partners (Sakashita and Sakamoto 1994; Brymora et al. 2004). Prior to employing GST-fusion proteins in these various applications, it would be useful to have a straightforward means to assess the folded state of the target proteins. Indeed, in at least one case, a GST-fusion protein containing an unintentionally misfolded/aggregated target protein was shown to produce erroneous results in a SELEX experiment (Lee et al. 2007).
In many ways, NMR spectroscopy is well suited to assessing in a detailed manner the folding and aggregation state of a protein. However, although GST-fusion proteins are relatively easy to purify by glutathione affinity chromatography, detailed NMR studies generally require that the GST tag be cleaved off. This cleavage step can be laborious, requiring optimization of the cleavage conditions (and sometimes further subcloning to remove internal cleavage sites in the target protein), as well as expensive, depending on the enzyme used. Structure determination by NMR spectroscopy often requires multiple constructs of a single protein or protein domain to be produced in order to determine the optimal construct length and domain composition required to generate high quality NMR spectra. In this case, the cleavage step can add considerably to the time and expense required to screen different constructs for their suitability for structural analysis. These considerations are multiplied significantly in the case of structural genomics efforts, where many different proteins are investigated in parallel.
To circumvent the difficulties associated with cleaving a fusion protein for NMR studies, Huth and co-workers proposed the use of the 56-residue immunoglobulin-binding domain of streptococcal protein G (GB1 domain) as a fusion partner in place of GST, MBP, and Trx (Huth et al. 1997). Owing to the small size of GB1, the entire GB1-fusion protein can be analyzed by NMR spectroscopy, removing the need to cleave off the GB1 tag while still reaping the benefits of the tag's presence. However, unlike GST, GB1 is neither a good affinity tag (owing to its acidic elution conditions) nor is it used as extensively as GST, which is currently one of the most widely utilized fusion protein tags and has well-documented behavior as a fusion partner (Braun et al. 2002; Hammarstrom et al. 2002). For these reasons, it would be useful to be able to assess the conformation of target proteins as GST fusions.
Here we show that it is possible to obtain 15N-HSQC spectra of 15N-labeled GST-fusion proteins in which the peaks originate almost entirely from the target protein portion of the fusion. This selectivity arises because the GST portion of the fusion protein forms a 52-kDa dimer in solution, resulting in significant broadening of the NMR signals from the GST component. The flexibility afforded by the linker between the GST and the target protein results in sharp NMR signals for small target proteins that can be observed in a conventional 15N-HSQC spectrum. Given the ease of purification afforded by the GST tag and the removal of the need for laborious and time-consuming enzymatic cleavage, this approach allows NMR spectra of constructs to be acquired in as little as half a day following cell lysis, providing a straightforward way of assessing the structure of target proteins in the context of a GST-fusion construct.
Results and Discussion
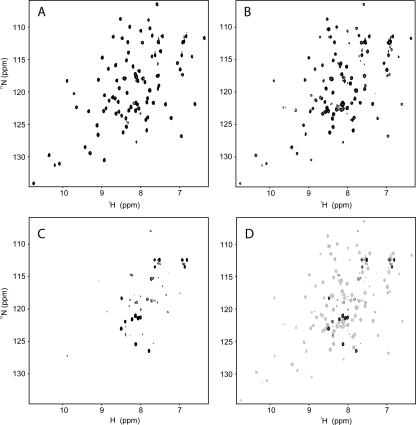
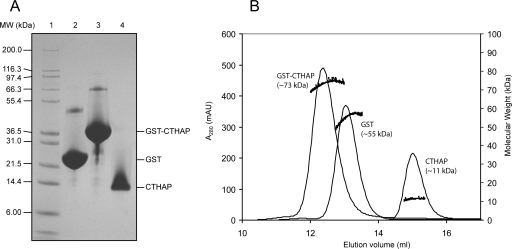
Figure 1 shows 15N-HSQC spectra of the 10.6-kDa Thanatos-associated protein (THAP) domain of the C-terminal binding protein from Caenorhabditis elegans (CTHAP) (Liew et al. 2007), CTHAP fused to GST by an eight-residue linker (GST-CTHAP), and GST alone. Each sample had the same concentration of protein (∼125 μM) in the same buffer, and each 15N-HSQC spectrum was acquired under identical conditions. Remarkably, the 15N-HSQC spectrum of CTHAP fused to GST (Fig. 1B) closely resembles the spectrum of free CTHAP (Fig. 1A). While there are some minor differences between the two spectra, almost all of the peaks that are present in the spectrum of CTHAP (Fig. 1A) are also observed in the spectrum of GST-CTHAP (Fig. 1B). Further, the positions of the signals from the CTHAP domain are identical or extremely similar in both spectra, demonstrating that CTHAP adopts the same conformation when fused to GST as it does when free in solution. To confirm that the CTHAP domain was still fused to GST, we analyzed the NMR samples by SDS-PAGE. Figure 2A shows that GST (∼26 kDa), GST-CTHAP (∼36 kDa), and CTHAP (∼11 kDa) migrate according to their expected molecular weights. The lack of any significant bands below GST-CTHAP in lane 3 confirms that no free CTHAP was present in the solution used to record the 15N-HSQC in Figure 1B. Thus, acquiring a 15N-HSQC spectrum of CTHAP fused to GST is a fast and effective way of assessing the conformational and spectral qualities of the CTHAP domain, without requiring the GST tag to be cleaved off.
Figure 1.
15N-HSQC spectra of CTHAP (A), GST-CTHAP (B), and GST alone (C). (D) Overlay of the spectra of GST-CTHAP (gray) and GST (black). All spectra were acquired at 298 K and pH 6.5 on samples in 20 mM NaH2PO4, 100 mM NaCl, 1 mM DTT. Spectra were recorded on a Bruker AMX 600 spectrometer equipped with a cryogenically cooled probe and with a relaxation delay of 1 s, an acquisition time of 100 ms, and 4 scans per t 1 increment. The signal-to-noise ratio of the spectrum of GST-CTHAP (B) is approximately fourfold lower than that of the spectrum of CTHAP alone (A).
Figure 2.
Molecular weight estimates of CTHAP, GST-CTHAP, and GST. (A) SDS-PAGE analysis showing Mark12 protein standards (lane 1), GST (lane 2), GST-CTHAP (lane 3), and CTHAP alone (lane 4). (B) Size-exclusion chromatography of CTHAP, GST-CTHAP, and GST alone (chromatograms overlaid). Molecular weight of each protein was estimated using an in-line MALLS detector. MALLS data are shown as black dots.
A 15N-HSQC spectrum of GST alone (Fig. 1C) contains only a handful of peaks, and approximately the same number of GST signals are observed in the spectrum of GST-CTHAP (Fig. 1B). These signals most likely arise from residues in the linker region of the fusion protein, which connect the C terminus of GST to CtBP-THAP. This linker originates from the multiple cloning site and the protease (thrombin) recognition sequence present in the pGEX-2T vector, and, as a consequence, it is still present in GST following thrombin cleavage to release CtBP-THAP. An overlay of the spectrum of GST alone with the spectrum of GST-CTBP (Fig. 1D) shows that many of the GST signals occupy different positions in the two spectra. This probably results from the fact that the linker region experiences different chemical environments depending on whether CtBP-THAP is present (Fig. 1B) or whether it has been cleaved off (Fig. 1C). Despite the difference in chemical shifts, the GST portion of GST-CTHAP contributes only a few signals to the spectrum of the fusion protein.
The poor overall signal-to-noise observed for the GST portion of the fusion protein is likely to be due to its oligomerization state. It has previously been shown that GST forms a homodimer in solution (Riley et al. 1996), and we used size-exclusion chromatography linked to a multi-angle laser light scattering (MALLS) detector to assess the molecular weights of GST and GST-CTHAP in solution (Fig. 2B). MALLS analysis confirms that both GST and GST-CTHAP form dimers in solution, while CTHAP alone was previously shown to be strictly monomeric (Liew et al. 2007). Thus, unusually for NMR spectroscopy, the large size of the dimeric GST-fusion protein is actually beneficial in this case, in that the signals from the GST component of the fusion protein are significantly broadened by its large size and the resulting reduction in its tumbling rate. The fact that the CTHAP domain within GST-CTHAP gives rise to observable signals suggests that it is still able to reorient rapidly, presumably as a consequence of the fact that it is attached to GST by an eight-residue linker.
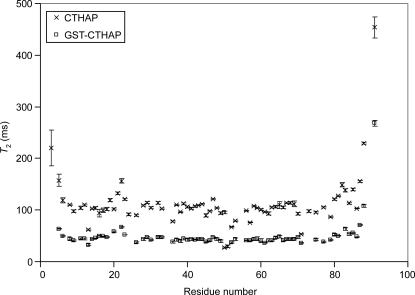
In order to compare the motional properties of CTHAP in the free and GST-bound forms, 15N transverse relaxation times (T 2) for the backbone amide nitrogens were measured (Fig. 3). The majority of amide protons in free CTHAP exhibit T 2 values within the range of 90–120 ms, consistent with a monomeric protein of this size (∼11 kDa) (Stone et al. 1993; Rischel et al. 1994). The T 2 values for GST-CTHAP are significantly lower, with the majority of values falling within the 30- to 60-ms range. This reduction in T 2 values is most likely due to a partial restriction in the tumbling of CTHAP: GST-CTHAP is 72 kDa in size. However, the reduction in T 2 values is significantly less than one might expect for a globular protein of this size. For comparison, the average 15N T 2 values for malate synthase G, an 81-kDa protein, are ∼19 ms (Tugarinov et al. 2002). The T 2 values of 30–60 ms observed for CTHAP fused to GST are more consistent with a protein of ∼25 kDa in size (Zheng et al. 1995; Tang et al. 2002; Masters et al. 2006), indicating that the CTHAP domain still has a significant degree of motional freedom within the fusion protein, allowing for high-quality 15N-HSQC spectra to be obtained using non-TROSY methods.
Figure 3.
T 2 values plotted against residue number for CTHAP (×) and GST-CTHAP (□). Error bars are from the fit of the data to a single three-parameter exponential and represent one standard deviation.
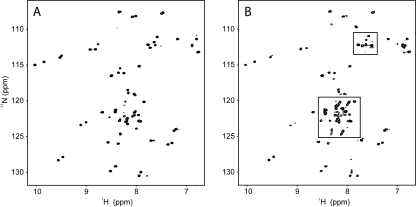
As a step toward assessing the general applicability of these findings, we recorded a 15N-HSQC spectrum of another GST-fusion protein from our laboratory. Figure 4 shows 15N-HSQC spectra of a two zinc finger (fourth and fifth fingers) construct (9.1 kDa) of the transcription factor MyT1 in the free form (Fig. 4A) and fused to GST (Fig. 4B). Although some noticeable differences between the two spectra are observed, the majority of the peaks are located in the same position and most of the signals present in the spectrum of GST-MyT1 originate from MyT1. The similarity of the MyT1 and GST-MyT1 spectra suggests that MyT1 also adopts the same conformation in both the free and GST-fused forms.
Figure 4.
15N-HSQC spectra of MyT1 (A) and GST-MyT1 (B). Spectra were acquired at 298 K and pH 7.4 on samples in 10 mM NaH2PO4, 50 mM NaCl, and 1 mM DTT. Boxed regions in B contain peaks that are not found in the spectrum of free MyT1.
It is anticipated that the 15N-HSQC NMR spectra of other proteins fused to GST will be very similar to the spectra of their respective free forms, as has been demonstrated for MyT1 and CTHAP (at this stage we have tested only these two proteins). However, there are likely to be exceptions. For instance, it is known that GST can help prevent the aggregation of some proteins so cleaving off the GST portion may result in aggregation and even precipitation of the target proteins, giving rise to poor quality spectra of the free protein. Conversely, a protein that gives rise to a high quality 15N-HSQC spectrum in its free form may produce poor quality spectra as a GST fusion if the target protein interacts with either the GST itself or the linker region, and consequently is unable to tumble independently of the GST dimer. Despite these potential limitations, assessing the conformation of GST-fusion proteins using NMR spectroscopy should still prove to be a rapid and widely applicable screening procedure.
NMR spectroscopy has previously been used to selectively study the more mobile components of large proteins and complexes, ranging in size from GST fusions of polyglutamine tracts (Masino et al. 2002) to intact ribosomes (Christodoulou et al. 2004; Mulder et al. 2004), taking advantage of the slower tumbling rate of the rest of the protein/complex and the resulting broadened signals. We suggest that this phenomenon can be harnessed as a means to rapidly assess the solution conformation of target proteins fused to GST. Given that this method relies on the target protein being significantly more mobile that the 52-kDa GST dimer, there is an inherent limit in the size of proteins that will benefit from this approach. However, based on the results for CTHAP, it is likely to be useful for proteins up to 20–25 kDa in size, which encompass the majority of proteins targeted for structural analysis using NMR spectroscopy. A clear area of applicability lies in the optimization of constructs for structural studies, but the approach should also prove very useful for a wide range of biophysical, biochemical, and functional projects in which the conformational integrity of a target protein in the context of a GST-fusion construct is relied upon.
Materials and Methods
Protein expression and purification
DNA encoding CTHAP was amplified using PCR and subcloned into a pGEX-2T vector between the BamHI and EcoRI sites. The resulting fusion protein contains an eight-residue linker (SDLVPRGS) separating the C terminus of GST and the N terminus of CTHAP. Protein samples of CTHAP and MyT1 were prepared as described previously (Gamsjaeger et al. 2007; Liew et al. 2007). The GST remaining on the GSH column following thrombin cleavage was eluted in 20 mM glutathione, pH 8, for use in this study. GST-CTHAP and GST-MyT1 were prepared according to the protocols described for CTHAP and MyT1, but the thrombin cleavage step was omitted. Instead, both proteins were eluted in 20 mM glutathione, pH 8. GST-CTHAP was subjected to size-exclusion chromatography in buffer containing 20 mM NaH2PO4 (pH 6.5), 100 mM NaCl, 1 mM DTT. Following elution with glutathione, GST-MyT1 was dialyzed into 10 mM NaH2PO4 (pH 7.4), 50 mM NaCl, 1 mM DTT .
NMR spectroscopy
All NMR spectra were acquired at 298 K on a Bruker AMX 600 spectrometer, equipped with a triple-resonance cryogenically cooled probe and z-axis pulsed-field gradients. 15N-HSQC and 15N T 2 experiments were recorded using standard pulse sequences from the Bruker library. T 2 spectra were recorded with τ delays (ms) of 17.6*, 52.8, 70.4*, 88, 105.6*, 123.2, 158.4, 193.6*, 228.8, and 248.4* for CTHAP alone and 17.6*, 35.2, 52.8, 70.4*, 105.6, 123.2, 140.8*, and 158.4 for GST-CTHAP (asterisks indicate duplicated experiments). The recycle delay between scans was set to 2.5 s for the T 2 experiments. All spectra were processed with TopSpin (Bruker) and analyzed using Sparky (T.D. Goddard and D.G. Kneller, SPARKY 3, University of California, San Francisco, CA). T 2 values were obtained by fitting the heights of the peaks from several T 2 spectra (with varying τ delays) to a single three-parameter exponential decay curve using the relaxation fitting extension in SPARKY.
Multi-angle laser light scattering
Size-exclusion chromatography of GST-CTHAP and GST was performed using a Superose 12 column (Amersham) equilibrated in buffer containing 20 mM NaH2PO4, 100 mM NaCl, 1 mM DTT, pH 6.5, at a flow rate of 0.5 mL/min. The column was attached to an ÄKTAbasic liquid chromatography system (Amersham) coupled to a miniDawn MALLS detector and an Optilab refractive index detector (Wyatt Technology). The MALLS technique provides a molecular mass estimate that is independent of shape (Folta-Stogniew and Williams 1999). The molecular masses of GST-CTHAP and GST were calculated using a dn/dc value of 0.185.
Acknowledgments
We thank W.A. Bubb for expert maintenance of the AMX 600 NMR spectrometer at the University of Sydney. C.K.L. is supported by the Sydney University Bridging Support Fellowship Scheme, R.G. is supported by a fellowship from the Austrian Science Fund (J2474), R.E.M. holds an Australian Postgraduate Award, and J.P.M. is a NHMRC Senior Research Fellow.
Footnotes
Reprint requests to: Chu Kong Liew, School of Molecular and Microbial Biosciences, Building G08, Maze Crescent, University of Sydney, Sydney New South Wales 2006, Australia; e-mail: ckliew@mmb.usyd.edu.au; fax: +61-2-9351-4726.
Article and publication are at http://www.proteinscience.org/cgi/doi/10.1110/ps.034983.108.
References
- Braun, P., Hu, Y., Shen, B., Halleck, A., Koundinya, M., Harlow, E., LaBaer, J. Proteome-scale purification of human proteins from bacteria. Proc. Natl. Acad. Sci. 2002;99:2654–2659. doi: 10.1073/pnas.042684199. [DOI] [PMC free article] [PubMed] [Google Scholar]
- Brymora, A., Valova, V.A., Robinson, P.J. Unlimited Learning Resources; Winston-Salem, NC: 2004. Protein–protein interactions identified by pulldown experiments and mass spectrometry. Current protocols in cell biology, Section 17.5. [DOI] [PubMed] [Google Scholar]
- Catanzariti, A.M., Soboleva, T.A., Jans, D.A., Board, P.G., Baker, R.T. An efficient system for high-level expression and easy purification of authentic recombinant proteins. Protein Sci. 2004;13:1331–1339. doi: 10.1110/ps.04618904. [DOI] [PMC free article] [PubMed] [Google Scholar]
- Christodoulou, J., Larsson, G., Fucini, P., Connell, S.R., Pertinhez, T.A., Hanson, C.L., Redfield, C., Nierhaus, K.H., Robinson, C.V., Schleucher, J., et al. Heteronuclear NMR investigations of dynamic regions of intact Escherichia coli ribosomes. Proc. Natl. Acad. Sci. 2004;101:10949–10954. doi: 10.1073/pnas.0400928101. [DOI] [PMC free article] [PubMed] [Google Scholar]
- Folta-Stogniew, E., Williams, K. Determination of molecular masses of proteins in solution: Implementation of an HPLC size exclusion chromatography and laser light scattering service in a core laboratory. J. Biomol. Tech. 1999;10:51–63. [PMC free article] [PubMed] [Google Scholar]
- Fox, A.H., Kowalski, K., King, G.F., Mackay, J.P., Crossley, M. Key residues characteristic of GATA N-fingers are recognized by FOG. J. Biol. Chem. 1998;273:33595–33603. doi: 10.1074/jbc.273.50.33595. [DOI] [PubMed] [Google Scholar]
- Gamsjaeger, R., Swanton, M.K., Kobus, F.J., Lehtomaki, E., Lowry, J.A., Kwan, A.H., Matthews, J.M., Mackay, J.P. Structural and biophysical analysis of the DNA-binding properties of myelin transcription factor 1. J. Biol. Chem. 2007;283:5158–5167. doi: 10.1074/jbc.M703772200. [DOI] [PubMed] [Google Scholar]
- Hammarstrom, M., Hellgren, N., van Den Berg, S., Berglund, H., Hard, T. Rapid screening for improved solubility of small human proteins produced as fusion proteins in Escherichia coli . Protein Sci. 2002;11:313–321. doi: 10.1110/ps.22102. [DOI] [PMC free article] [PubMed] [Google Scholar]
- Huth, J.R., Bewley, C.A., Jackson, B.M., Hinnebusch, A.G., Clore, G.M., Gronenborn, A.M. Design of an expression system for detecting folded protein domains and mapping macromolecular interactions by NMR. Protein Sci. 1997;6:2359–2364. doi: 10.1002/pro.5560061109. [DOI] [PMC free article] [PubMed] [Google Scholar]
- Jeon, W.B., Aceti, D.J., Bingman, C.A., Vojtik, F.C., Olson, A.C., Ellefson, J.M., McCombs, J.E., Sreenath, H.K., Blommel, P.G., Seder, K.D., et al. High-throughput purification and quality assurance of Arabidopsis thaliana proteins for eukaryotic structural genomics. J. Struct. Funct. Genomics. 2005;6:143–147. doi: 10.1007/s10969-005-1908-7. [DOI] [PubMed] [Google Scholar]
- LaVallie, E.R., Lu, Z., Diblasio-Smith, E.A., Collins-Racie, L.A., McCoy, J.M. Thioredoxin as a fusion partner for production of soluble recombinant proteins in Escherichia coli . Methods Enzymol. 2000;326:322–340. doi: 10.1016/s0076-6879(00)26063-1. [DOI] [PubMed] [Google Scholar]
- Lee, B.M., Buck-Koehntop, B.A., Martinez-Yamout, M.A., Dyson, H.J., Wright, P.E. Embryonic neural inducing factor Churchill is not a DNA-binding zinc finger protein: Solution structure reveals a solvent-exposed β-sheet and zinc binuclear cluster. J. Mol. Biol. 2007;371:1274–1289. doi: 10.1016/j.jmb.2007.06.021. [DOI] [PMC free article] [PubMed] [Google Scholar]
- Liew, C.K., Crossley, M., Mackay, J.P., Nicholas, H.R. Solution structure of the THAP domain from Caenorhabditis elegans C-terminal binding protein (CtBP) J. Mol. Biol. 2007;366:382–390. doi: 10.1016/j.jmb.2006.11.058. [DOI] [PubMed] [Google Scholar]
- Masino, L., Kelly, G., Leonard, K., Trottier, Y., Pastore, A. Solution structure of polyglutamine tracts in GST-polyglutamine fusion proteins. FEBS Lett. 2002;513:267–272. doi: 10.1016/s0014-5793(02)02335-9. [DOI] [PubMed] [Google Scholar]
- Masters, S.L., Yao, S., Willson, T.A., Zhang, J.G., Palmer, K.R., Smith, B.J., Babon, J.J., Nicola, N.A., Norton, R.S., Nicholson, S.E. The SPRY domain of SSB-2 adopts a novel fold that presents conserved Par-4-binding residues. Nat. Struct. Mol. Biol. 2006;13:77–84. doi: 10.1038/nsmb1034. [DOI] [PubMed] [Google Scholar]
- Mulder, F.A., Bouakaz, L., Lundell, A., Venkataramana, M., Liljas, A., Akke, M., Sanyal, S. Conformation and dynamics of ribosomal stalk protein L12 in solution and on the ribosome. Biochemistry. 2004;43:5930–5936. doi: 10.1021/bi0495331. [DOI] [PubMed] [Google Scholar]
- Riley, L.G., Ralston, G.B., Weiss, A.S. Multimer formation as a consequence of separate homodimerization domains: The human c-Jun leucine zipper is a transplantable dimerization module. Protein Eng. 1996;9:223–230. doi: 10.1093/protein/9.2.223. [DOI] [PubMed] [Google Scholar]
- Rischel, C., Madsen, J.C., Andersen, K.V., Poulsen, F.M. Comparison of backbone dynamics of apo- and holo-acyl-coenzyme A binding protein using 15N relaxation measurements. Biochemistry. 1994;33:13997–14002. doi: 10.1021/bi00251a006. [DOI] [PubMed] [Google Scholar]
- Sachdev, D., Chirgwin, J.M. Fusions to maltose-binding protein: Control of folding and solubility in protein purification. Methods Enzymol. 2000;326:312–321. doi: 10.1016/s0076-6879(00)26062-x. [DOI] [PubMed] [Google Scholar]
- Sakashita, E., Sakamoto, H. Characterization of RNA binding specificity of the Drosophila sex-lethal protein by in vitro ligand selection. Nucleic Acids Res. 1994;22:4082–4086. doi: 10.1093/nar/22.20.4082. [DOI] [PMC free article] [PubMed] [Google Scholar]
- Smith, D.B. Generating fusions to glutathione S-transferase for protein studies. Methods Enzymol. 2000;326:254–270. doi: 10.1016/s0076-6879(00)26059-x. [DOI] [PubMed] [Google Scholar]
- Stone, M.J., Chandrasekhar, K., Holmgren, A., Wright, P.E., Dyson, H.J. Comparison of backbone and tryptophan side-chain dynamics of reduced and oxidized Escherichia coli thioredoxin using 15N NMR relaxation measurements. Biochemistry. 1993;32:426–435. doi: 10.1021/bi00053a007. [DOI] [PubMed] [Google Scholar]
- Tang, C., Ndassa, Y., Summers, M.F. Structure of the N-terminal 283-residue fragment of the immature HIV-1 Gag polyprotein. Nat. Struct. Biol. 2002;9:537–543. doi: 10.1038/nsb806. [DOI] [PubMed] [Google Scholar]
- Tugarinov, V., Muhandiram, R., Ayed, A., Kay, L.E. Four-dimensional NMR spectroscopy of a 723-residue protein: Chemical shift assignments and secondary structure of malate synthase G. J. Am. Chem. Soc. 2002;124:10025–10035. doi: 10.1021/ja0205636. [DOI] [PubMed] [Google Scholar]
- Tyler, R.C., Aceti, D.J., Bingman, C.A., Cornilescu, C.C., Fox, B.G., Frederick, R.O., Jeon, W.B., Lee, M.S., Newman, C.S., Peterson, F.C., et al. Comparison of cell-based and cell-free protocols for producing target proteins from the Arabidopsis thaliana genome for structural studies. Proteins. 2005;59:633–643. doi: 10.1002/prot.20436. [DOI] [PubMed] [Google Scholar]
- Zheng, Z., Czaplicki, J., Jardetzky, O. Backbone dynamics of trp repressor studied by 15N NMR relaxation. Biochemistry. 1995;34:5212–5223. doi: 10.1021/bi00015a035. [DOI] [PubMed] [Google Scholar]


