Abstract
Viral infections often induce potent CD8 T cell responses that play a key role in antiviral immunity. After viral clearance, the vast majority of the expanded CD8 T cells undergo apoptosis, leaving behind a stable number of memory cells. The relationship between the CD8 T cells that clear the acute viral infection and the long-lived CD8 memory pool remaining in the individual is not fully understood. To address this issue, we examined the T cell receptor (TCR) repertoire of virus-specific CD8 T cells in the mouse model of infection with lymphocytic choriomeningitis virus (LCMV) using three approaches: (a) in vivo quantitative TCR β chain V segment and complementarity determining region 3 (CDR3) length repertoire analysis by spectratyping (immunoscope); (b) identification of LCMV-specific CD8 T cells with MHC class I tetramers containing viral peptide and costaining with TCR Vβ–specific antibodies; and (c) functional TCR fingerprinting based on recognition of variant peptides. We compared the repertoire of CD8 T cells responding to acute primary and secondary LCMV infections, together with that of virus-specific memory T cells in immune mice. Our analysis showed that CD8 T cells from several Vβ families participated in the anti-LCMV response directed to the dominant cytotoxic T lymphocyte (CTL) epitope (NP118–126). However, the bulk (∼70%) of this CTL response was due to three privileged T cell populations systematically expanding during LCMV infection. Approximately 30% of the response consisted of Vβ10+ CD8 T cells with a β chain CDR3 length of nine amino acids, and 40% consisted of Vβ8.1+ (β CDR3 = eight amino acids) and Vβ8.2+ cells (β CDR3 = six amino acids). Finally, we showed that the TCR repertoire of the primary antiviral CD8 T cell response was similar both structurally and functionally to that of the memory pool and the secondary CD8 T cell effectors. These results suggest a stochastic selection of memory cells from the pool of CD8 T cells activated during primary infection.
Keywords: immunological memory, CD8 T cells, viral immunity, T cell receptor, lymphocytic choriomeningitis virus
CD8+ T cells play a key role in the control and clearance of viral infections, and contribute to antiviral immunological memory (1). These lymphocytes recognize viral antigens presented in the context of self MHC class I molecules at the surface of infected cells. The T cell antigen receptor (TCR) is a membrane-bound heterodimer composed of α and β chains. Each chain is encoded by a series of rearranged segments termed variable (V),1 diversity (D), joining (J), and constant (C) (2, 3). The broad diversity of the TCR repertoire results from the numerous possible V-D-J (or V-J in α chains) combinations, from random mutations or nucleotide additions at the D-J and V-D (or V-J in α chains) junctions, and from the random pairing of separately recombined α and β chains. As in Igs, the most diverse portion of the TCR is the CDR3 of the β chain, which encompasses the V-D-J junctional area. It has been proposed (4–6) that this loop makes direct contacts with the peptide–MHC complex, and recent crystallographic studies support this notion (7). The length of the CDR3 has been shown to be a major determinant of antigen recognition (8–10), suggesting that the loop length influences the docking of the TCR with its ligand. Due to the broad diversity in the TCR repertoire, only a subset of all available T cells can recognize one given epitope. Direct examination of the TCR enables antigen-specific cells to be identified and tracked during immunization or infections. TCR usage also acts as a signature of the ongoing immune response and can be used to compare different expanding T cell subsets. For instance, comparative study of the primary antiviral T cell response and memory pool can be accomplished by TCR repertoire analysis.
The TCR repertoire of antiviral CTL responses has been studied for various systems in humans (8, 11–13), monkeys (14), and mice (15–24). Some of these analyses concluded or suggested that a limited subset of V segments are used by the CTLs responding to a given epitope. Conversely, other studies reported a broad TCR repertoire in the antiviral CTL response they analyzed (20, 21). Lymphocytic choriomeningitis virus (LCMV) infections in mice give rise to substantial CD8 T cell expansions, and at the peak of the response, >50% of the CD8 T cells are LCMV-specific (25). The TCR repertoire of the CTL response to LCMV infections has been studied for two different mouse strains. In C57BL/6 mice, TCR sequence of a few clones directed to one viral epitope (GP276–286) suggested usage of a limited number of V segments (16, 17). In BALB/c mice, where the CTL response is essentially directed against a single immunodominant Ld-restricted epitope (26), one study (21) reported isolation of three clones each using different V segment combinations: Vα1/Vβ10, Vα3/Vβ6, and Vα2/Vβ7. The report concluded that there was marked diversity in the responding TCR repertoire. However, all of these analyses, like most studies of the TCR repertoire in antiviral CTL responses, relied on isolation and in vitro expansion of lymphocytes, a step prone to introduce important biases in the TCR usage (27–30).
The T cell response to LCMV infection of mice occurs in three phases. First, there is a massive expansion of CD8+ T cells, with maximal numbers apparent at day 8 after infection. Second, a substantial decline of this population occurs, and >90% of the responding cells undergo apoptosis between days 8 and 30; and third, there is a period of long-term memory, with a stable number of memory CD8 T cells persisting for the life of the mouse (1, 31). Secondary infection of LCMV-immune mice results in rapid expansion of CTL effectors from the memory pool. These CD8 T cells expedite viral clearance and are the mediators of the protective immunity (1, 31). The links between the CD8 effector population at the peak of the primary response and the memory pool residing in the individual after viral clearance are not fully understood. One way to examine the relationship between primary effectors and memory cells, or between memory cells and secondary effectors, is to monitor their clonotypic composition by TCR repertoire analysis. Comparative study of TCR usage provides direct insight into the selection processes shaping T cell memory and anamnestic responses. These issues have been partially addressed in various systems. The CD8 T cell response to Listeria monocytogenes infection in mice was examined by functional TCR fingerprinting (32). That study found that TCR usage for one epitope was similar among primary effectors, memory T cell pool, and secondary effectors based on recognition patterns of alanine-substituted peptides. The T cell selection mechanisms have also been examined in the response to pigeon cytochrome C (PCC) and HLA-Cw3 (9, 10). McHeyzer-Williams and Davis (9) reported TCR repertoire narrowing in the secondary CD4 T cell response to PCC compared with the primary response, whereas Maryanski et al. (10) found no difference between the primary and secondary CD8 T cell responses to mouse tumor cell lines expressing HLA-Cw3.
In this study, the TCR repertoire of the CTL response to LCMV infection in BALB/c mice was examined directly by analysis of Vβ segment and CDR3 length distribution without any in vitro cell manipulation. We found systematic expansion of three subsets of T cells. We showed that these subsets were antigen-specific, as assayed by surface staining with soluble tetrameric MHC–peptide complexes, intracellular staining for IFN-γ, and functional assays on sorted cells. The three privileged T cell populations expanding upon infection were shown to account for 70% of the total LCMV-specific CD8+ T cells. The repertoire of acute primary effectors proved to be structurally and functionally similar to that of the memory pool remaining in the individual after viral clearance, and to the TCR repertoire of secondary effectors triggered by reinfection with LCMV. The implications of the magnitude and the kinetics of expansion and decline of these virus-specific T cell populations, as well as their role in immunological memory, are discussed.
Materials and Methods
Virus Infection and Mice.
6–8-wk-old female BALB/c mice were purchased from The Jackson Laboratory (Bar Harbor, ME). Mice were infected intraperitoneally with 2 × 10⁵ PFU of LCMV Armstrong and were used at indicated time points. For secondary rechallenge experiments, immune mice were injected intravenously with 2 × 10⁶ PFU of LCMV clone 13. Virus stocks were grown and quantitated as described previously (33).
Flow Cytometry and FACS® Analysis.
All the antibodies used in this study were purchased from PharMingen (San Diego, CA). Single cell suspensions of spleen were prepared, and 106 cells were stained in PBS containing 1% BSA and 0.02% sodium azide (FACS® buffer) for 30 min at 4°C followed by three washes in FACS® buffer. Samples were acquired on either a FACScan® flow cytometer or FACSCalibur® instrument (Becton Dickinson, San Jose, CA).
For sorting purposes, 3 × 10⁸ cells were incubated in 5 ml with 60 μg of anti-CD8 and anti-Vβ10 antibodies for 30 min at 4°C in RPMI 1640 medium supplemented with 10% FCS. The cells were then washed once in the same buffer and processed immediately on a FACSVantage® sorter (Becton Dickinson). All data were analyzed using CellQuest software (Becton Dickinson).
Intracellular IFN-γ Stain.
Spleen cells were cultured for 5 h in complete medium supplemented with 50 U/ml human recombinant IL-2 and 1 μl/ml Brefeldin A (GolgistopTM; PharMingen) either in the presence or absence of CTL epitope peptides. The peptides were used at a concentration of 0.1 μg/ml. The cells were first surface-stained, then washed and subjected to intracellular cytokine stain using the Cytofix/Cytoperm kit in accordance with the manufacturer's recommendations (PharMingen). For intracellular IFN-γ stain, we used FITC-conjugated rat anti– mouse IFN-γ mAb (clone XMG 1.2) and its isotype control Ab (rat IgG1; both from PharMingen).
In experiments analyzing IFN-γ production and TCR Vβ usage (see Fig. 5) after stimulation with specific peptide, there was substantial downregulation of the TCR. Because of this TCR downregulation, the staining pattern of antigen-specific CD8 T cells was not clearly defined. For better staining of the activated CD8 T cells, we used a high concentration of biotinylated anti-Vβ8.1–8.2 or -Vβ10 Ab (4 μg per 106 cells in 100 μl vol) and subsequently added Cy-chrome–coupled streptavidin (PharMingen) to further amplify the signal.
Figure 5.
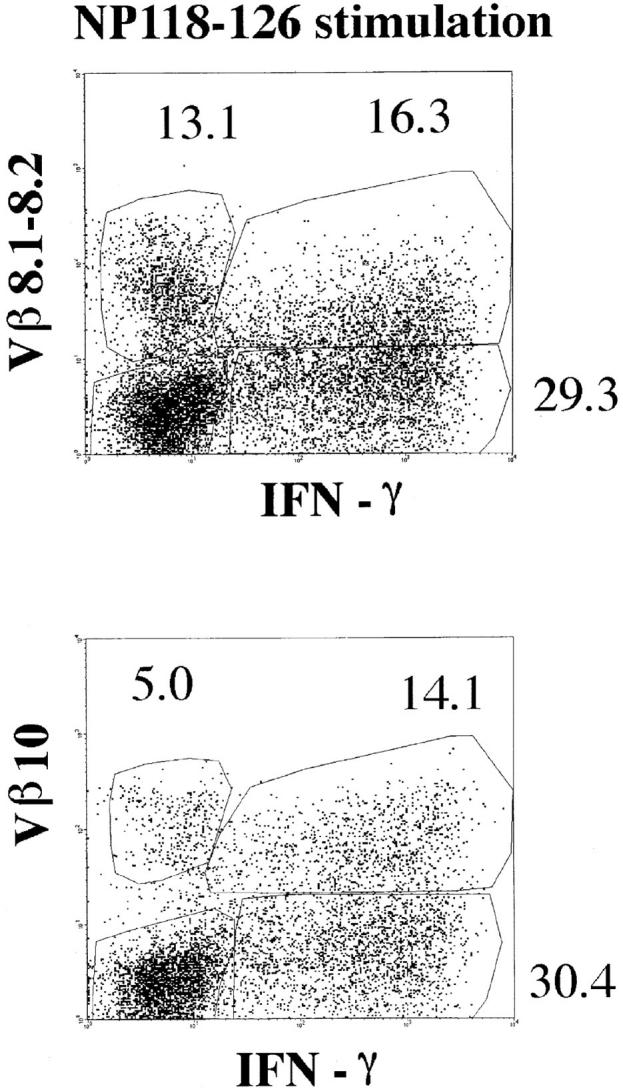
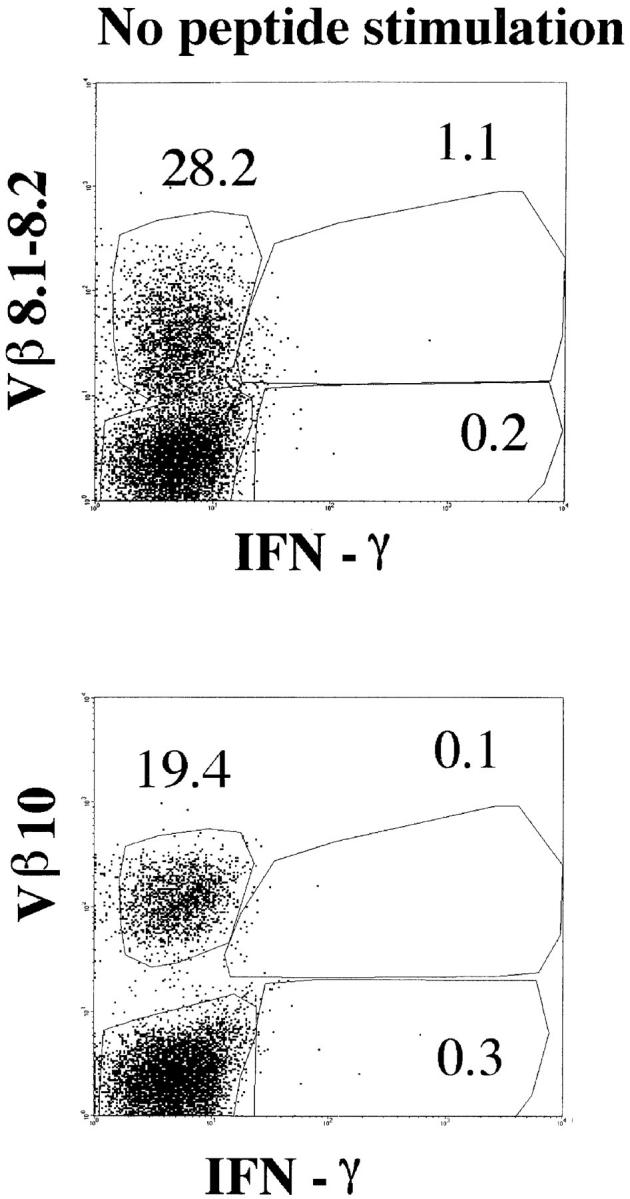
Intracellular staining for IFN-γ. Splenocytes from BALB/c mice at day 8 after LCMV infection were incubated with or without NP118–126 peptide and stained for CD8, Vβ10, or Vβ8.1–8.2 and intracellular IFN-γ. The panels show the Vβ10 or Vβ8.1–8.2 and intracellular IFN-γ analyses of gated CD8+ cells. All numbers are in percentage of gated cells.
Enzyme-linked Immunospot Assay for IFN-γ–secreting Cells.
The enzyme-linked immunospot (ELISPOT) assays were performed as described by Murali-Krishna et al. (25) and Taguchi et al. (34). In brief, 96-well filtration plates (Millipore Corp., Bedford, MA) were coated with rat anti–mouse IFN-γ Ab (clone R4-6A2; PharMingen), and responder cells were added into the wells along with 5 × 10⁵ γ-irradiated syngeneic feeder cells. Cells were incubated for 36 h either in the presence or absence of peptide stimulation (0.1 μg peptide/ml). The amino acid sequences of peptides used have been described (35, 36). After the culture, plates were washed followed by incubation with biotinylated anti–mouse IFN-γ Ab (clone XMG 1.2; PharMingen). Spots were developed using freshly prepared substrate buffer (0.03% [wt/vol] 3-amino-9-ethyl-carbazole, 0.015% [vol/vol] H202 in 0.1 M sodium acetate, pH 5). Using this assay, we could accurately measure a minimum of 10 spots in 106 responder cells.
Preparation of H-2Ld Tetramers.
H2-Ld tetramers were prepared as described by Murali-Krishna et al. (25). In brief, bacterial expression of Ld and human β2-microglobulin was driven from pET23-Ld-BSP and pHN1-β2m vectors in Escherichia coli strain BL21(DE3). Folding was performed in the presence of NP118– 126 peptide. Purification by ionic exchange was followed by in vitro biotinylation using purified BirA enzyme. Tetramers were assembled by mixing biotinylated Ld-NP118–126 monomeric complexes with fluorophore-conjugated avidin.
Ex Vivo CTL Assay and Limiting Dilution Assay.
Cytotoxic activity was tested in a standard 6-h 51Cr-release assay as described previously (33). Targets were coated with peptide at a concentration of 0.1 μg/ml. Limiting dilution analysis (LDA) was performed as described previously (31, 35).
Immunoscope Analysis.
Immunoscope analyses were performed as described by Pannetier et al. (37, 38). In brief, single cell suspensions of individual spleens were prepared, and total RNA was extracted. The cDNA synthesis was primed with a (dT)15 oligonucleotide. An array of 24 PCR reactions was then performed with oligonucleotide Cβ2 (GCCAGAAGGTAGCAGAGACCC) and 24 unique Vβ-specific primers (see reference 37 for sequences). Then 24 run-off reactions were done using fluorescent primer Cβ5′ (CTTGGGTGGAGTCACATTTCTC). After analysis on an automated sequencer (model 377; Applied Biosystems, Inc., Foster City, CA), the repertoire profile (i.e., the distribution of the β chains in the various CDR3 lengths for each Vβ) was calculated with Immunoscope version 1.0 software (38).
Results
Immunoscope Analysis Reveals Three Privileged Responses to LCMV Involving Vβ10+, Vβ8.1+, and Vβ8.2+ T Cells.
During the course of an acute LCMV infection in BALB/c mice, the total number of activated CD8+ splenocytes increases dramatically (>10-fold) during the first 8 d, then declines to reach a stable level after an additional 2–4 wk (25, 31, 39). To identify these T cells expanding in response to LCMV, we performed a quantitative in vivo TCR repertoire analysis. We used the immunoscope approach (also referred to as “spectratyping”; references 30, 37, 38, and 40–45). With this technique, the TCR repertoire can be broken down into 21 subrepertoires (one for each functional Vβ segment [37]), which are analyzed individually. The CDR3 length profiles of all functional TCR Vβ genes are determined by specific reverse transcription PCR. For each of these segments, the profile acts as a density function or a histogram, giving the relative abundance in vivo of T cells using each possible CDR3 length. With this compartmentalized approach, immune responses are monitored by the CDR3 profile changes they induce in each Vβ subrepertoire. Variations in the profiles result from oligoclonal expansion or deletion of T cells using particular Vβ/CDR3 length combinations.
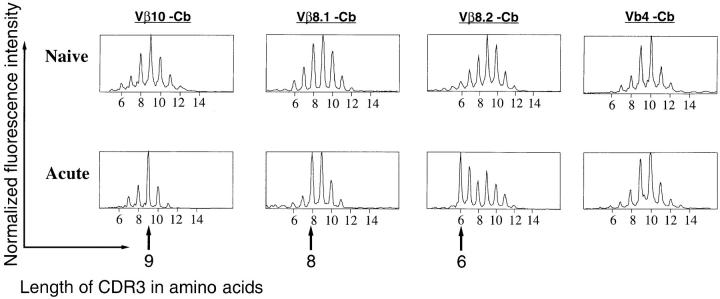
With this approach, we compared the TCR repertoires of naive mice and mice at the peak of an acute LCMV infection. Total splenocytes were harvested from naive BALB/c mice and from animals at day 8 after LCMV infection. Previous studies (37) have shown that in naive mice of various strains, the profiles show successive peaks separated by three bases (i.e., one codon). The heights of these peaks follow Gaussian-like curves centered on an average CDR3 length specific for each Vβ segment. As expected from these previous studies, we observed such shapes for the CDR3 length profiles in the naive BALB/c TCR repertoire (Fig. 1). At day 8 after LCMV infection, the CDR3 profile of 18 out of the 21 Vβ subrepertoires remained relatively unchanged as exemplified by the Vβ4 profiles. In contrast, the CDR3 profiles of the remaining three Vβ segments showed very reproducible strong distortions in all the LCMV-infected mice, a characteristic of “public responses” (30, 45). As shown in Fig. 1, striking public responses to LCMV in BALB/c mice occurred in the Vβ10, Vβ8.1, and Vβ8.2 subrepertoires. Each of these three profiles showed expansion of T cell populations using β chains of a privileged CDR3 length: Vβ10+, CDR3 = nine amino acids; Vβ8.1, CDR3 = eight amino acids; and Vβ8.2, CDR3 = six amino acids. At day 8 after infection, the area of the major expanded peaks (CDR3 lengths) showed that these populations accounted for 50–70% of the entire Vβ10 subrepertoire, 30–40% of the Vβ8.1 subrepertoire, and 20–30% of the Vβ8.2 repertoire. This highly reproducible feature prompted us to better characterize both structurally and functionally these public immune responses to LCMV infection.
Figure 1.
Profiles of the Vβ10, Vβ8.1, Vβ8.2, and Vβ4 subrepertoires in spleen cells from naive and LCMV-infected (day 8) BALB/c mice. x-axis, Lengths in amino acids of the CDR3 regions; y-axis, fluorescence intensities, reflecting the number of clones using each Vβ/ CDR3 length combination. Each plot is normalized; therefore, the unit of the ordinate is arbitrary. Arrows, Position of the major public responses.
Vβ10+CD8+ and Vβ8.1–8.2+CD8+ Cell Populations Parallel the Expansion and Decline of CD8 T Cells during the Course of LCMV Infection.
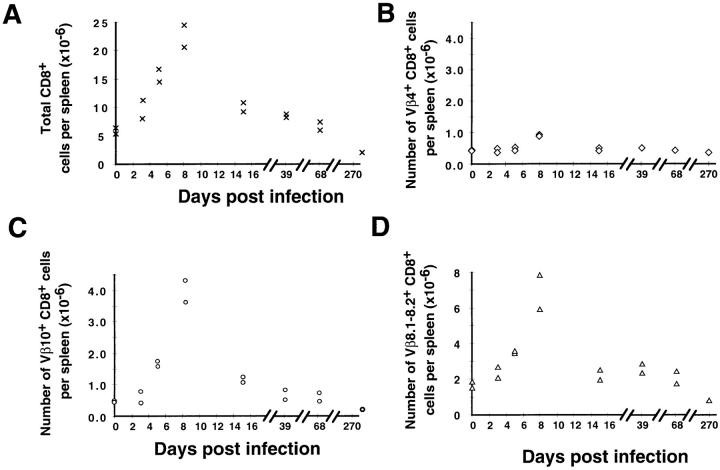
Using Vβ-specific mAbs, we followed Vβ10+ and Vβ8.1–8.2+ T cells by FACS® analysis during the course of an acute LCMV infection in BALB/c mice. Splenocytes were harvested at successive time points after LCMV infection (days 3, 5, 8, 15, 39, 68, and 270 after infection) and surface-stained for CD8 or CD4, and LFA1 (as an activation marker), as well as Vβ10, Vβ8.1–8.2, or Vβ4 (as a negative control). Since the Vβ10, Vβ8.1, and Vβ8.2 public responses were observed on total splenocytes, the distortion of the CDR3 length profiles could have been due to either or both CD4+ and CD8+ T cell expansions. The surface stains showed that no particular CD4+Vβ10+ or CD4+Vβ8.1–8.2+ T cell expansion occurred during the course of infection (data not shown). However, as shown in Fig. 2, the CD8+Vβ10+ and CD8+Vβ8.1–8.2+ T cell populations increased dramatically during the first 8 d, then declined to reach stable levels after 1 mo. Direct comparison of Fig. 2, A, C, and D shows that the expansion and contraction of the total CD8+, Vβ10+CD8+, and Vβ8.1–8.2+CD8+ T cell populations followed parallel courses. The expansion was visible as early as day 3 after infection. When it reached its peak at day 8, the CD8+Vβ10+ and CD8+Vβ8.1–8.2+ T cell population numbers were 10- and 5-fold higher, respectively, than in a naive BALB/c mouse. As expected from immunoscope analysis, where no public response was observed such as for the Vβ4 segment, FACS® analysis did not show a substantial Vβ4+ T cell expansion (Fig. 2 B).
Figure 2.
Kinetics of CD8+ T cell expansion and decline. Quantitation of total CD8+ (A), Vβ4+CD8+ (B), Vβ10+CD8+ (C), or Vβ8.1– 8.2+CD8+ (D) cells in the spleen during the course of acute LCMV infection. Each point represents an individual mouse.
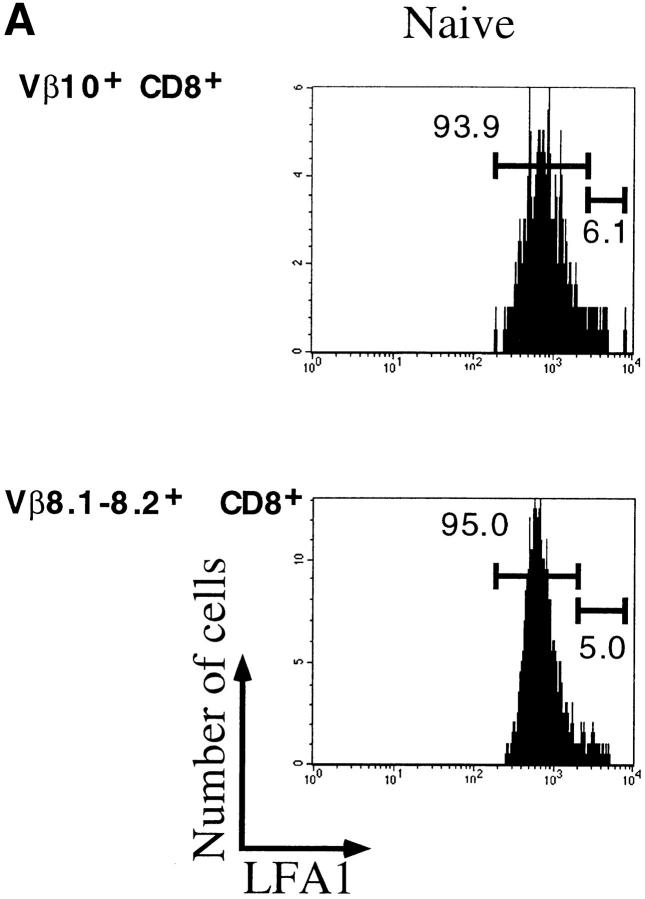
The activation status of the expanding cells was examined by staining for LFA1 (CD11a). Fig. 3 A shows that at the peak of the response, >80% of the Vβ10+ and Vβ8.1– 8.2+CD8+ T cells were activated. These numbers match the proportions of expanded populations measured by immunoscope. Even in immune mice, there was a substantial proportion of LFA1high cells among these two Vβ families. As a result, the CD8+LFA1high lymphocyte pool was enriched in Vβ10+ and Vβ8.1–8.2+ T cells (Fig. 3 B).
Figure 3.
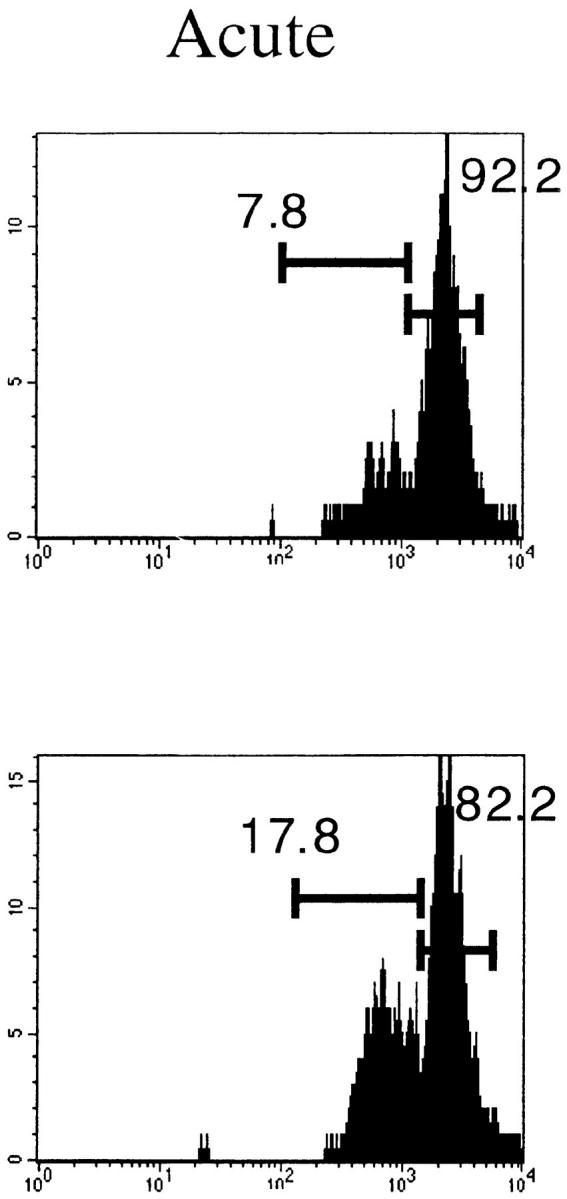
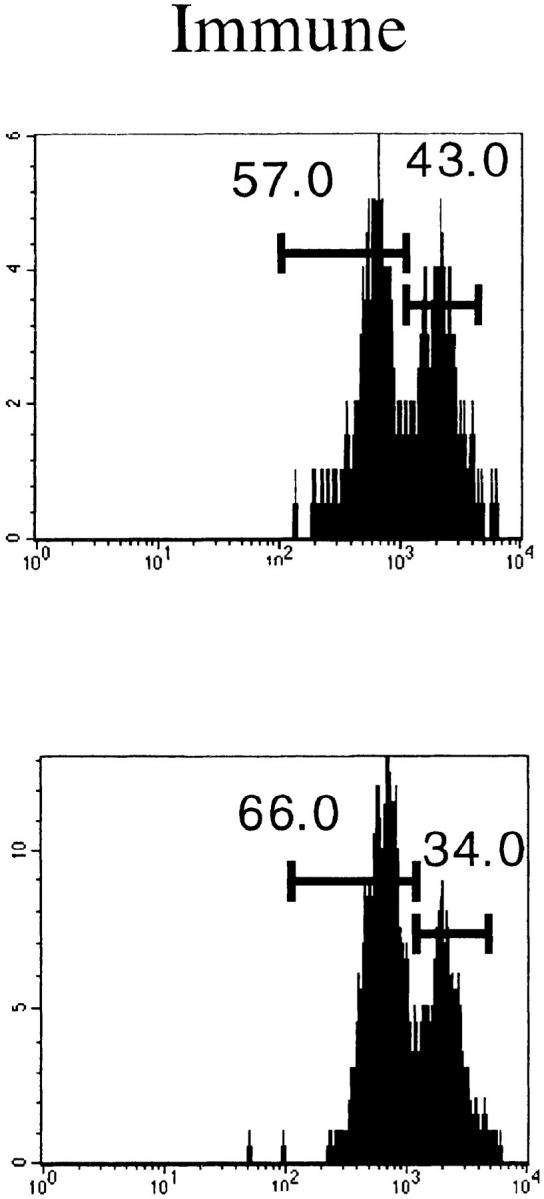
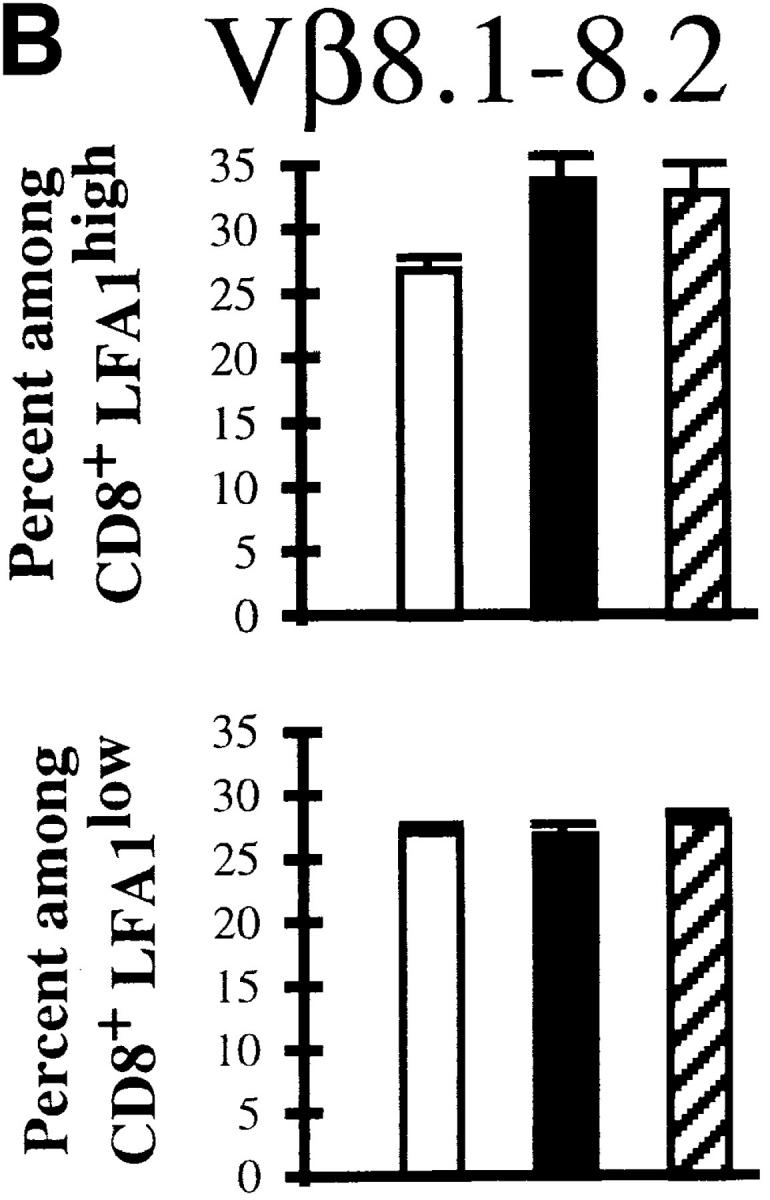
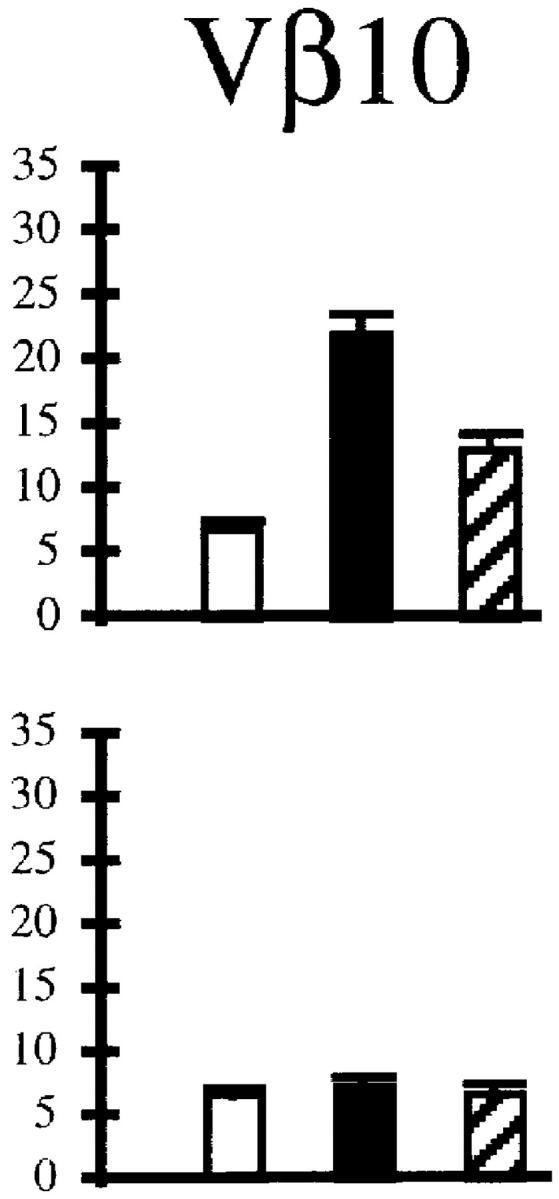
Activation status of Vβ10+ and Vβ8.1–8.2+ cells in naive, acute (day 8 after infection), and immune (>day 38 after infection) mice. (A) LFA1 analyses of CD8+Vβ10+ or CD8+Vβ8.1–8.2+ gated cells. All numbers are in percentage of gated cells. (B) Comparison of the frequencies of Vβ10+ and Vβ8.1–8.2+ cells among CD8+LFA1high and CD8+LFA1low cells. White bars, Naive; black bars, acute; striped bars, immune. The values plotted are averages ± SEs calculated from seven mice.
Vβ10+ and Vβ8.1–8.2+ Cells Account for 70% of All LCMV-specific CD8+ T Cells.
The fact that after LCMV infection, the proportions of both Vβ10+ and Vβ8.1–8.2+ cells differ between activated and nonactivated CD8+ populations, together with the observed bias for particular CDR3 lengths, imply that the T cell repertoire differs between the expanding activated and resting nonactivated CD8+ populations. This structural feature could be due to the selective growth of T cells specific for LCMV. To test this hypothesis, we examined the specificity of the expanding cells with several structural and functional assays.
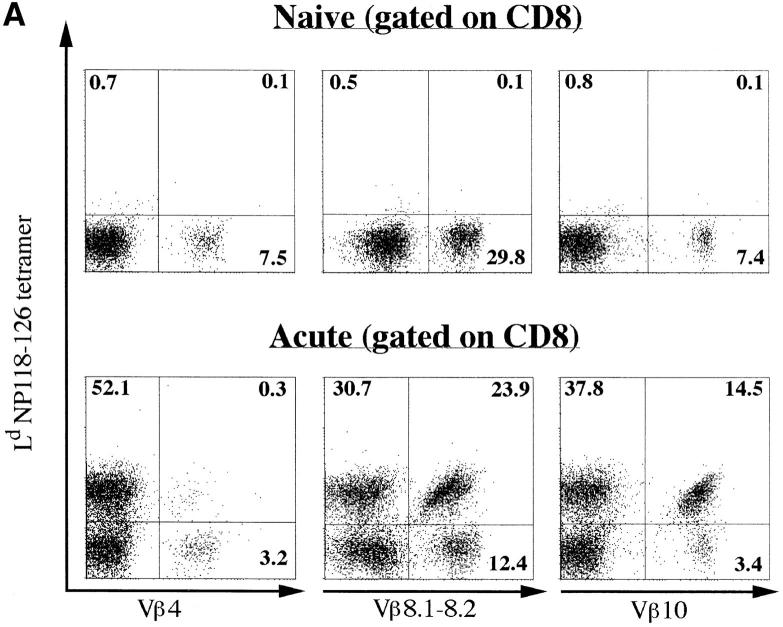
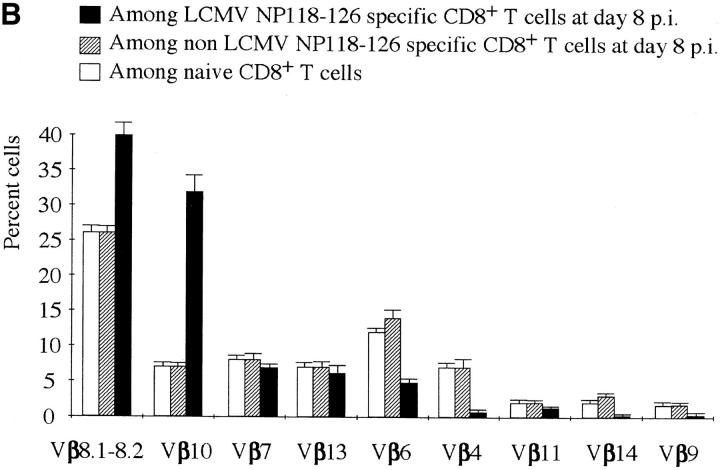
The CD8+ response of BALB/c mice to acute LCMV infection is almost entirely (i.e., >96% of the CD8+ T cells) directed towards the NP118–126 immunodominant epitope presented by the Ld molecule (25, 26). We took advantage of this feature to identify virus-specific T cells by staining with Ld-NP118–126 MHC class I tetramers (25, 46). Splenocytes were harvested from naive and LCMV-infected BALB/c mice, and stained with CD8 and TCR Vβ–specific antibodies together with Ld-NP118–126 tetramers. Examples of these costains are shown in Fig. 4 A. At the peak of the response, 50–55% of the total CD8+ T cells recognized the immunodominant NP118–126 epitope. The overall Vβ usage in the repertoire of the NP118–126-specific pool is summarized in Fig. 4 B and compared with the Vβ usage in the non-antigen–specific CD8+ pool in acute mice or in the CD8+ population of a naive mouse. While the non-LCMV–specific CD8+ repertoire was similar to that of a naive mouse, the Vβ usage of the CD8+ T cells binding to Ld-NP118–126 tetramers was strongly biased. At the peak of the response, the spleen contained ∼2.4 × 10⁷ CD8+ lymphocytes. Therefore, ∼1.3 × 10⁷ cells were LCMV NP118–126-specific, of which 30% (3.9 × 10⁶ cells) were Vβ10+ and almost 40% (5.2 × 10⁶ cells) were Vβ8.1–8.2+ (Fig. 4, A and B). Thus, the bulk of the response at day 8 after infection used only three different Vβ segments. Therefore, the TCR repertoire in the LCMV-specific population was narrow relative to the non-antigen–specific CD8+ pool in the same animals. Moreover, ∼60% of all CD8+Vβ8.1–8.2+ cells and 85% of all Vβ10+CD8+ lymphocytes were directed against NP118– 126 (Fig. 4 A). This frequency matches the magnitude of the massive public responses within these Vβ subrepertoires observed by CDR3 length profile analysis.
Figure 4.
TCR usage of LCMV NP118–126-specific CD8 T cells. (A) Flow cytometry analyses of Ld-NP118–126 tetramer–stained cells. Spleen cells from naive or LCMV acute mice (day 8) were stained with Ld-NP118–126 tetramers, and antibodies to CD8 as well as to Vβ4, Vβ8.1– 8.2, or Vβ10. FACS® events were gated on CD8+ cells. All numbers are in percentage of gated cells. (B) Summary of Vβ usage among LCMV-specific CD8 T cells (black bars), non-LCMV–specific CD8 T cells (striped bars), and naive CD8 T cells (white bars). All values are expressed in percent and are averaged from three to six mice.
To confirm our analysis of Vβ usage in the response to the single immunodominant NP118–126 epitope, we used a functional assay for antigen specificity. Detection of IFN-γ secretion upon specific antigenic stimulation was performed by anticytokine intracellular staining at day 8 after LCMV infection. Once harvested, the splenocytes were stimulated in vitro for 5 h in the presence or absence of NP118–126 peptide. The cells were subsequently surface-stained for CD8 and Vβ10 or Vβ8.1–8.2, and intracellular stain for IFN-γ was then performed. Fig. 5 shows that 74% of the Vβ10+CD8+ cells and 55% of the Vβ8.1–8.2+CD8+ cells responded to 5 h of stimulation with NP118–126 by secreting IFN-γ and downregulating TCR levels. In this functional assay, Vβ10+CD8+ and Vβ8.1–8.2+CD8+ cells accounted for 32 and 36%, respectively, of the total anti-LCMV CD8 response. These figures match the proportions obtained by flow cytometry on cells stained with Ld-NP118– 126 tetramers.
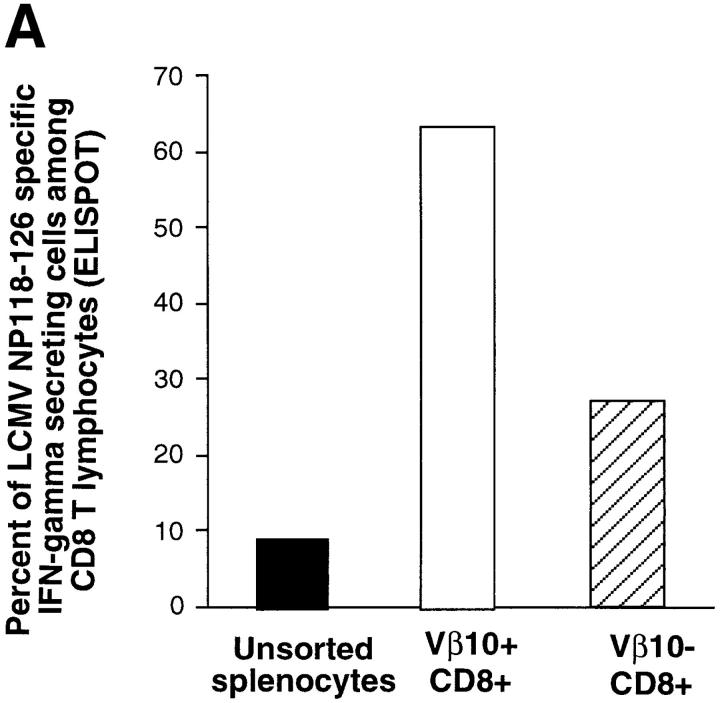
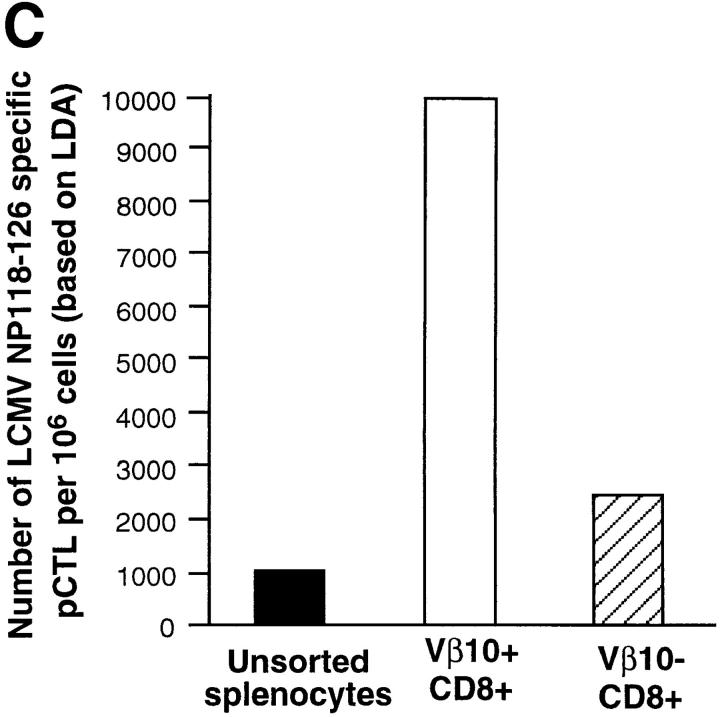
To further confirm the massive anti-LCMV CD8+ response in the Vβ10+ subrepertoire, we performed functional assays on sorted Vβ10+CD8+ and Vβ10−CD8+ populations. 6-wk-old BALB/c mice were infected with LCMV and killed at day 8 after infection. Splenocytes were harvested, pooled, and surface-stained for CD8 and Vβ10. The Vβ10+CD8+ and Vβ10−CD8+ populations were then sorted, and were found to be 91 and 99% pure, respectively, after sorting. For each sorted population, as well as unsorted total splenocytes, the frequency of cells producing IFN-γ after stimulation by the NP118–126 peptide was measured by ELISPOT assay. As shown in Fig. 6 A, at day 8 after LCMV infection, >60% of the Vβ10+CD8+ lymphocytes secreted IFN-γ after stimulation with NP118– 126 peptide. The frequency of NP118–126-specific T cells was ∼2.5 times lower in the Vβ10−CD8+ population. We also performed an LDA on these two sorted cell populations to measure the frequency of NP118–126-specific CTL precursors. As shown in Fig. 6 C, the frequency was about fourfold higher in the Vβ10+CD8+ population than in the Vβ10−CD8+ population, a ratio consistent with the cytokine ELISPOT data (Fig. 6 A).
Figure 6.
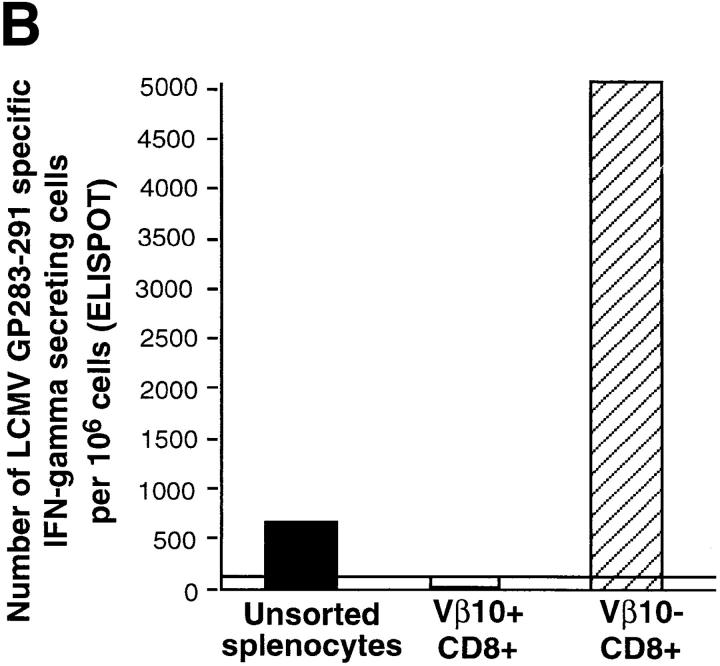
Functional analyses of sorted Vβ10+CD8+ and Vβ10−CD8+ cells. IFN-γ ELISPOT assays measuring the frequencies of LCMV-specific T cells in the unsorted or sorted populations. (A) Frequencies of NP118–126-specific cells. (B) Frequencies of GP283–292-specific T cells. (C) LDA of NP118–126-specific CTL precursor in the unsorted or sorted populations.
Although the CD8+ response to LCMV in BALB/c mice is essentially directed against NP118–126, a response to the Kd-restricted subdominant GP283–292 epitope can also be detected at day 8 after infection, yet at a far lower level (<1% of the total antiviral response; references 35 and 36). We used this feature of the BALB/c immune response as a control in our functional characterization of Vβ10+ CD8+ and Vβ10−CD8+ isolated populations. As shown in Fig. 6 B, all of the GP283–292-specific cells were found among Vβ10−CD8+ splenocytes. This result shows that while highly responsive to the Ld-restricted NP118–126 stimulus, the Vβ10+CD8+ population is ignorant of the Kd-restricted GP283–292 subdominant epitope.
These functional assays on sorted cells, together with the MHC class I tetramer staining and the intracellular staining for IFN-γ, all show that most of the Vβ10+CD8+ T and a majority of the Vβ8.1–8.2+CD8+ cells were functionally specific for the NP118–126 immunodominant peptide.
Conserved TCR Usage among Primary, Memory, and Secondary CD8+ T Cell Responses to LCMV.
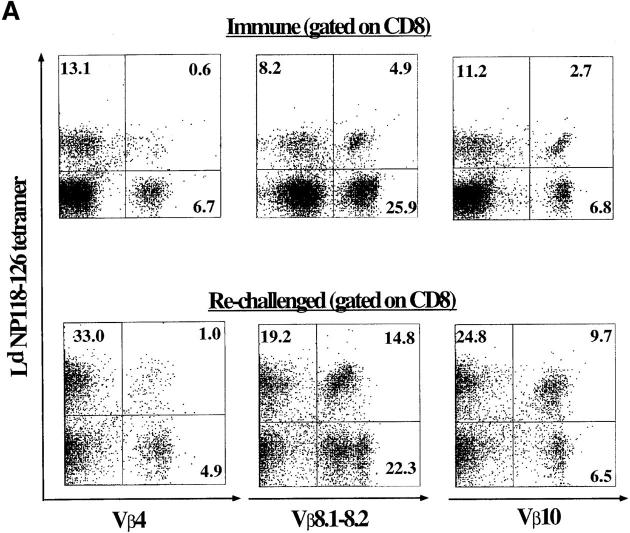
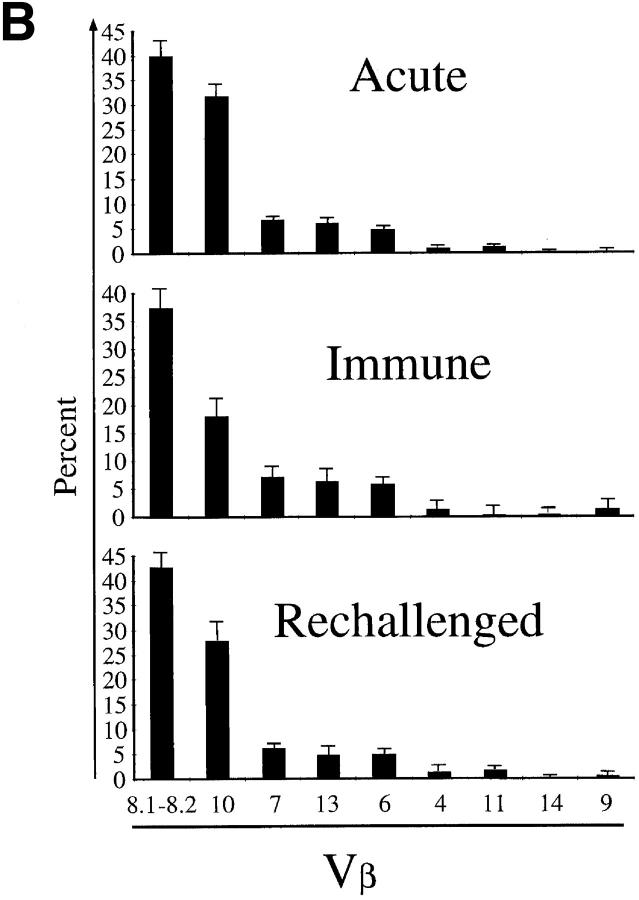
TCR repertoire analysis provided us with a means to monitor LCMV-specific T cells in BALB/c mice. Having used it to analyze the primary CD8+ T cell response to LCMV, we applied this approach to characterize virus-specific T cells in the memory pool. Splenocytes from LCMV-immune mice (between days 39 and 68 after infection) were stained with Ld-NP118–126 tetramers to identify antigen-specific cells and costained with CD8 and a panel of Vβ-specific antibodies. The results of these analyses are summarized in Fig. 7 B, and representative FACS® profiles for selected Vβ families are shown in Fig. 7 A. The TCR usage of NP118–126-specific CD8+ T cells in immune mice was strikingly similar to the pattern seen during the primary response (day 8). Vβ8.1–8.2+ and Vβ10+ cells again accounted for the majority of LCMV-specific memory CD8+ T cells, and the overall hierarchy of TCR usage of memory CD8+ T cells was similar to the effector population at day 8 (Fig. 7 B). Since the absolute numbers of NP118–126-specific CD8+ T cells in immune mice was ∼10-fold lower than the numbers at the peak of the primary response, the results in Fig. 7 show that TCR usage did not play a major role in determining which LCMV-specific CD8+ T cells died and which survived to go into the memory pool.
Figure 7.
TCR repertoire analysis of LCMV-specific CD8 T cells in immune and rechallenged mice. (A) Vβ4, Vβ10, or Vβ8.1–8.2 and Ld-NP118–126 analyses on gated CD8+ T cells from an LCMV-immune mouse and an immune mouse 5 d after rechallenge with LCMV. The figures are in percentage of total CD8 T cells. (B) Summary of TCR Vβ usage in acute, immune, and rechallenged mice. The values plotted are averaged from three to six mice. The total number of Ld-NP118–126+-specific cells per spleen was 11.1 × 10⁶ ± 2 × 10⁶ in acute mice, 9.7 × 10⁵ ± 2 × 10⁵ in immune mice, and 5.1 × 10⁶ ± 0.8 × 10⁶ in rechallenged mice.
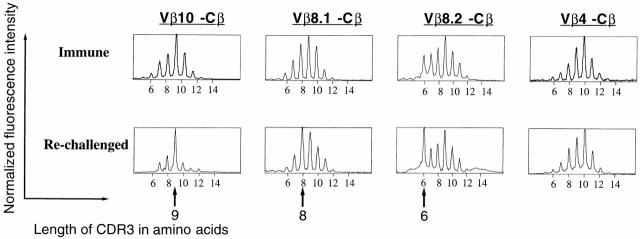
We next examined the TCR usage of LCMV-specific CD8+ T cells during a secondary response. Immune mice were rechallenged with LCMV, and at the peak of the anamnestic response (day 5 after infection), in vivo TCR repertoire analysis was done by staining with Ld-NP118–126 tetramers and Vβ-specific antibodies, and also by determining Vβ/CDR3 length profiles by immunoscope. As shown in Fig. 7, A and B, major expansions again occurred in LCMV-specific CD8+ T cells expressing Vβ10 or Vβ8.1– 8.2. The overall TCR usage of the virus-specific secondary response was similar to the primary response and the memory T cell pool. Moreover, the CDR3 length analysis (Fig. 8) showed, as in the primary infection, that three striking oligoclonal responses were apparent: Vβ10+, CDR3 = nine amino acids; Vβ8.1, CDR3 = eight amino acids; and Vβ8.2, CDR3 = six amino acids. Also, similar to the primary response, only limited distortions of the CDR3 length profile were observed for the other Vβ segments, as exemplified by the profile for Vβ4 (Fig. 8).
Figure 8.
Profiles of the Vβ10, Vβ8.1, Vβ8.2, and Vβ4 subrepertoires in the secondary response of BALB/c mice to LCMV. Top, Profiles at 125 d after LCMV infection. Bottom, Profiles of an immune mouse at day 5 after rechallenge with LCMV. x-axis, Lengths in amino acids of the CDR3 regions; y-axis, fluorescence intensities (reflecting the number of clones with a particular CDR3 length using Vβ10, Vβ8.1, Vβ8.2, or Vβ4). Arrows, Position of the major public responses.
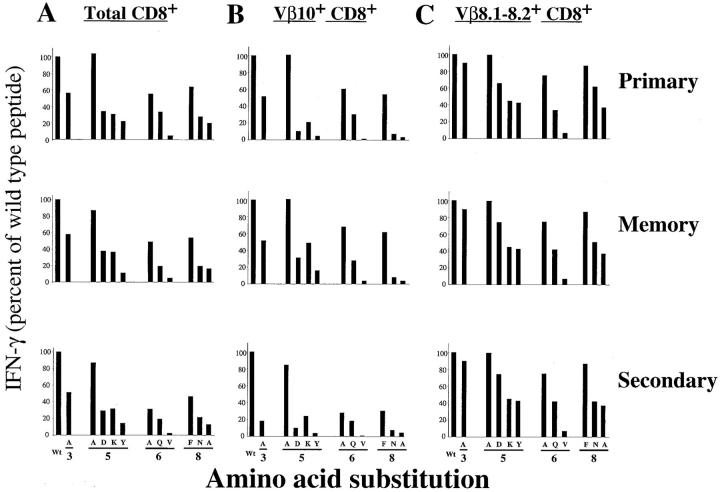
The above data provided structural evidence that LCMV-specific primary, memory, and secondary CD8+ T cell responses were similar. We also needed some functional confirmation that the LCMV-specific T cell repertoire comprised similar subsets of clones during the acute primary response, in the T cell memory pool remaining after viral clearance, and during secondary infection. To this end, we examined the TCR functional fingerprints of these three T cell populations by variant peptide analysis. In this approach, single point mutations are introduced in the epitope, and their impact on T cell recognition is measured by functional assays (32, 47–49). Variant peptides derived from the wild-type LCMV NP118–126 sequence (RPQA- SGVYM) were synthesized with single amino acid substitutions. All positions but the two known anchor residues (positions 2 and 9) were tested. Mutations in positions 3, 5, 6, and 8 appeared to affect TCR contact without abolishing the binding of the peptide to Ld (data not shown). A set of mutant peptides was used to stimulate splenocytes from acute, immune, or rechallenged mice. The cells were then stained for surface markers CD8, Vβ10, and Vβ8.1–8.2 as well as intracellular IFN-γ. Since the substituted peptides retain substantial affinity for Ld, the variations in T cell activation, as measured by IFN-γ secretion, reflect the impact of each mutation on TCR recognition. Fig. 9 A shows the compilation of these measurements for total CD8+ T cells. The fingerprints obtained by intracellular staining for IFN-γ were similar between primary effectors and memory cells. The profile also remained comparable for secondary effectors. As a control, standard cytolytic assays were used for primary and secondary effectors to verify that the mutations affected cytotoxicity to the same extent as IFN-γ secretion (data not shown). Fig. 9, B and C, shows fingerprint analyses of CD8+ T cells expressing Vβ10 or Vβ8.1–8.2. Comparison of the fingerprints of the NP118–126-specific Vβ10+ and Vβ8.1–8.2+ populations within any individual mouse showed that although comparable, the fingerprints of these two populations were not identical. Whenever a mutation inhibited TCR recognition, its effect was stronger on Vβ10+CD8+ cells than on Vβ8.1–8.2+ T lymphocytes. These different profiles for Vβ10+ and Vβ8.1–8.2+ validated our technical approach and confirmed that the inhibitory mutations on positions 3, 5, 6, and 8 were affecting TCR contact residues. As shown in Fig. 9, B and C, both for CD8+Vβ10+ and CD8+Vβ8.1–8.2+ populations, the profiles were well conserved between the acute response (top) and the memory pool (middle). These fingerprints show that the memory pool remaining after viral clearance is functionally similar to the primary CTL effector population. The fingerprints of the effectors during anamnestic response to reinfection (bottom) were also close to those of acute primary T cell effectors or memory CD8+ T cell pool, although the impact of mutations in the NP118– 126 epitope seemed slightly stronger for the Vβ10+CD8+ secondary response.
Figure 9.
TCR functional fingerprinting of LCMV NP118–126-specific CD8 T cells. TCR fingerprints of total CD8 T cells (A), Vβ10+CD8+ (B), and Vβ 8.1–8.2+CD8+ cells (C). Primary effectors (top), memory T cells (middle), or secondary effectors (bottom) were tested for IFN-γ secretion with variant peptides derived from NP118–126. The number of IFN-γ–secreting cells seen after stimulation with variant peptides was normalized to the number obtained with the wild-type peptide (Wt) and is expressed as percentage of wild-type response. The data shown are representative of six experiments.
Discussion
In this report, we have structurally and functionally defined the CD8+ T cell populations responding to acute LCMV infection in BALB/c mice. Our studies have clearly shown that three oligoclonal populations comprise up to 70% of the CD8+ T cell response to LCMV infection. Moreover, by comparing the LCMV-specific T cell population during primary infection, at the memory stage, and during secondary reinfections, we have demonstrated that the acute CD8+ effector response and the memory T cell pool use a similar TCR repertoire.
A Limited CD8 T Cell Repertoire Responds to Acute LCMV Infection by Undergoing Massive Expansion.
Combining surface staining with fluorescent MHC–peptide tetramers and the immunoscope approach, we quantitatively examined the in vivo T cell immune response to LCMV infection in the BALB/c mouse. Out of the 168 Vβ segment/CDR3 length possible combinations (45), three were used predominantly: Vβ10+, CDR3 = nine amino acids; Vβ8.1, CDR3 = eight amino acids; and Vβ8.2, CDR3 = six amino acids. They accounted for 70% of the antiviral CTL response. This high expansion of a few limited subsets of clones distorted the responding CD8+ T cell repertoire and narrowed its complexity. Such predictable use of TCR segments by antigen-specific T cells has been observed in other systems (30, 45) and termed “public response” by analogy with true public B cell clones. However, several analyses performed in mice (30, 50, 51) have shown that although T cells involved in the same public response use the same Vβ segment and have identical β chain CDR3 lengths, they may use different α chains and also different Jβ and Dβ segments. Although variations in the V-D-J recombination processes probably lead to naive repertoires that are not strictly identical from mouse to mouse, the frequency of rearrangements coding for CDR3 peptidic sequences similar enough to be recruited in a particular public response remains high. Preliminary results (D. Sourdive, unpublished data) show that several different Jβ segments are used by the LCMV-specific Vβ10+CD8+ as well as Vβ8.2+CD8+ T cells. Therefore, the CDR3 peptidic sequence of the responding cells is degenerated. We propose that this relaxed sequence requirement for T cells using the {Vβ10+, CDR3 = 9 amino acids}, {Vβ8.1, CDR3 = 8 amino acids}, or {Vβ8.2, CDR3 = 6 amino acids} combination allows any naive BALB/c mouse to have a large pool of eligible LCMV-specific precursors in these three subrepertoires. Therefore, the probability that some of them will encounter the antigen during the infection is very high, systematically leading to the three strong public responses.
Horwitz et al. (21) reported three different TCR sequences used by T cell clones specific for the immunodominant NP118–126 epitope. Interestingly, one of these clones expresses Vβ10 with a β chain CDR3 length of nine amino acids, fitting one of the public responses we observed in vivo. The two other clones characterized by Horwitz et al. use the Vβ6 and Vβ7 segments that each contribute 5–7% of the response in vivo (Fig. 4 B). It is likely that the in vitro expansion and the substantial antigenic stimulation favored the isolation of these less frequent LCMV-specific clones. Numerous studies have shown that culturing lymphocytes in vitro may introduce drastic biases in the composition of the resulting population (27–30). Both our MHC–peptide tetramer–based flow cytometric analysis and the direct quantitative reverse transcription PCR analysis circumvent these in vitro biases (37, 38, 41, 44, 45).
Restricted T cell repertoires have been reported in other viral systems, including influenza (11, 19, 52), EBV (53– 55), HSV1 (22, 24, 56), CMV (12, 15), simian immunodeficiency virus (14), HIV (8), hepatitis C virus (13, 57), and enteric reovirus (23). Many of these viral infections elicit responses to several immunodominant epitopes; however, the TCR repertoire of each resulting response seems restricted. Limited TCR complexity in the CD8+ T cell pool seems to be a conserved feature of acute responses to viral infections. As reported here, this feature is also shared by LCMV; therefore, it is probable that antiviral T cell responses in general are governed by comparable rules and mechanisms.
The LCMV-specific Responses Leave Scars in the Immune T Cell Repertoire.
Our analyses showed that LCMV NP118– 126-specific CD8+ T cells accounted for >10% of all splenic CD8+ T cells in immune mice (Fig. 7 A). Here again, the vast majority of these cells express Vβ10, Vβ8.1, or Vβ8.2. This is corroborated by our kinetic analysis, which shows an increase in Vβ10+CD8+ and Vβ8.1–8.2+ lymphocytes in the activated CD8 T cell population that remains after viral clearance. These 2.1 × 10⁵ NP118–126-specific Vβ10+CD8+ and 3.9 × 10⁵ Vβ8.1–8.2+CD8+ T cells are large permanent “immunological scars” in the TCR repertoire of the host, and reflect long-lasting NP118– 126-specific immunological memory (1). The systematic occurrence of these scars makes them a tracer of past LCMV infections in BALB/c mice. Studies performed both in humans (58) and in mice (59) have shown that aged individuals accumulate expanded mono- or oligoclonal CD8+ and CD4+ T cell populations. Such oligoclonal populations are especially seen among the CD8+ T cell subset. Our study provides a possible explanation for this phenomenon. Throughout the life of the individual, encounters with antigens leave long-lasting immunological scars. Systemic viral infections induce extensive CD8 T cell expansion in vivo, and often this is due to extensive division of a limited number of clones. The accumulation of such memory cell populations with restricted TCR usage would thus shape the T cell pools and result in highly biased TCR repertoires in aged individuals, reflecting their immunological history.
The LCMV-specific TCR Repertoire Is Conserved between Effectors and Memory Cells, Suggesting a Stochastic Selection of CD8+ Memory Cells from the T Cells Activated during Primary Infection.
Our study has shown that the TCR repertoire of LCMV-specific memory cells in immune mice was similar to that of the acute primary response based on staining with Ld-NP118–126 tetramers and Vβ antibodies. Also, functional variant peptide analysis showed that the fingerprints of NP118–126-specific Vβ10+CD8+, Vβ8.1–8.2+ CD8+, or total CD8+ T cell were almost identical in the primary response and in the memory pool, confirming that the compositions of these LCMV-specific lymphocyte populations were conserved. Since the response was highly reproducible from mouse to mouse, these conclusions can be made without longitudinal studies of individual mice over time. It is well established that the majority of activated CD8+ T cells undergo apoptosis, and only a small fraction of these lymphocytes survive to become memory cells (1). The selection processes that determine which T cells survive and which ones die are not fully understood. Our results show that this selection is not Vβ discriminant and probably occurs stochastically in a TCR-independent manner.
The vast majority (>90%) of activated T cells die after the viral infection has been resolved, i.e., under conditions of limiting antigen. It has been proposed that T cells with high affinity TCR would get an antigenic stimulus and survive, whereas the low affinity T cells would be unable to compete for this limiting antigen and would die due to lack of appropriate signaling through the TCR (49, 60). A prediction of this model is that the TCR usage of memory T cells would be different (i.e., narrower) from the antigen-specific T cells activated during the primary response. Our results do not support this model, and show that TCR usage does not play a role in determining which activated CD8+ lymphocytes undergo apoptosis and which ones survive to become memory T cells.
Our refined β chain CDR3 length analysis showed that the three dominant public responses (Vβ10, Vβ8.1, and Vβ8.2) detected in primary infections and maintained in the memory pool again expanded to comprise >70% of the secondary response upon rechallenge with LCMV. Also, the proportions of the minor NP118–126-specific CD8+ T cell responses (Vβ7, Vβ13, Vβ6, etc.) were similar between primary and secondary effectors. In addition, the functional fingerprints of secondary effector populations resembled that of the memory pool. This suggests that the vast majority of the memory T cell pool was recruited to clear these secondary infections. However, our analysis also detected slight alterations in the secondary response to LCMV. These were revealed by a stronger impact of inhibitory substitutions in the NP118–126 epitope on recognition by the Vβ10+ subset. The Vβ10+ response seemed slightly more specific of the NP118–126 wild-type sequence, suggesting that this subrepertoire might have become somewhat focused upon rechallenge. Previous studies have compared the TCR usage of primary and secondary T cell responses in various systems. Although some studies on CD8+ responses reported only limited changes (10, 32, 44), others found reduction of the TCR repertoire of CD4+ (9, 61) or CD8+ (49) responses leading to focusing of the antigen-specific T cell subset. One of these studies reported a maturation of the CD8+ response to one of the immunodominant epitopes in LCMV infection of C57BL/ 6 mice (49). In that study, immune mice were challenged with a low dose of the LCMV WE strain, which would lead to a much lower antigenic load than the highly invasive LCMV clone 13 strain we used. It is possible that the extent of antigenic exposure during secondary response plays a role in the recruitment of effectors from memory cells. In our system, secondary responses had practically the same magnitude as primary responses at their peak. The antigenic exposure was high, leading to a broad recruitment of T cells and a TCR repertoire similar to that of the memory pool. However, if the antigenic load upon reexposure is low, only a subset of memory T cells (high affinity/avidity ones) may participate in the secondary response. This hypothesis (62) links the magnitude of the secondary response to the antigen dose and the minimal antigen sensitivity of the recruited T cells. We have shown that the composition of the memory pool is similar to that of the primary effector population. Therefore, we predict that, more than the absolute size of the anamnestic response, it is the ratio of its magnitude to that of the primary response that determines the extent of recruitment among memory T cells. If the sizes of the primary and secondary responses are similar, it is likely that the TCR usage will be similar. The memory T cell pool is a scar in the TCR repertoire of the immune individual. Its composition is shaped both by the antigen and the magnitude of the response to immunization. Therefore, it carries not only the memory of the antigen but also the history of its encounter.
Acknowledgments
We thank Morry Hsu, Mary Kathryn Large, Kaja Madhavi Krishna, Joe Miller, and Tracey M. Waldem for technical assistance, and Suresh Marulasiddappa, Maryann Puglielli, and Rustom Antia for critical reading of the manuscript and stimulating discussions.
This work was supported by National Institutes of Health grants AI-30048 and NS-21496 (to R. Ahmed), by an American Cancer Society Institutional Research grant and the Winship Cancer Center of Emory University (to J.D. Altman). A.J. Zajac is supported by a fellowship from the Damon Runyon – Walter Winchell Foundation.
Abbreviations used in this paper
- C
constant
- D
diversity
- ELISPOT
enzyme-linked immunospot
- J
joining
- LCMV
lymphocytic choriomeningitis virus
- LDA
limiting dilution assay
- PCC
pigeon cytochrome C
- V
variable
Footnotes
C. Pannetier's current address is Laboratory of Immunology, National Institute of Allergies and Infectious Diseases, National Institutes of Health, Bethesda, MD 20892.
References
- 1.Ahmed R, Gray D. Immunological memory and protective immunity: understanding their relation. Science. 1996;272:54–60. doi: 10.1126/science.272.5258.54. [DOI] [PubMed] [Google Scholar]
- 2.Wilson RK, Lai E, Concannon P, Barth RK, Hood LE. Structure, organization and polymorphism of murine and human T-cell receptor alpha and beta chain gene families. Immunol Rev. 1988;101:149–172. doi: 10.1111/j.1600-065x.1988.tb00736.x. [DOI] [PubMed] [Google Scholar]
- 3.Davis MM. T cell receptor gene diversity and selection. Annu Rev Biochem. 1990;59:475–496. doi: 10.1146/annurev.bi.59.070190.002355. [DOI] [PubMed] [Google Scholar]
- 4.Goverman J, Minard K, Shastri N, Hunkapiller T, Hansburg D, Sercarz E, Hood L. Rearranged beta T cell receptor genes in a helper T cell clone specific for lysozyme: no correlation between V beta and MHC restriction. Cell. 1985;40:859–867. doi: 10.1016/0092-8674(85)90345-9. [DOI] [PubMed] [Google Scholar]
- 5.Goverman J, Hunkapiller T, Hood L. A speculative view of the multicomponent nature of T cell antigen recognition. Cell. 1986;45:475–484. doi: 10.1016/0092-8674(86)90279-5. [DOI] [PubMed] [Google Scholar]
- 6.Davis MM, Bjorkman PJ. T-cell antigen receptor genes and T-cell recognition. Nature. 1988;334:395–402. doi: 10.1038/334395a0. [DOI] [PubMed] [Google Scholar]
- 7.Garboczi DN, Ghosh P, Utz U, Fan QR, Biddison WE, Wiley DC. Structure of the complex between human T-cell receptor, viral peptide and HLA-A2. Nature. 1996;384:134–141. doi: 10.1038/384134a0. [DOI] [PubMed] [Google Scholar]
- 8.Pantaleo G, Demarest JF, Soudeyns H, Graziosi C, Denis F, Adelsberger JW, Borrow P, Saag MS, Shaw GM, Sekaly RP, et al. Major expansion of CD8+ T cells with a predominant V beta usage during the primary immune response to HIV. Nature. 1994;370:463–467. doi: 10.1038/370463a0. [DOI] [PubMed] [Google Scholar]
- 9.McHeyzer-Williams MG, Davis MM. Antigen-specific development of primary and memory T cells in vivo. Science. 1995;268:106–111. doi: 10.1126/science.7535476. [DOI] [PubMed] [Google Scholar]
- 10.Maryanski JL, Jongeneel CV, Bucher P, Casanova JL, Walker PR. Single-cell PCR analysis of TCR repertoires selected by antigen in vivo: a high magnitude CD8 response is comprised of very few clones. Immunity. 1996;4:47–55. doi: 10.1016/s1074-7613(00)80297-6. [DOI] [PubMed] [Google Scholar]
- 11.Moss PA, Moots RJ, Rosenberg WM, Rowland JS, Bodmer HC, McMichael AJ, Bell JI. Extensive conservation of alpha and beta chains of the human T-cell antigen receptor recognizing HLA-A2 and influenza A matrix peptide. Proc Natl Acad Sci USA. 1991;88:8987–8990. doi: 10.1073/pnas.88.20.8987. [DOI] [PMC free article] [PubMed] [Google Scholar]
- 12.Wills MR, Carmichael AJ, Mynard K, Jin X, Weekes MP, Plachter B, Sissons JG. The human cytotoxic T-lymphocyte (CTL) response to cytomegalovirus is dominated by structural protein pp65: frequency, specificity, and T-cell receptor usage of pp65-specific CTL. J Virol. 1996;70:7569–7579. doi: 10.1128/jvi.70.11.7569-7579.1996. [DOI] [PMC free article] [PubMed] [Google Scholar]
- 13.Kashii Y, Shimizu Y, Nambu S, Minemura M, Okada K, Higuchi K, Watanabe A. Analysis of T-cell receptor Vbeta repertoire in liver-infiltrating lymphocytes in chronic hepatitis C. J Hepatol. 1997;26:462–470. doi: 10.1016/s0168-8278(97)80408-4. [DOI] [PubMed] [Google Scholar]
- 14.Chen ZW, Yamamoto H, Watkins DI, Levinson G, Letvin NL. Predominant use of a T-cell receptor V beta gene family in simian immunodeficiency virus Gag-specific cytotoxic T lymphocytes in a rhesus monkey. J Virol. 1992;66:3913–3917. doi: 10.1128/jvi.66.6.3913-3917.1992. [DOI] [PMC free article] [PubMed] [Google Scholar]
- 15.Rodewald HR, Koszinowski UH, Eichmann K, Melchers I. Predominant utilization of V beta 8+ T cell receptor genes in the H-2Ld-restricted cytotoxic T cell response against the immediate-early protein pp89 of the murine cytomegalovirus. J Immunol. 1989;143:4238–4243. [PubMed] [Google Scholar]
- 16.Yanagi Y, Maekawa R, Cook T, Kanagawa O, Oldstone MB. Restricted V-segment usage in T-cell receptors from cytotoxic T lymphocytes specific for a major epitope of lymphocytic choriomeningitis virus. J Virol. 1990;64:5919–5926. doi: 10.1128/jvi.64.12.5919-5926.1990. [DOI] [PMC free article] [PubMed] [Google Scholar]
- 17.Aebischer T, Oehen S, Hengartner H. Preferential usage of V alpha 4 and V beta 10 T cell receptor genes by lymphocytic choriomeningitis virus glycoprotein-specific H-2Db-restricted cytotoxic T cells. Eur J Immunol. 1990;20:523–531. doi: 10.1002/eji.1830200310. [DOI] [PubMed] [Google Scholar]
- 18.Yanagi Y, Tishon A, Lewicki H, Cubitt BA, Oldstone MB. Diversity of T-cell receptors in virus-specific cytotoxic T lymphocytes recognizing three distinct viral epitopes restricted by a single major histocompatibility complex molecule. J Virol. 1992;66:2527–2531. doi: 10.1128/jvi.66.4.2527-2531.1992. [DOI] [PMC free article] [PubMed] [Google Scholar]
- 19.Deckhut AM, Allan W, McMickle A, Eichelberger M, Blackman MA, Doherty PC, Woodland DL. Prominent usage of V beta 8.3 T cells in the H-2Db-restricted response to an influenza A virus nucleoprotein epitope. J Immunol. 1993;151:2658–2666. [PubMed] [Google Scholar]
- 20.Cole GA, Hogg TL, Woodland DL. The MHC class I-restricted T cell response to Sendai virus infection in C57BL/6 mice: a single immunodominant epitope elicits an extremely diverse repertoire of T cells. Int Immunol. 1994;6:1767–1775. doi: 10.1093/intimm/6.11.1767. [DOI] [PubMed] [Google Scholar]
- 21.Horwitz MS, Yanagi Y, Oldstone MB. T-cell receptors from virus-specific cytotoxic T lymphocytes recognizing a single immunodominant nine-amino-acid viral epitope show marked diversity. J Virol. 1994;68:352–357. doi: 10.1128/jvi.68.1.352-357.1994. [DOI] [PMC free article] [PubMed] [Google Scholar]
- 22.Cose SC, Kelly JM, Carbone FR. Characterization of diverse primary herpes simplex virus type 1 gB-specific cytotoxic T-cell response showing a preferential V beta bias. J Virol. 1995;69:5849–5852. doi: 10.1128/jvi.69.9.5849-5852.1995. [DOI] [PMC free article] [PubMed] [Google Scholar]
- 23.Chen D, Lee F, Cebra JJ, Rubin DH. Predominant T-cell receptor Vbeta usage of intraepithelial lymphocytes during the immune response to enteric reovirus infection. J Virol. 1997;71:3431–3436. doi: 10.1128/jvi.71.5.3431-3436.1997. [DOI] [PMC free article] [PubMed] [Google Scholar]
- 24.Cose SC, Jones CM, Wallace ME, Heath WR, Carbone FR. Antigen-specific CD8+ T cell subset distribution in lymph nodes draining the site of herpes simplex virus infection. Eur J Immunol. 1997;27:2310–2316. doi: 10.1002/eji.1830270927. [DOI] [PubMed] [Google Scholar]
- 25.Murali-Krishna K, Altman JD, Suresh M, Sourdive DJD, Zajac AJ, Miller JD, Slansky J, Ahmed R. Counting antigen specific CD8 T cells: a re-evaluation of bystander activation during viral infection. Immunity. 1998;8:177–187. doi: 10.1016/s1074-7613(00)80470-7. [DOI] [PubMed] [Google Scholar]
- 26.Whitton JL, Tishon A, Lewicki H, Gebhard J, Cook T, Salvato M, Joly E, Oldstone MB. Molecular analyses of a five-amino-acid cytotoxic T-lymphocyte (CTL) epitope: an immunodominant region which induces nonreciprocal CTL cross-reactivity. J Virol. 1989;63:4303–4310. doi: 10.1128/jvi.63.10.4303-4310.1989. [DOI] [PMC free article] [PubMed] [Google Scholar]
- 27.Gammon G, Klotz J, Ando D, Sercarz EE. The T cell repertoire to a multideterminant antigen. Clonal heterogeneity of the T cell response, variation between syngeneic individuals, and in vitro selection of T cell specificities. J Immunol. 1990;144:1571–1577. [PubMed] [Google Scholar]
- 28.Mackensen A, Carcelain G, Viel S, Raynal MC, Michalaki H, Triebel F, Bosq J, Hercend T. Direct evidence to support the immunosurveillance concept in a human regressive melanoma. J Clin Invest. 1994;93:1397–1402. doi: 10.1172/JCI117116. [DOI] [PMC free article] [PubMed] [Google Scholar]
- 29.Shilyansky J, Nishimura MI, Yannelli JR, Kawakami Y, Jacknin LS, Charmley P, Rosenberg SA. T-cell receptor usage by melanoma-specific clonal and highly oligoclonal tumor-infiltrating lymphocyte lines. Proc Natl Acad Sci USA. 1994;91:2829–2833. doi: 10.1073/pnas.91.7.2829. [DOI] [PMC free article] [PubMed] [Google Scholar]
- 30.Cibotti R, Cabaniols JP, Pannetier C, Delarbre C, Vergnon I, Kanellopoulos JM, Kourilsky P. Public and private V beta T cell receptor repertoires against hen egg white lysozyme (HEL) in nontransgenic versus HEL transgenic mice. J Exp Med. 1994;180:861–872. doi: 10.1084/jem.180.3.861. [DOI] [PMC free article] [PubMed] [Google Scholar]
- 31.Lau LL, Jamieson BD, Somasundaram T, Ahmed R. Cytotoxic T-cell memory without antigen. Nature. 1994;369:648–652. [PubMed] [Google Scholar]
- 32.Vijh S, Pamer EG. Immunodominant and subdominant CTL responses to Listeria monocytogenesinfection. J Immunol. 1997;158:3366–3371. [PubMed] [Google Scholar]
- 33.Ahmed R, Salmi A, Butler LD, Chiller JM, Oldstone MB. Selection of genetic variants of lymphocytic choriomeningitis virus in spleens of persistently infected mice. Role in suppression of cytotoxic T lymphocyte response and viral persistence. J Exp Med. 1984;160:521–540. doi: 10.1084/jem.160.2.521. [DOI] [PMC free article] [PubMed] [Google Scholar]
- 34.Taguchi T, McGhee JR, Coffman RL, Beagley KW, Eldridge JH, Takatsu K, Kiyono H. Detection of individual mouse splenic T cells producing IFN-gamma and IL-5 using the enzyme-linked immunospot (ELISPOT) assay. J Immunol Methods. 1990;128:65–73. doi: 10.1016/0022-1759(90)90464-7. [DOI] [PubMed] [Google Scholar]
- 35.van der most, R.G., A. Sette, C. Oseroff, J. Alexander, K. Muralikrishna, L.L. Lau, S. Southwood, J. Sidney, R.W. Chesnut, M. Matloubian, and R. Ahmed. Analysis of cytotoxic T cell responses to dominant and subdominant epitopes during acute and chronic lymphocytic choriomeningitis virus infection. J Immunol. 1996;157:5543–5554. [PubMed] [Google Scholar]
- 36.van der Most R, Concepcion RJ, Oseroff C, Alexander J, Southwood S, Sidney J, Chesnut RW, Ahmed R, Sette A. Uncovering subdominant cytotoxic T-lymphocyte responses in lymphocytic choriomeningitis virus-infected BALB/c mice. J Virol. 1997;71:5110–5114. doi: 10.1128/jvi.71.7.5110-5114.1997. [DOI] [PMC free article] [PubMed] [Google Scholar]
- 37.Pannetier C, Cochet M, Darche S, Casrouge A, Zoller M, Kourilsky P. The sizes of the CDR3 hypervariable regions of the murine T-cell receptor beta chains vary as a function of the recombined germ-line segments. Proc Natl Acad Sci USA. 1993;90:4319–4323. doi: 10.1073/pnas.90.9.4319. [DOI] [PMC free article] [PubMed] [Google Scholar]
- 38.Pannetier, C., J.P. Levraud, A. Lim, J. Even, and P. Kourilsky. 1996. The Immunoscope approach for the analysis of T-cell repertoires. In The Human Antigen T-cell Receptor: Selected Protocols and Applications. J. Oksenberg, editor. R.G. Landes Company, Austin, TX. 162 pp.
- 39.Asano MS, Ahmed R. CD8 T cell memory in B cell–deficient mice. J Exp Med. 1996;183:2165–2174. doi: 10.1084/jem.183.5.2165. [DOI] [PMC free article] [PubMed] [Google Scholar]
- 40.Prevost BA, Chassin D, Zeliszewski D, Dorval I, Sterkers G, Pannetier C, Guillet JG. Preferential usage of the T-cell receptor by influenza virus hemagglutinin-specific human CD4+ T lymphocytes: in vitro life span of clonotypic T cells. J Virol. 1995;69:8046–8050. doi: 10.1128/jvi.69.12.8046-8050.1995. [DOI] [PMC free article] [PubMed] [Google Scholar]
- 41.Pannetier C, Even J, Kourilsky P. T-cell repertoire diversity and clonal expansions in normal and clinical samples. Immunol Today. 1995;16:176–181. doi: 10.1016/0167-5699(95)80117-0. [DOI] [PubMed] [Google Scholar]
- 42.Prevost BA, Ostankovitch M, Melle J, Pannetier C, Macintyre E, Dreyfus F, Guillet JG. CDR3 size analysis of T cell receptor V beta transcripts: follow-up study in a patient with T cell acute lymphoblastic leukemia. Leukemia (Basingstoke) 1995;9:1711–1717. [PubMed] [Google Scholar]
- 43.Wattel E, Vartanian JP, Pannetier C, Wain HS. Clonal expansion of human T-cell leukemia virus type I-infected cells in asymptomatic and symptomatic carriers without malignancy. J Virol. 1995;69:2863–2868. doi: 10.1128/jvi.69.5.2863-2868.1995. [DOI] [PMC free article] [PubMed] [Google Scholar]
- 44.Levraud JP, Pannetier C, Langlade DP, Brichard V, Kourilsky P. Recurrent T cell receptor rearrangements in the cytotoxic T lymphocyte response in vivo against the p815 murine tumor. J Exp Med. 1996;183:439–449. doi: 10.1084/jem.183.2.439. [DOI] [PMC free article] [PubMed] [Google Scholar]
- 45.Pannetier, C. 1996. Etude de la complexité et de la sélection par l'antigène du répertoire de lymphocytes T alpha-beta. Ph.D. thesis. Denis Diderot, Paris VII. 182 pp.
- 46.Altman JD, Moss P, Goulder P, Barouch DH, McHeyzer WM, Bell JI, McMichael AJ, Davis MM. Phenotypic analysis of antigen-specific T lymphocytes. Science. 1996;274:94–96. [PubMed] [Google Scholar]
- 47.Cunningham BC, Wells JA. High-resolution epitope mapping of hGH-receptor interactions by alanine-scanning mutagenesis. Science. 1989;244:1081–1085. doi: 10.1126/science.2471267. [DOI] [PubMed] [Google Scholar]
- 48.Bachmann MF, Oxenius A, Speiser DE, Mariathasan S, Hengartner H, Zinkernagel RM, Ohashi PS. Peptide-induced T cell receptor down-regulation on naive T cells predicts agonist/partial agonist properties and strictly correlates with T cell activation. Eur J Immunol. 1997;27:2195–2203. doi: 10.1002/eji.1830270912. [DOI] [PubMed] [Google Scholar]
- 49.Bachmann MF, Speiser DE, Ohashi PS. Functional maturation of an antiviral cytotoxic T-cell response. J Virol. 1997;71:5764–5768. doi: 10.1128/jvi.71.8.5764-5768.1997. [DOI] [PMC free article] [PubMed] [Google Scholar]
- 50.Casanova JL, Cerottini JC, Matthes M, Necker A, Gournier H, Barra C, Widmann C, MacDonald HR, Lemonnier F, Malissen B, et al. H-2–restricted cytolytic T lymphocytes specific for HLA display T cell receptors of limited diversity. J Exp Med. 1992;176:439–447. doi: 10.1084/jem.176.2.439. [DOI] [PMC free article] [PubMed] [Google Scholar]
- 51.Puisieux I, Even J, Pannetier C, Jotereau F, Favrot M, Kourilsky P. Oligoclonality of tumor-infiltrating lymphocytes from human melanomas. J Immunol. 1994;153:2807–2818. [PubMed] [Google Scholar]
- 52.Taylor AH, Haberman AM, Gerhard W, Caton AJ. Structure–function relationships among highly diverse T cells that recognize a determinant from influenza virus hemagglutinin. J Exp Med. 1990;172:1643–1651. doi: 10.1084/jem.172.6.1643. [DOI] [PMC free article] [PubMed] [Google Scholar]
- 53.Argaet VP, Schmidt CW, Burrows SR, Silins SL, Kurilla MG, Doolan DL, Suhrbier A, Moss DJ, Kieff E, Suclley TB, et al. Dominant selection of an invariant T cell antigen receptor in response to persistent infection by Epstein-Barr virus. J Exp Med. 1994;180:2335–2340. doi: 10.1084/jem.180.6.2335. [DOI] [PMC free article] [PubMed] [Google Scholar]
- 54.Callan MF, Steven N, Krausa P, Wilson JD, Moss PA, Gillespie GM, Bell JI, Rickinson AB, McMichael AJ. Large clonal expansions of CD8+ T cells in acute infectious mononucleosis. Nat Med. 1996;2:906–911. doi: 10.1038/nm0896-906. [DOI] [PubMed] [Google Scholar]
- 55.Silins SL, Cross SM, Elliott SL, Pye SJ, Burrows SR, Burrows JM, Moss DJ, Argaet VP, Misko IS. Development of Epstein-Barr virus–specific memory T cell receptor clonotypes in acute infectious mononucleosis. J Exp Med. 1996;184:1815–1824. doi: 10.1084/jem.184.5.1815. [DOI] [PMC free article] [PubMed] [Google Scholar]
- 56.Turner SJ, Cose SC, Carbone FR. TCR alpha-chain usage can determine antigen-selected TCR beta-chain repertoire diversity. J Immunol. 1996;157:4979–4985. [PubMed] [Google Scholar]
- 57.Pham BN, Degos F, Mosnier JF, Ollivier S, Sauvanet A, Erlinger S, Cohen JH. Restriction of V beta gene usage of liver-derived lymphocytes in chronic hepatitis B and C. Hum Immunol. 1996;49:56–63. doi: 10.1016/0198-8859(96)00053-5. [DOI] [PubMed] [Google Scholar]
- 58.Schwab R, Szabo P, Manavalan JS, Weksler ME, Posnett DN, Pannetier C, Kourilsky P, Even J. Expanded CD4+ and CD8+ T cell clones in elderly humans. J Immunol. 1997;158:4493–4499. [PubMed] [Google Scholar]
- 59.Callahan JE, Kappler JW, Marrack P. Unexpected expansions of CD8-bearing cells in old mice. J Immunol. 1993;151:6657–6669. [PubMed] [Google Scholar]
- 60.Zinkernagel RM, Bachmann MF, Kundig TM, Oehen S, Pirchet H, Hengartner H. On immunological memory. Annu Rev Immunol. 1996;14:333–367. doi: 10.1146/annurev.immunol.14.1.333. [DOI] [PubMed] [Google Scholar]
- 61.Zheng B, Han S, Kelsoe G. T helper cells in murine germinal centers are antigen-specific emigrants that downregulate Thy-1. J Exp Med. 1996;184:1083–1091. doi: 10.1084/jem.184.3.1083. [DOI] [PMC free article] [PubMed] [Google Scholar]
- 62.Alexander-Miller MA, Leggatt GR, Berzofsky JA. Selective expansion of high- or low-avidity cytotoxic T lymphocytes and efficacy for adoptive immunotherapy. Proc Natl Acad Sci USA. 1996;93:4102–4107. doi: 10.1073/pnas.93.9.4102. [DOI] [PMC free article] [PubMed] [Google Scholar]


