Abstract
Here, we report that interruption of NGF or BDNF signaling in hippocampal neurons rapidly activates the amyloidogenic pathway and causes neuronal apoptotic death. These events are associated with an early intracellular accumulation of PS1 N-terminal catalytic subunits and of APP C-terminal fragments and a progressive accumulation of intra- and extracellular Aβ aggregates partly released into the culture medium. The released pool of Aβ induces an increase of APP and PS1 holoprotein levels, creating a feed-forward toxic loop that might also cause the death of healthy neurons. These events are mimicked by exogenously added Aβ and are prevented by exposure to β- and γ-secretase inhibitors and by antibodies directed against Aβ peptides. The same cultured neurons deprived of serum die, but APP and PS1 overexpression does not occur, Aβ production is undetectable, and cell death is not inhibited by anti-Aβ antibodies, suggesting that hippocampal amyloidogenesis is not a simple consequence of an apoptotic trigger but is due to interruption of neurotrophic signaling.
Keywords: Alzheimer disease, apoptosis, APP, neurotrophin
Although the molecular events that occur in Alzheimer disease (AD) have, to a large extent, been explained, little is known about what triggers these events. For instance, although it is well established that altered posttranslational modifications of tau protein and amyloid precursor protein (APP) processing constitute the molecular basis of the onset of this disease, very little is known about what causes this altered processing. Indeed, a better understanding of this issue could open therapeutic avenues for the prevention and treatment of this neurodegenerative disease.
Hippocampal neurons are among the most severely affected cells in AD (1). BDNF and NGF carry out a variety of actions on these neurons and are involved in the clinical and pathophysiological signs of AD (2, 3). In AD, a reduction in neurotrophin levels occurs in some areas of the CNS, and neurotrophic factors have begun to be used in clinical trials to prevent or to reduce neuronal cell loss (4) or to improve hippocampal neurogenesis in adult and aged male rats (5). In a previous study of NGF-differentiated PC12 cells, we reported a close correlation between NGF deprivation and activation of the amyloidogenic route (6), thus broadening to this clonal line the link between amyloidogenesis and cell death formerly reported in cultured cerebellar granule cells (7, 8). Although this clonal cell line has contributed to elucidating a large number of neuronal properties, because of its clonal neoplastic origin, it might not provide information specifically connected to the pathological events actually occurring in the neurons of the adult brain. Therefore, to clarify the molecular events found in NGF-differentiated PC12 cells, we resorted to primary hippocampal neurons and also tried to assess whether another neurotrophin, such as BDNF, shares the same antiamyloidogenic activity previously found with NGF.
In the present study, we confirm and largely extend findings obtained in NGF-differentiated PC12 cells demonstrating that interruption of the NGF (or BDNF) signal induces death through an intra- and extracellular accumulation of Aβ aggregates and activation of a feed-forward toxic loop that also causes the death of healthy neurons. These events are associated with the formation of varicosities along neurites and with an accumulation of APP C-terminal fragments in neurons undergoing death. Furthermore, Aβ peptides released in medium induce an increase of APP and PS1 holoprotein levels, and all these events are prevented by γ- and β-secretase inhibitors or by antibody directed against Aβ peptides and mimicked by exogenously added Aβ 1-42 peptides. Similar effects do not occur when the same hippocampal cultures are induced to apoptotic death by serum deprivation.
These data suggest that whenever the neurotrophin signal is interrupted, the amyloidogenic route is activated and that these events may be a cause of Alzheimer disease.
Results
Hippocampal Neurons Deprived of NGF Die and Release Aβ.
We reported that removal of NGF from the clonal cell line PC12, previously differentiated with this neurotrophin, induced activation of the amyloidogenic route with consequent intracellular accumulation of Aβ, its partial release into the culture medium, and onset of death via apoptosis (6). To assess whether analogous events also occur in the neuronal population most affected by AD, we carried out a similar set of experiments on rat hippocampal cultures.
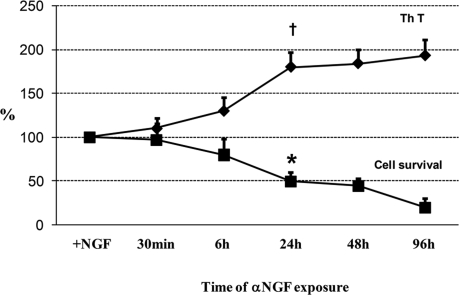
Previous studies performed on hippocampal neurons reported that neuronal TrkA levels increased from day 1 through day 4 in culture and that, compared with the initial expression levels, a remarkable decline occurred from day 7 through day 14 (9). To obtain the highest response to NGF exposure, hippocampal neurons plated for 3–4 days in Neurobasal plus B27 medium were incubated with NGF (50 ng/ml) for 48 h (+NGF) and then deprived of this neurotrophin by using a monoclonal antibody directed against NGF (see Methods). As shown in Fig. 1), under these conditions, neurons started dying 24 h after NGF removal, and at 48 h, 50% were no longer viable. This progressive cell death reached ≈80% at 96 h, indicating that nontarget neurons, which accounted for ≈50% (10) had also died. During the same period, a progressive release of thioflavine-binding proteins into the culture medium occurred, reaching a twofold increase. Simultaneous addition of NGF (50 ng/ml) to cultures containing NGF antibodies almost totally reversed cell death and restored cell viability (Table 1, indicating that, as expected, the action of NGF antibodies was directed against this neurotrophin. It is worth mentioning that after the 48 h of NGF incubation (+NGF), hippocampal neurons survived to an extent similar to that detectable in basal medium conditions (−NGF). This finding indicates that the 48 h of NGF incubation did not cause a selection of NGF-dependent neurons but led to dependence on, or priming by, this neurotrophin. Hippocampal neurons cultured for 6 days in the absence of NGF (−NGF) and subsequently exposed to the anti-NGF antibody for 48 h (+αNGF) did not die (−NGF: 100; αNGF: 91 ± 18) and did not release β-sheet structures in culture medium (−NGF: 100; αNGF: 113 ± 22). Moreover, serum withdrawal from cultures induced neuronal death, but Aβ release was not detectable under this condition (see Fig. 6). These findings indicate that preincubation of cultures with NGF is an essential condition for their subsequent response to NGF removal, leading to amyloidogenesis, and that death induced by serum deprivation does not cause the same neuronal response.
Fig. 1.
The effect of NGF deprivation on cell survival and ThT binding protein release in hippocampal neurons. Neurons cultured for 3–4 days were exposed to NGF (50 ng/ml) for 48 h and then deprived of the same neurotrophin by rinsing the medium, washing three times and adding anti-NGF antibody (MAb anti-NGF, 30 μg/ml) for a time ranging from 30 min to 96 h. Cell viability was evaluated by counting intact nuclei. See also Table 1.
Table 1.
Time of α NGF exposure
The addition of NGF (50 ng/ml) (α NGF+NGF) largely reverses the effect of 48 h of anti-NGF antibody (α NGF) on both cell viability and ThT-binding protein release. Each data point is the mean ± SE of triplicate determinations of 12 independent experiments and is expressed as percentage of control values (+NGF).
*, P < 0.05 versus intact nuclei values;
†, P < 0.05 versus ThT values of +NGF samples;
‡, P < 0.05 versus intact nuclei values;
§, P < 0.05 versus ThT values of αNGF samples.
Fig. 6.
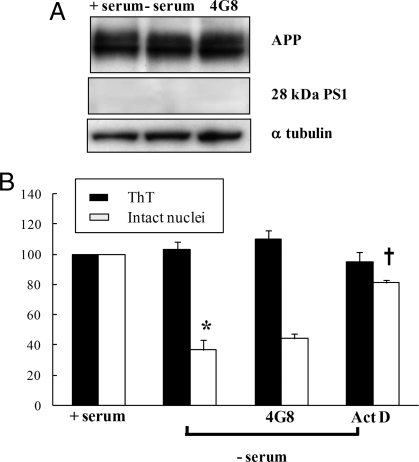
Serum deprivation induces neuronal death which is not associated to activation of amyloidogenic pathway. (A) Western blot analysis of APP and PS1 N-terminal levels from whole lysates from hippocampal neurons cultured in the presence of serum for 6–7 days or deprived of serum and incubated with or without anti-Aβ antibody (4G8, 1 μg/ml) for 48 h. All values reported in the corresponding Table 6 are expressed as percentage of control values (+serum) and normalized on the basis of α-tubulin values. Data represent the mean ± SE (bars) of four independent experiments. (B) ThT and cell death analysis assessed by counting intact nuclei from neurons deprived of serum (−serum) in the presence or absence of anti-Aβ antibodies (+4G8) or with Actinomicin D (Act D, 1 μg/ml). Each data point is the mean ± SE of triplicate determinations of four independent experiments and is expressed as percentage of control values (+serum). *, P < 0.05 versus intact nuclei values of samples incubated with serum; †, P < 0.05 versus intact nuclei values of samples incubated with actinomicin D.
Interruption of the NGF Signal Activates a Toxic Loop.
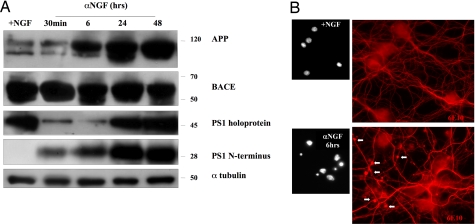
To evaluate whether Aβ release and death were associated with an increase of APP, PS1, and BACE protein expression, we performed Western blot analysis of hippocampal neuronal cultures deprived of NGF (αNGF) for times ranging from 30 min to 48 h. Fig. 2 and Table 2 show that APP protein levels increased after 6 h, reaching a peak 24 h later. Note that a similar trend was observed with the 28-kDa PS1 N terminus (which is the active component endowed with γ-secretase activity), whereas its precursor exhibited a double pattern: Between 30 min and 6 h, it was markedly reduced compared with controls, but at longer times after NGF removal, its concentration reached values similar to those at time 0. Such oscillation is probably due to the cleavage of the preexisting PS1 holoprotein into its 28-kDa active form, whereas in subsequent times, a process of neosynthesis and/or accumulation occurred. At variance with APP and PS1 N terminus, BACE did not show any significant change, and its contribution to amyloidogenesis was probably the simple consequence of an enzymatic activation, as indirectly indicated by the finding that BACE inhibitors are effective in reducing both cell death and ThT binding release (see Fig. 4B).
Fig. 2.
The interruption of NGF signal activates amyloidogenesis. (A) Western blot analysis performed with antibodies against APP, BACE, and PS1 (see Methods) of lysates from hippocampal neurons of controls (+NGF) or of neurons exposed to anti-NGF antibodies (αNGF) in a time ranging from 30 min to 48 h. See Table 2 for the corresponding optical density analysis. (B) (Right) Immunofluorescence analysis performed with anti-Aβ antibody against amino acid residues 1–17 (MAb 6E10). Arrows mark varicosities forming along neurites after 6 h of NGF removal. (Left) Hoechst staining of nuclei.
Table 2.
Optical density analysis corresponding to Fig. 2
| OD (% of +NGF) | +NGF | α NGF (30 min) | α NGF (6 h) | α NGF (24 h) | α NGF (48 h) |
|---|---|---|---|---|---|
| APP | 100 | 113 ± 21 | 147 ± 12* | 233 ± 32* | 283 ± 24* |
| BACE | 100 | 103 ± 32 | 113 ± 21 | 119 ± 13 | 99 ± 12 |
| PS1 (45 kDa) | 100 | 33 ± 9.1* | 38 ± 9.5* | 113 ± 18† | 131 ± 17† |
| PS1 (28 kDa) | 100 | 207 ± 21* | 287 ± 29* | 309 ± 22† | 367 ± 35† |
All samples were expressed as percentage of control cells (+NGF) and normalized on the basis of the correspondent α-tubulin values. Each data point is the mean ± SE of four independent experiments and is expressed as percentage of control values (+NGF).
*, P < 0.05 versus corresponding control value (+NGF);
†, P < 0.05 versus corresponding to α NGF value.
Fig. 4.
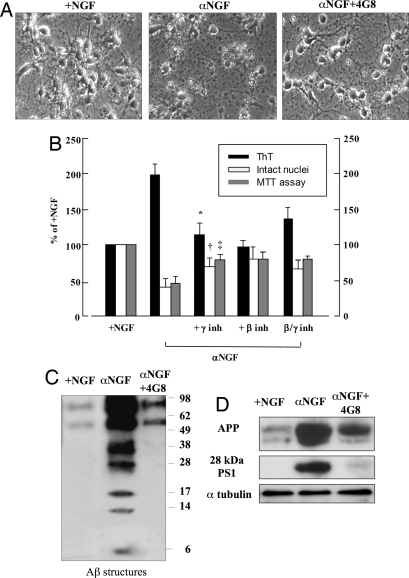
The exposure to secretase inhibitors or to antiamyloid antibody prevents amyloidogenesis and protects neurons from death. (A) Micrographs of phase-contrast microscopy of hippocampal neurons after 48 h of anti-NGF antibody exposure (αNGF) in the presence (αNGF+4G8) or absence of anti-Aβ antibody, MAb 4G8. See also Table 3. (B) ThT-binding protein assay (black bars), the number of intact nuclei (white bars) and the MTT analysis (gray bars) of hippocampal neurons incubated with anti-NGF antibodies alone (αNGF, 30 μg/ml) or in the presence of β- (250 ng/ml) or γ- (50 ng/ml) secretase inhibitors for 48 h. Each data point is the mean ± SE of triplicate determinations of 12 independent experiments and is expressed as the percentage of control values (+NGF). *, P < 0.05 versus ThT values; †, P < 0.05 versus intact nuclei values; ‡, P < 0.05 versus MTT values of anti-NGF samples (αNGF). (C and D) Western blot analysis performed with anti-Aβ antibody (MAb 4G8), anti-APP N-terminal residues (MAb 22C11), and anti-PS1 N-terminal domain (see Methods) of whole cellular lysates from hippocampal neurons exposed to anti-NGF antibody for 48 h (αNGF) with or without MAb 4G8, (αNGF+ 4G8). After stripping, the same PVDF membranes were incubated with a MAb against α-tubulin as a control of protein loading. See Table 4 for corresponding optical density values.
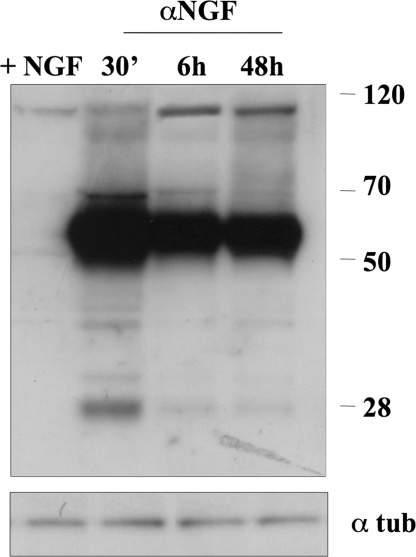
Furthermore, 6 h after NGF removal, hippocampal neurons showed small varicosities along neurites probably constituted by Aβ peptides and detected by using MAb 6E10, an antibody directed against APP N-terminal domain (Fig. 2B). Note also that Western blot analysis performed on cellular lysates with anti-APP C-terminal antibody showed an increase of APP processing already 30 min after NGF removal (Fig. 3).
Fig. 3.
Western blot analysis performed with APP C-terminal antibody of lysates from hippocampal neurons of controls (+NGF) or of neurons exposed to anti-NGF antibodies (αNGF) in a time ranging from 30 min to 48 h.
Aβ Antibodies Rescue Neurons from Cell Death Induced by NGF Removal.
To evaluate whether Aβ inhibition by anti-Aβ antibodies protects cells from death due to NGF removal, hippocampal primary cultures deprived of NGF were incubated with anti-Aβ antibody MAb 4G8 (1 μg/ml), and MTT analysis and intact nuclei measurements were performed after 48 h, when neuronal death had reached a peak. As shown in Fig. 4, a significant increase in cell viability (evaluated by counting intact nuclei and by MTT assay) occurred, and release of β-sheet structures was reduced to the same extent (Table 3). The protective action exerted by MAb 4G8 is also evidenced by a morphological analysis (Fig. 4A) showing almost full protection from both neurites and neuronal perikarja.
Table 3.
Values of intact nuclei corresponding to Fig. 4A
| Assay | +NGF | α NGF | α NGF+4G8 |
|---|---|---|---|
| Intact nuclei | 41 ± 2.3 | 16 ± 1.4 | 31 ± 7.2* |
| MTT | 100 | 50 ± 4.7 | 90 ± 9.6† |
| ThT | 100 | 180 ± 34.1 | 110 ± 19.3† |
Data are expressed as the mean of four different fields of five independent experiments of MTT and ThT assay.
*, P < 0.05 versus control cells (+NGF);
†, P < 0.05 versus samples incubated with anti-NGF antibody (α NGF).
The protective action exerted by MAb 4G8 was probably achieved by binding and sequestration of Aβ peptides released during the progression of apoptosis or bound to cellular membranes. Western blot analysis performed with MAb 4G8, which recognizes Aβ residues 17–24, demonstrated that interruption of the neurotrophin signal induced accumulation of a large amount of N-terminal Aβ peptides that was prevented by concomitant incubation with anti-Aβ antibody (Fig. 4C). These Aβ peptides, which were probably bound to neuronal membranes, appeared largely aggregated, as shown by the presence of a pool of Aβ structures of different sizes (Fig. 4C). Note that this accumulation correlated with progressive intracellular APP processing detected with APP C-terminal antibody (Fig. 3).
Moreover, as shown in Fig. 4D and Table 4, MAb 4G8 markedly reduced not only the amount of Aβ but also APP and PS N-terminal subunit expression; further, β- and γ-secretase inhibitors exerted an effect similar to that obtained with MAb 4G8 when Aβ release and cell death were measured (Fig. 4B).
Table 4.
Optical density values corresponding to Fig. 4D
| OD (% of +NGF) | +NGF | α NGF | α NGF+4G8 (48 h) |
|---|---|---|---|
| APP | 100 | 283 ± 24* | 143 ± 11† |
| PS1 (28 kDa) | 100 | 467 ± 45* | 192 ± 23† |
Data represent the mean ± SE of five independent experiments.
*, P < 0.05 versus control cells (+NGF);
†, P < 0.05 versus samples incubated with anti-NGF antibody (α NGF).
Table 5.
Optical density analysis corresponding to Fig. 5
All values are expressed as percentage of control values (+NGF) and normalized on the basis of α-tubulin. Note that Aβ 1-42 induces APP and PS1 N-terminal changes similar to those obtained with anti-NGF antibodies. Data represent the mean ± SE of four independent experiments.
*, P < 0.05 versus control cells (+NGF).
Table 6.
APP and PS1 N-terminal levels from whole lysates from hippocampal neurons cultured with (+) and without (−) serum
| OD (% +serum) | +Serum | −Serum | 4G8 |
|---|---|---|---|
| APP | 100 | 118 ± 43 | 117 ± 30 |
| PS1 | 100 | 101 ± 32 | 110 ± 17 |
All values are expressed as percentage of control values (+serum) and normalized on the basis of α-tubulin values. Data represent the mean ± SE of four independent experiments.
Taken together, these results suggest a mechanism through which increased Aβ peptides activate APP and PS1 expression and in turn affect the physiological processing of APP, causing a feed-forward mechanism (see also Fig. 1) leading to neuronal death.
Synthetic Externally Added Aβ Induces Cellular Aβ Release.
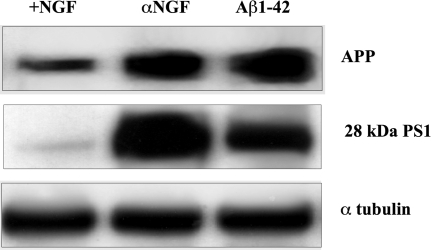
To investigate further the relationship between Aβ and neurotrophin pathways, hippocampal neurons were treated with 20 μM soluble Aβ 1-42, and APP and PS1 were subsequently measured in an experimental set identical to that used previously. As can be seen in Fig. 5, similar to what occurred in hippocampal neurons deprived of NGF, Aβ 1-42 induced death in 60% of the neuronal population after 48-h exposure, and APP and PS1 levels increased to an extent comparable with that observed in NGF-deprived neurons. Altogether, these data indicate a tight loop between increased APP and secretase level/activity, Aβ production, and onset of apoptotic death.
Fig. 5.
Western blot analysis of whole lysates from hippocampal neurons of controls (+NGF) or incubated with anti-NGF antibodies (αNGF, 30 μg/ml) or with Aβ 1-42 (Aβ 1-42, 20 μM) for 48 h. The corresponding optical density analysis is shown in Table 5.
Serum Deprivation Causes Death of Hippocampal Neurons Which Is Not Accompanied or Mediated by Aβ Production.
To verify whether an apoptotic insult, such as 48 h of serum deprivation, could also induce effects similar to those observed in NGF-deprived cultures, hippocampal neurons cultured for 6–7 days in BMI medium plus 10% horse serum were deprived of it in the presence or absence of the 4G8 anti-Aβ antibody. After 48 h of serum deprivation, 60% of the neuronal cells died (−serum 39 ± 6.66, Fig. 6), but the amount of APP and the extent of thioflavin binding were unchanged. Moreover, MAb 4G8 failed to protect cells from death (41.33 ± 3.28), whereas actinomicin D, an inhibitor of nucleic acid synthesis used as an antiapoptotic agent (12), significantly blocked cell death (80 ± 3.4) (Fig. 6). Altogether, these findings show that activation of amyloidogenesis is not a simple consequence of an apoptotic trigger, but is confined to interference or interruption of neurotrophin signal (see below).
NGF and BDNF Share Common Antiamyloidogenic Activities.
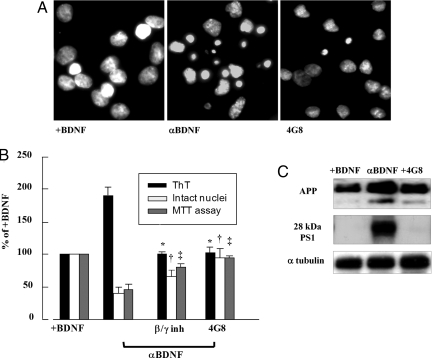
BDNF has also been implicated in AD. Both BDNF mRNA and protein levels have been shown to be reduced in AD hippocampus and temporal cortex (3, 13). To determine whether BDNF removal from media would activate the amyloidogenic route, as previously shown for NGF, hippocampal neurons were incubated with BDNF for 48 h; this neurotrophin was subsequently removed from culture medium by using a specific monoclonal antibody (αBDNF, 30 μg/ml). Cell death peaked 48 h after neurotrophin removal, when, as shown in Fig. 7B, almost 50% of the neuronal population died. As previously shown for NGF, cell death after BDNF deprivation was accompanied by the same amount of Aβ production and cell death as observed for NGF (Fig. 7B) evaluated both by MTT assay and intact nuclei counting. Aβ production induced by BDNF deprivation was reduced by anti-Aβ and β- and γ-secretase inhibitors and was associated with increased APP and PS1 levels (Fig. 7C and Table 7).
Fig. 7.
BDNF deprivation activates amyloidogenesis. (A) Micrographs of Hoechst 33258-stained hippocampal neurons 48 h after incubation with antibodies against BDNF(αBDNF) in the presence or absence of anti-Aβ antibody, MAb 4G8 (4G8). (B) The histograms report the ThT-binding protein analysis (black bars), the evaluation of intact nuclei (white bars), and the MTT analysis (gray bars). Each data point is the mean ± SE of triplicate determinations of eight independent experiments and is expressed as percentage of control values (+BDNF). *, P < 0.05 versus ThT values; †, P < 0.05 versus intact nuclei values; ‡, P < 0.05 versus MTT values of samples incubated with anti-BDNF antibody (αBDNF). (C) Western blot analysis of APP and 28-kDa N-terminal PS1 fragment of hippocampal neurons exposed for 48 h to BDNF and subsequently incubated with an anti-BDNF antibody (αBDNF) in the presence or absence of anti-Aβ antibody MAb 4G8. See Table 7 for the corresponding optical density.
Table 7.
The optical density of the Western blot analysis in Fig. 7C
Data are expressed as percentage of control cells (+BDNF) and normalized on the basis of the corresponding α-tubulin values. Data represent the mean ± SE of four independent experiments.
§, P < 0.05 versus +BDNF;
¶, P < 0.05 versus αBDNF.
These results show that when BDNF or NGF signaling is discontinued, the amyloidogenic route is activated and involves its major actors, namely, APP, PS1, and Aβ levels.
Discussion
Neuronal cell death resulting from interruption of neurotrophic factor signaling is commonly observed during neuronal development and is hypothesized to be related to the onset of AD (1, 3). Neurons that fail to obtain a sufficient quantity of the neurotrophic factor die by a process of programmed cell death (14), and mice that produce (15) or are exposed to the anti-NGF antibody (10, 16) display extensive neuronal loss throughout the cortex and hippocampus and a cholinergic deficit in the basal forebrain. Furthermore, deficient trophic support contributes significantly to a neurodegenerative phenotype (17) because of failure of retrograde transport of the NGF signal, and this has been associated with an overexpression (18) and an abnormal processing of APP (19).
The data reported here show that hippocampal neurons exposed to NGF or BDNF for 48 h and subsequently deprived of the same neurotrophin by anti-NGF (or -BDNF) antibodies undergo (i) intracellular accumulation of the PS1 N terminus catalytic subunit and of APP C-terminal fragments; (ii) increased production of Aβ aggregates; (iii) progressive release of Aβ into culture medium, which could cause (as will be discussed later) death also in an NGF-non-responsive neuronal subpopulation. These events are mimicked by exogenously added Aβ or by BDNF removal and are prevented by β- and γ-secretase inhibitors or by an antibody directed against Aβ peptides.
The finding that neurons become partially responsive to subsequent NGF deprivation only after exposure to this neurotrophin suggests that during this period a priming or conditioning occurs, so that neurons become sensitive to subsequent neurotrophin deprivation. The intracellular pathway subserving this process (or processes) is under investigation and points out that an analogous dependence may become operative also in vivo
One intriguing finding was that 96 h after NGF removal, 80% of the hippocampal neurons were no longer viable. Because the whole population of NGF target neurons probably accounted for no more than 40–50% (10), we can conclude that in a long range of 96 h, part of the NGF nontarget neuronal population also died. The simplest explanation is that this higher percentage of death was due to the release of Aβ peptides, which acted on the whole neuronal population. Moreover, it should be noted that exposure to anti-Aβ antibodies not only prevents neuronal death but greatly reduces intracellular APP and PS1 N-terminal fragment accumulation and largely inhibits APP processing. Thus, in this culture system, the trigger of the amyloidogenic pathway seems to become a feed-forward toxic loop that could also spread to NGF (and presumably BDNF) nontarget neurons. This conclusion is also demonstrated by evidence that externally added Aβ 1-42 induces the same events reported in neurons deprived of NGF, causing activation of amyloidogenesis concomitantly with neuronal death.
Moreover, evidence that withdrawal of NGF (or BDNF) is accompanied by cell death and that this event is almost totally blocked by inhibition with anti-Aβ antibodies and γ- and β-secretase inhibitors suggests a tight causal link whereby overproduction of Aβ and its intracellular and extracellular accumulation appears to be the cause of neuronal death. The fact that these events are tightly linked to neurotrophin deprivation and are not the consequence of an aspecific apoptotic insult is demonstrated by the finding that, although apoptosis caused by 48 h of serum deprivation was accompanied by marked cell loss, it was not associated with a relevant increase of Aβ release and was not inhibited by Aβ antibodies; furthermore, APP and Aβ protein levels were not affected, and the PS1 amount was unchanged
Several pieces of evidence suggest that p75 receptors have a role in mediating Aβ toxicity. It has been reported that the p75NTR receptor can cause apoptosis even in the absence of NGF (20) through an as yet unclear mechanism involving a cell death domain. Therefore, it is reasonable to assume that p75 plays a crucial role in the chain of death events that occur after neurtrophin deprivation, probably first by promoting the processing of APP and Aβ production and subsequently by expanding the death signal via a direct Aβ binding (21).
The possibility of establishing a correlation between interruption of the neurotrophin signal and activation of the amyloidogenic route could be of help in clarifying some important aspects of Alzheimer disease, with special emphasis on the hippocampus, which is the cerebral structure most involved in this pathology.
Methods
Cell Cultures.
Hippocampal neurons were prepared from embryonic day 17–18 (E17/E18) embryos from timed pregnant Wistar rats (Charles River), as reported (9). The hippocampus was dissected out in Hanks' balanced salt solution buffered with Hepes and dissociated via trypsin/EDTA treatment. Cells were plated at 1 × 10⁶ cells on 3.5-cm dishes precoated with poly-dl-lysine. After 2 days of culturing in neurobasal medium with B-27 supplement and glutamax, cytosine arabinofuranoside was added to reduce glial proliferation. Half of the medium was changed every 3–4 days. All experimental treatments were performed on 6- to 7-day-old cultures in Neurobasal+ B27 medium to avoid serum interference in Th-T assay. Neurons were exposed to NGF or BDNF (50 ng/ml) for 48 h at 3–4 days after plating, and subsequently the medium was rinsed and cultures were washed three times with neurotrophin-free medium and then incubated for another 48 h in the same medium also containing substances or antibody to be tested.
For serum-deprivation experiments, hippocampal neurons cultured for 6 days in BMI culture medium plus 10% inactivated FBS (Gibco, Invitrogen) were washed three times and incubated in a serum free of BMI medium for some time. The percentage of apoptotic neurons was 60% after 48 h of serum deprivation and increased slightly thereafter. To investigate whether serum deprivation causes death also via necrosis, we measured LDH levels in media and found that at 48 h, no LDH release had occurred.
TrKA and TrKB Detection and Other Cell Culture Manipulations.
The presence of the active (pTrKA) receptor in hippocampal neurons incubated with (+NGF) or without NGF (−NGF) for 48 h was verified by Western blot analysis using selective anti-popsho TrKA antibody kindly provided by M. Chao (New York University, New York) (22). To assess the specificity of this phosphorylation, the same membrane was also incubated after stripping with anti-pospho (pTrKB) antibody and with an antibody recognizing total basal TrK levels [see supporting information (SI) Fig. S1]. Treatment with anti-NGF (MAb NGF, 30 μg/ml, MAb BDNF, 30 μg/ml; Novus) and anti-Aβ antibody (MAb 4G8 1 μg/ml; Signet) with actinomicin D (1 μg/ml; Sigma) and with γ-secretase (50 nM L-685,458; Calbiochem) or 240 nM β-secretase (MBL) inhibitors was carried out by incubating neurons with or without neurotrophins for 48 h. The highest nontoxic concentration of each drug was preliminarily tested in control neurons in the presence or absence of neurotrophins. The specificity of anti-NGF and anti-BDNF antibodies was tested against the corresponding peptide by Western blot analysis (see Fig. S2). Experiments were also performed routinely by using serum polyclonal anti-NGF provided by D. Mercanti (CNR-INMM, Rome) at concentrations of 10 μg/ml.
Aβ 1-42 treatment was performed by exposing hippocampal neurons to various concentrations of soluble Aβ1-42 peptide for different times. A 1 mM stock solution was obtained by dissolving Aβ1-42 in DMSO and distilled water (vol/vol); similar amounts of DMSO were incubated in the control sample medium. To overlap the extent of death induced by neurotrophin deprivation with that of the Aβ 1-42 peptide, all experiments were carried out by incubating cultures with 20 μM Aβ 1-42 for 48 h.
Cell Viability.
Viable hippocampal neurons were quantified by using the MTT tetrazolium salt assay (23) and by counting the number of intact nuclei (24).
Immunocytochemistry.
Hippocampal neurons were fixed for 20 min in PBS containing 4% formaldehyde and 4% sucrose, permeabilized with 0.1% Triton X-100 (20 min, 20°C), and processed for labeling with monoclonal anti-Aβ, MAb 6E10. Nuclei were visualized by staining with Hoechst dye 33258 (1 μg/ml) (Sigma). Secondary antibodies coupled to Alexa dyes (488 and 594) were from Molecular Probes (Invitrogen). Digital images were obtained with an Olympus BX51 microscope (×100 oil and ×60 oil objectives) equipped with a Spot Diagnostic Instruments camera and collected with Spot image analysis software.
Controls were performed either by omitting the primary antibody or by preincubating the primary antibody with the corresponding peptide.
Western Blot Analysis.
Equal amounts (10–30 μg) of proteins were separated on 4–12% Bis-Tris SDS/PAGE gels or 20% Tricine gels (Invitrogen), blotted onto PVDF membranes (Millipore), and incubated overnight with the appropriate primary antibody. The following antibodies were used: MAb anti-APP (22C11), MAb anti-Aβ (4G8), and MAb anti BACE from Chemicon, MAb anti α-tubulin from Sigma, and polyclonal APP C-terminal and MAb anti PS1 (APS 11) from Novus Biologicals.
pTrK A and pTrK B were kindly provided by M. Chao; TrK A antibody, which detects basal levels of TrK receptors, was from Cell Signal.
Thioflavine T Assay.
Fluorescence measurements of thioflavin-binding proteins were carried out as previously settled (6) to give quantitative values at the excitation and emission wavelength of 446 and 490 nm, respectively. Thioflavine T (Sigma) (ThT) (final concentration 5 μM) was added to 1 ml of culture medium previously centrifuged at 8,000 × g to eliminate cell debris at the end of the incubation times.
Statistical Analysis.
Values are expressed as mean ± SE. Statistical analysis was performed with ANOVA, followed by the Newman–Keuls test. Statistical significance was accepted at the 95% confidence level (P < 0.05).
Supplementary Material
Acknowledgments.
We thank M. Chao for suggestions and for providing selective anti-pospho Trk-A/B antibodies, A. Cattaneo for critical reading of the manuscript, F. Florenzano for the immunofluorescence analysis, and G. Amadoro for some suggestions in the experimental procedures. This work was supported by grants from Regione Lazio and PRIN 06 (to P.C.).
Footnotes
The authors declare no conflict of interest.
This article contains supporting information online at www.pnas.org/cgi/content/full/0806133105/DCSupplemental.
References
- 1.Allen SJ, Dawbarn D. Clinical relevance of neurotrophins and their receptors. Clin Sci (London) 2006;110:175–191. doi: 10.1042/CS20050161. [DOI] [PubMed] [Google Scholar]
- 2.Williams BJ, Eriksdotter-Jonhagen M, Granholm AC. Nerve growth factor in treatment and pathogenesis of Alzheimer disease. Prog Neurobiol. 2006;80:114–128. doi: 10.1016/j.pneurobio.2006.09.001. [DOI] [PubMed] [Google Scholar]
- 3.Arancio O, Chao MV. Neurotrophins, synaptic plasticity and dementia. Curr Opin Neurobiol. 2007;17:325–330. doi: 10.1016/j.conb.2007.03.013. [DOI] [PubMed] [Google Scholar]
- 4.Tuszynski MH, et al. A phase 1 clinical trial of nerve growth factor gene therapy for Alzheimer disease. Nat Med. 2005;11:551–555. doi: 10.1038/nm1239. [DOI] [PubMed] [Google Scholar]
- 5.Frielingsdorf H, Simpson DR, Thal LJ, Pizzo DP. Nerve growth factor promotes survival of new neurons in the adult hippocampus. Neurobiol Dis. 2007;26:47–55. doi: 10.1016/j.nbd.2006.11.015. [DOI] [PubMed] [Google Scholar]
- 6.Matrone C, et al. Activation of the amyloidogenic route by NGF deprivation induces apoptotic death in PC12 cells. J Alzheimer Dis. 2008;13(1):81–96. doi: 10.3233/jad-2008-13109. [DOI] [PubMed] [Google Scholar]
- 7.Galli C, et al. Increased amyloidogenic secretion in cerebellar granule cells undergoing apoptosis. Proc Natl Acad Sci USA. 1998;95:1247–1252. doi: 10.1073/pnas.95.3.1247. [DOI] [PMC free article] [PubMed] [Google Scholar]
- 8.De Berardinis MA, Ciotti MT, Amadoro G, Galli C, Calissano P. Transfer of the apoptotic message in sister cultures of cerebellar neurons. NeuroReport. 2001;12:2137–2140. doi: 10.1097/00001756-200107200-00019. [DOI] [PubMed] [Google Scholar]
- 9.Culmsee C, et al. Nerve growth factor survival signaling in cultured hippocampal neurons is mediated through TrkA and requires the common neurotrophin receptor p75. Neuroscience. 2002;115:1089–1108. doi: 10.1016/s0306-4522(02)00539-0. [DOI] [PubMed] [Google Scholar]
- 10.Mashayekhi F. Neural cell death is induced by neutralizing antibody to nerve growth factor: An in vivo study. Brain Dev. 2008;30:112–117. doi: 10.1016/j.braindev.2007.07.001. [DOI] [PubMed] [Google Scholar]
- 11.Parks AL, Curtis D. Presenilin diversifies its portofolio. Trends Genet. 2007;23:140–150. doi: 10.1016/j.tig.2007.01.008. [DOI] [PubMed] [Google Scholar]
- 12.Nakajima M, et al. Nerve growth factor and epidermal growth factor rescue PC12 cells from programmed cell death induced by etoposide: Distinct modes of protection against cell death by growth factors and a protein-synthesis inhibitor. Neurosci Lett. 1994;176:161–164. doi: 10.1016/0304-3940(94)90072-8. [DOI] [PubMed] [Google Scholar]
- 13.Siegel GJ, Chauhan NB. Neurotrophic factors in Alzheimer's and Parkinson disease brain. Brain Res Rev. 2000;33:199–227. doi: 10.1016/s0165-0173(00)00030-8. [DOI] [PubMed] [Google Scholar]
- 14.Connor B, Dragunow M. The role of neuronal growth factors in neurodegenerative disorders of the human brain. Brain Res Brain Rev. 1998;27:1–39. doi: 10.1016/s0165-0173(98)00004-6. [DOI] [PubMed] [Google Scholar]
- 15.Capsoni S, et al. Alzheimer like neurodegeneration in aged antinerve growth factor transgenic mouse. Proc Natl Acad Sci USA. 2000;97:6826–6831. doi: 10.1073/pnas.97.12.6826. [DOI] [PMC free article] [PubMed] [Google Scholar]
- 16.Berger-Sweeney J, et al. Selective immunolesions of cholinergic neurons in mice: Effects on neuroanatomy, neurochemistry, and behavior. J Neurosci. 2001;21:8164–8173. doi: 10.1523/JNEUROSCI.21-20-08164.2001. [DOI] [PMC free article] [PubMed] [Google Scholar]
- 17.Cooper JD, et al. Failed retrograde transport of NGF in a mouse model of Down's syndrome: reversal of cholinergic neurodegenerative phenotypes following NGF infusion. Proc Natl Acad Sci USA. 2001;28:10439–10444. doi: 10.1073/pnas.181219298. [DOI] [PMC free article] [PubMed] [Google Scholar]
- 18.Salehi A, et al. Increased APP expression in a mouse model of Down's syndrome disrupts NGF transport and causes cholinergic neuron degeneration. Neuron. 2006;51:29–42. doi: 10.1016/j.neuron.2006.05.022. [DOI] [PubMed] [Google Scholar]
- 19.Capsoni S, Giannotta S, Cattaneo A. β-amyloid plaques in a model for sporadic Alzheimer's disease based on transgenic anti-nerve growth factor antibodies. Mol Cell Neurosci. 2002;21:15–27. doi: 10.1006/mcne.2002.1163. [DOI] [PubMed] [Google Scholar]
- 20.Bredesen DE, Mehlen P, Rabizadeh S. Receptors that mediate cellular dependence. Cell Death Differ. 2005;12:1031–1043. doi: 10.1038/sj.cdd.4401680. [DOI] [PubMed] [Google Scholar]
- 21.Sotthibundhu A, et al. Beta-amyloid(1-42) induces neuronal death through the p75 neurotrophin receptor. J Neurosci. 2008;28:3941–3946. doi: 10.1523/JNEUROSCI.0350-08.2008. [DOI] [PMC free article] [PubMed] [Google Scholar]
- 22.Rajagopal R, Chen Z-Y, Lee FS, Chao MV. Transactivation of Trk neurotrophin receptors by G-protein-coupled receptor ligands occurs on intracellular membranes. J Neurosci. 2004;24:6650–6658. doi: 10.1523/JNEUROSCI.0010-04.2004. [DOI] [PMC free article] [PubMed] [Google Scholar]
- 23.Mosmann T. Rapid colorimetric assay for cellular growth and survival: application to proliferation and cytotoxicity assays. J Immunol Methods. 1983;65:55–63. doi: 10.1016/0022-1759(83)90303-4. [DOI] [PubMed] [Google Scholar]
- 24.Volontè C, Ciotti MT, Battistini L. Development of a method for measuring cell number: Application to CNS primary neuronal cultures. Cytometry. 1994;17:274–276. doi: 10.1002/cyto.990170311. [DOI] [PubMed] [Google Scholar]
Associated Data
This section collects any data citations, data availability statements, or supplementary materials included in this article.


