Abstract
The core region of primate auditory cortex contains a primary and two primary-like fields (AI, primary auditory cortex; R, rostral field; RT, rostrotemporal field). Although it is reasonable to assume that multiple core fields provide an advantage for auditory processing over a single primary field, the differential roles these fields play and whether they form a functional pathway collectively such as for the processing of spectral or temporal information are unknown. In this report we compare the response properties of neurons in the three core fields to pure tones and sinusoidally amplitude modulated tones in awake marmoset monkeys (Callithrix jacchus). The main observations are as follows. (1) All three fields are responsive to spectrally narrowband sounds and are tonotopically organized. (2) Field AI responds more strongly to pure tones than fields R and RT. (3) Field RT neurons have lower best sound levels than those of neurons in fields AI and R. In addition, rate-level functions in field RT are more commonly nonmonotonic than in fields AI and R. (4) Neurons in fields RT and R have longer minimum latencies than those of field AI neurons. (5) Fields RT and R have poorer stimulus synchronization than that of field AI to amplitude-modulated tones. (6) Between the three core fields the more rostral regions (R and RT) have narrower firing-rate–based modulation transfer functions than that of AI. This effect was seen only for the nonsynchronized neurons. Synchronized neurons showed no such trend.
INTRODUCTION
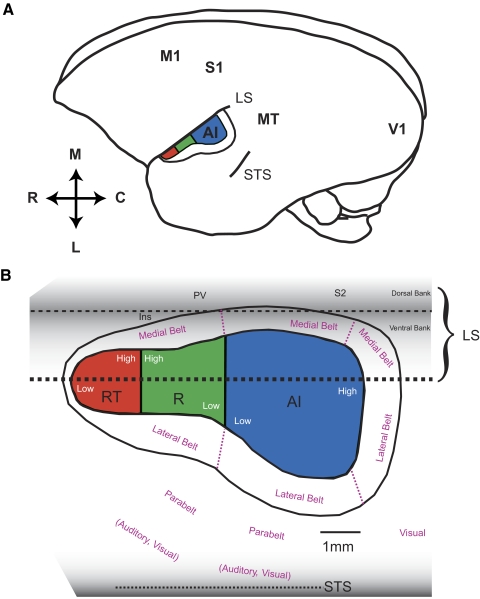
In mammalian species, auditory cortex is subdivided into a primary field and additional fields that are generally referred to as primary-like or secondary. In primates, the primary auditory cortex (AI) and neighboring primary-like fields are collectively referred to as the “core” region (Kaas and Hackett 2000). This core region is surrounded by a “belt” region, which contains somewhere between seven and eight distinct secondary fields (Kaas and Hackett 2000; Petkov et al. 2006). In both New World and Old World monkeys, three fields have been identified within the core region: primary auditory cortex (AI), the rostral (R) field, and the rostrotemporal (RT) field (Imig et al. 1977; Merzenich and Brugge 1973; Morel and Kaas 1992; Morel et al. 1993; Petkov et al. 2006). Figure 1 illustrates the positions of the three core fields within the auditory cortex of a marmoset's left hemisphere.
FIG. 1.
Model of the organization of auditory cortex in marmosets. A: location of auditory cortex within a marmoset's left hemisphere. B: the organization of auditory fields within auditory cortex. The lateral sulcus is unfolded to show the portion of auditory cortex found within the lateral sulcus (adapted from Pistorio et al. 2005). The relative sizes and locations of each field were estimated from physiological and anatomical data, in combination with data from previous studies (Burman et al. 2006; Kaas and Hackett 2000). A 1-mm-scale bar is displayed. LS, lateral sulcus; S2, secondary somatosensory area; PV, parietal ventral area; Ins, insula; AI, primary auditory cortex; R, rostral field; RT, rostral temporal field; STS, superior temporal sulcus; M, medial; R, rostral; C, caudal; L, lateral; V1, primary visual cortex; M1, primary motor cortex; S1, primary somatosensory cortex; MT, middle temporal area.
The core fields can be distinguished from each other as well as from the surrounding belt areas by their anatomical connections, physiological properties, and architectonic features. Only the core fields receive their primary thalamic input from the ventral division of the medial geniculate body (vMGB) (Aitkin et al. 1988; De la Mothe et al. 2006b; Luethke et al. 1989; Morel and Kaas 1992; Morel et al. 1993; Rauschecker et al. 1997). Conversely, the belt areas receive their primary thalamic input from the medial and dorsal divisions of the MGB (De la Mothe et al. 2006b; Hackett et al. 1998a). The three core fields are all interconnected, with neighboring core fields (AI and R; R and RT) having a larger degree of connectivity (De la Mothe et al. 2006a; Kaas and Hackett 2000). Each of these three core fields is tonotopically organized and responds to spectrally narrowband sounds such as pure tones (Aitkin et al. 1986; Morel and Kaas 1992; Rauschecker et al. 1995). Architectonic features such as a dense expression of cytochrome oxidase and parvalbumin, a high degree of myelination, and a prominent granular layer are common to all three core fields, but not the surrounding belt areas (Kaas and Hackett 2000; Kosaki et al. 1997). Similar architectonic features used to identify the core and belt regions in monkeys have also been observed in the auditory cortex of both humans and chimpanzees (Brodmann 1909; Hackett et al. 2001), suggesting that all primate species have a homologous “core and belt” organization of auditory cortex.
In monkeys, the rostral and caudal portions of AI contain neurons with low and high best frequencies (BFs), respectively. Field R shows the opposite spatial organization of BF, in which the caudal region contains low BF neurons, whereas the rostral region contains high BF neurons. Because AI and R contain mirror-reversed cochleotopic maps, their border is located at the frequency reversal between their cochleotopic gradients (Morel and Kaas 1992; Morel et al. 1993; Petkov et al. 2006). Using this approach, two distinct auditory fields were imaged in human subjects and identified as homologous to AI and R in the monkey (Formisano et al. 2003). A cochleotopic reversal has also been used to identify field RT, which borders the rostral portion of field R (Morel and Kaas 1992; Petkov et al. 2006). Whether RT contains a frequency map with a smooth transition between low and high BFs, similar to what has been observed in R and AI, has not been verified. The architectonic features characteristic of the core fields (e.g., dense expression of paralbumin) are somewhat less pronounced in RT and, as such, there is less certainty whether RT should be considered part of the core (Kaas and Hackett 2000). Given that anatomical connections are strongest between neighboring core fields, one may expect that serial—and potentially hierarchical—processing occurs along the caudal-to-rostral axis of the core (AI–R–RT). In other sensory cortices, reversals in the topographic gradient (e.g., retinotopic in vision, somatotopic in somatosensation) are observed between different cortical areas and these typically occur along with other differences in physiological properties, such as receptive field size or stimulus feature selectivity.
A number of differences have been observed between response properties in AI and R: that R has a longer response latency (Recanzone et al. 2000; Scott 2004), poorer stimulus synchronization (Bieser and Muller-Preuss 1996), and broader spatial tuning (Woods et al. 2006). More recently, we have suggested that R and RT, the two core fields rostral to AI, are involved in transforming the temporal representation of the acoustic signal's envelope (repetition rate) in AI into a rate code that no longer relies on spike timing (Bendor and Wang 2007). In this report, we quantify the tonotopic organization of the three core fields (AI, R, and RT) in marmoset monkeys (Aitkin and Park 1993) and compare their response properties to pure tones and sinusoidally amplitude modulated (sAM) tones. The neurophysiological experiments were conducted in awake subjects to avoid potential confounds by anesthesia, particularly in cortical fields outside AI.
METHODS
General experimental procedures
Details of experimental procedures can be found in previous publications from our laboratory (Lu et al. 2001; Wang et al. 2005). Single-unit recordings were conducted in two awake marmosets (subject 1: M2P, left hemisphere; subject 2: M32Q, left hemisphere) sitting quietly in a semirestraint device with the head immobilized, within a double-walled soundproof chamber (Industrial Acoustics, Bronx, NY) whose interior is covered by 3-in. acoustic absorption foam (Sonex; Pinta Acoustic, Minneapolis, MN). The animal was awake but was not performing a task during these experiments. Because the auditory cortex of the marmoset lies largely on the lateral surface of the temporal lobe, tungsten microelectrodes (impedance 2–5 MΩ at 1 kHz; A-M Systems) could be inserted perpendicular to the cortical surface. Electrodes were mounted on a micromanipulator (Narishige) and advanced by a manual hydraulic microdrive (Trent Wells). Action potentials were detected on-line using a template-based spike sorter (MSD; Alpha Omega Engineering) and continuously monitored by the experimenter while data recording progressed. Typically 5–15 electrode penetrations were made through the dura within a miniature recording hole (diameter ∼1 mm), after which the hole was sealed with dental cement and another hole was opened for new electrode penetrations. Neurons were recorded from all cortical layers, but most commonly from supragranular layers. All experimental procedures were approved by the Johns Hopkins University Animal Use and Care Committee.
Generation of acoustic stimuli
Acoustic stimuli were generated digitally and delivered by a free-field speaker located 1 m directly in front of the animal. All sound stimuli were generated at a 100-kHz sampling rate and low-pass filtered at 50 kHz by an antialiasing filter. Frequency tuning curves and rate-level functions were typically generated using 200-ms-long pure-tone stimuli and interstimulus intervals (ISIs) >500 ms. In some cases 500-ms stimuli and ISIs >1,000 ms were used if the neuron showed long-latency responses (to distinguish a long-latency response from an offset response). Sinusoidally amplitude modulated (sAM) tones were typically 500 ms long and ISIs >1,000 ms were used. Five repetitions, at a minimum, were presented for all stimuli. Typically ≥10 repetitions for each stimulus were presented for rate-level functions (71%, 367/518 neurons) and sAM modulation frequency tuning curves (64%, 183/285 neurons). All stimuli were presented in a randomly shuffled order. Although 16–21 steps per octave were generally used in generating frequency tuning curves, a higher-frequency sampling density (>30 steps per octave) was used for neurons with narrow frequency tuning. The sound levels of pure-tone stimuli were generally 10–30 dB above threshold for neurons with monotonic rate-level functions or at preferred levels (near or at peak response) for nonmonotonic neurons. Rate-level functions spanned 0–80 dB SPL in 10-dB steps. For low-threshold neurons, responding at sound levels as low as 0 dB SPL, we extended the rate-level function down to −20 dB SPL. Modulation frequency tuning functions for sAM stimuli spanned 4–512 Hz in octave or half-octave steps. For high BF neurons, modulation frequencies of 1,024 and 2,048 Hz were also tested.
Identification of cortical areas
Primary auditory cortex was identified by its response to pure tones and tonotopic gradient (high-frequency: caudomedial; low frequency: rostrolateral). The rostral fields R and RT were identified by frequency reversals in the tonotopic gradient. The median BF of neurons with significant responses to tones was calculated within an analysis window moving along the caudal-to-rostral axis. This was then smoothed using a moving average filter (order 200), applied in both the forward and reverse directions to remove any phase delays generated by the filter. Tonotopic reversals were localized to minimums and maximums in this curve. Although the majority of recordings were in AI, R, and RT, a subset of the recorded neurons may have been in the lateral belt or parabelt. We limited our comparison of core areas to neurons within 2–2.5 mm from the lateral sulcus in regions that were generally tone responsive.
Single units with significant responses to tones, band-pass noises, or other narrowband stimuli (e.g., sAM tones) were used to generate cortical BF maps. Using the preferred acoustic stimulus of each neuron (Wang et al. 2005), we determined the BF of each unit. The BF of a recording site was calculated by computing the median BF of neurons within the electrode track. Then a smoothed tonotopic map was generated by calculating the median BF of all recording sites within a 0.25-mm radius.
Data analysis
The criteria for a significant stimulus-driven response was defined as an average discharge rate 2SDs above the mean spontaneous discharge rate, and at least one spike per trial for ≥50% of the trials. Discharge rates were calculated over the entire duration of the stimulus plus 100 ms after the stimulus ended. The mean spontaneous discharge rate was subtracted from the mean driven discharge rate in all analyses, unless otherwise noted. For BF maps (Fig. 2), only neurons with peak discharge rates of 4SDs above the mean spontaneous rate and at least two spikes per trial on 50% of the trials were considered as having a pure-tone response. The stricter criteria for a significant pure-tone response were used to provide a clearer separation between core and belt regions.
FIG. 2.
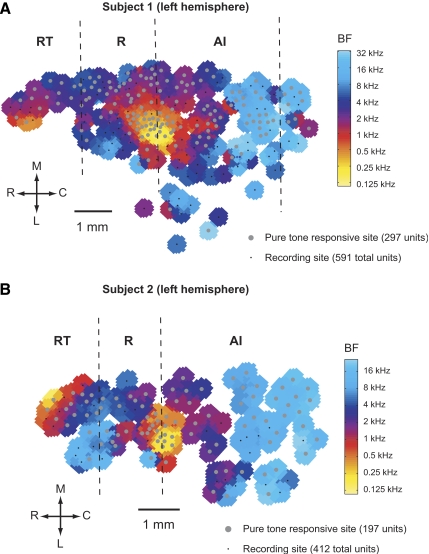
Cortical best-frequency maps. Two maps of the spatial distribution of BFs, and the borders of AI/R and R/RT (dashed lines) based on the methods shown in Fig. 3. Pure-tone–responsive and pure-tone–nonresponsive recording sites are indicated on the plot. A 1-mm-scale bar is shown on each BF map. BF, best frequency; M, medial; R, rostral; C, caudal; L, lateral. A: subject 1: M2P (left hemisphere). B: subject 2: M32Q (left hemisphere).
Population poststimulus time histograms (PSTHs) were obtained by averaging individual PSTHs. Individual PSTHs were obtained by convolving a Gaussian kernel (σ = 10 ms) with the spike train.
A monotonicity index was defined as the mean discharge rate obtained at the highest sound level tested (typically 80 dB SPL) divided by the discharge rate at the neuron's best sound level. The mean spontaneous rate was subtracted from the calculation of mean discharge rate in this analysis. Neurons with a monotonicity index close to one had a monotonic rate-level function, whereas a monotonicity index close to zero indicated a highly nonmonotonic rate-level function. Negative values indicated a firing rate at high sound levels that was below the mean spontaneous rate.
Q10 values were calculated by dividing the neuron's BF by its pure-tone tuning bandwidth (in kilohertz) obtained at 10 dB above the neuron's threshold. The BW10 value was the bandwidth (in octaves) obtained from a neuron's pure-tone tuning at 10 dB above its threshold. The upper and lower frequency boundaries in the bandwidth calculation were obtained by determining at what frequency the interpolated firing rate equaled the criteria for a significant firing rate.
Response duration (measured from the onset of the stimulus) and persistent activity duration (measured from the offset of the stimulus) were calculated by determining the time at which the neuron's response was no longer significant (<2SDs above the spontaneous rate) using a 20-ms sliding window. The neuron's minimum response latency was subtracted from both the calculations of response duration and persistent activity.
Minimum latencies were calculated by finding the earliest time after stimulus onset where three consecutive 2-ms bins had discharge rates >2SDs above the mean spontaneous discharge rate (method used by Recanzone et al. 2000). In addition, because some neurons have very low spontaneous rates, the first of the three bins was required to have at least two spikes and the second and third bins were required to have at least one spike. Neurons that did not pass these criteria [AI (n = 12), R (n = 13), RT (n = 4)] were excluded from the analysis. Peak latencies were calculated by convolving a Gaussian kernel (σ = 5 ms) with the neuron's response and finding the time of the peak response. Minimum and peak latencies were calculated from pure-tone responses at BF, based on significant responses across multiple sound levels. Only neurons with ≥25 trials (at BF, but including multiple sound levels) were included in latency analyses.
Latency, duration, and sound level measures were calculated using a neuron's rate-level function at BF. Calculation of the total of number of tone-responsive neurons (Table 1) used both rate-level functions and frequency tuning curves with significant responses.
TABLE 1.
Correlation of BF vs. distance along the caudorostral axis
| Subject | AI | R | RT |
|---|---|---|---|
| 1 | r = 0.78, P < 1.2 × 10⁻²³ | r = −0.58, P < 2.0 × 10⁻⁹ | r = 0.74, P < 1.4 × 10⁻⁹ |
| 2 | r = 0.94, P < 1.7 × 10−46 | r = −0.84, P < 2.3 × 10⁻⁴ | r = 0.73, P < 6.0 × 10⁻⁶ |
Response measures from AI, R, and RT were compared using a Kruskal–Wallis test to determine statistical significance (P < 0.05). Post hoc pairwise comparisons between fields were then made using a Tukey's honestly significant difference (HSD) test to correct for multiple comparisons (using a significance criterion of P < 0.05). Significant mean vector strengths at each modulation frequency were determined using a Wilcoxon rank-sum test (P < 0.05, Bonferroni corrected). Significant covariation of BF with a response measure (such as latency) was determined by measuring the nonparametric rank-order correlation (Spearman correlation coefficient, P < 0.05). The medians of response measures were plotted using a sliding 1-octave window of BFs.
A neuron was classified as synchronized to sAM stimuli if its vector strength was >0.1 and significant (Rayleigh statistic >13.8, P < 0.001) for any modulation frequency between 4 and 512 Hz (Mardia and Jupp 2001). Vector strengths with a nonsignificant Rayleigh statistic were set to zero for population analyses. Vector strengths were calculated over the time period starting 50 ms after stimulus onset and finishing 50 ms after stimulus offset. The criterion for a nonsynchronized response was a neuron with a significant discharge rate to at least one modulation frequency between 4 and 512 Hz that lacked significant stimulus synchronization at all modulation frequencies tested between 4 and 512 Hz. We used a stricter significance criterion for the discharge rate (3SDs above the mean spontaneous rate) to correct for multiple comparisons (P < 0.05, Bonferroni corrected). In addition, we required a significant mean discharge rate to sAM tones when the onset response (first 100 ms) was removed. This was done to avoid a purely onset response qualifying as a nonsynchronized response.
The temporal best modulation frequency (tBMF) was calculated for neurons with significant stimulus synchronization to at least one modulation frequency. The modulation frequency corresponding to the peak vector strength (statistically significant) was first identified. Then the vector-strength-weighted geometric mean of modulation frequencies with significant vector strengths at ≥50% of the peak vector strength was calculated as the tBMF.
The maximum synchronization frequency (fmax) was obtained by finding the interpolated modulation frequency (on a logarithmic scale) with a Rayleigh statistic = 13.8 (significance criterion for vector strength, P < 0.001).
The rate-based best modulation frequency (rBMF) was determined by finding the discharge rate-weighted geometric mean of modulation frequencies with firing rates both significantly above the spontaneous rate and >50% of the peak rate for sAM stimuli.
The half-maximum bandwidth of the firing-rate–based modulation transfer function (rMTF) was the difference (in octaves) between the two half-maximum points in the rMTF (each obtained using interpolation). The full bandwidth was the range (in octaves) of modulation frequencies in the rMTF with significant firing rates (also determined using interpolation). The Q value of the rMTF was the rBMF divided by the full rMTF bandwidth.
The Spearman correlation coefficient was used to analyze whether response latency was correlated with the rBMF, tBMF, or fmax. Nonsynchronized neurons were included in the analysis for fmax (given a value of 0 Hz) and rBMF but not for the tBMF. Correlation coefficients with P < 0.05 were considered significant.
RESULTS
We recorded from 1,003 well-isolated single units in the auditory cortex of two marmoset monkeys (both left hemisphere). To determine the BF of each neuron and map the cochleotopic organization of each cortical field, we used a large set of simple and moderately complex acoustic signals whose carrier or center frequency was systematically changed (e.g., pure tones, narrowband noise, sinusoidally amplitude modulated tones, and sinusoidally frequency modulated tones). For many neurons in the core region, pure tones were sufficient to evoke a response and, by varying the frequency of pure tones, we were able to determine a neuron's BF. However, more acoustically complex narrowband stimuli (such as sAM tones) were sometimes necessary to evoke a response, especially in the rostral portions of the core region.
Cortical fields within the core area
We calculated the median BF of clusters of single units within 0.25 mm of each other (across the cortical surface). By plotting the BF across all of our recording sites, we constructed a BF map of auditory cortex from two subjects (Fig. 2). In both BF maps shown in Fig. 2, we can qualitatively observe the frequency reversals that form the boundary between AI and R as well as between R and RT, as indicated by vertical dashed lines (also see Fig. 3, A and B). In Fig. 2A, a BF reversal can also be seen at the caudal portion of AI. We did not systematically explore this region in the present study.
FIG. 3.
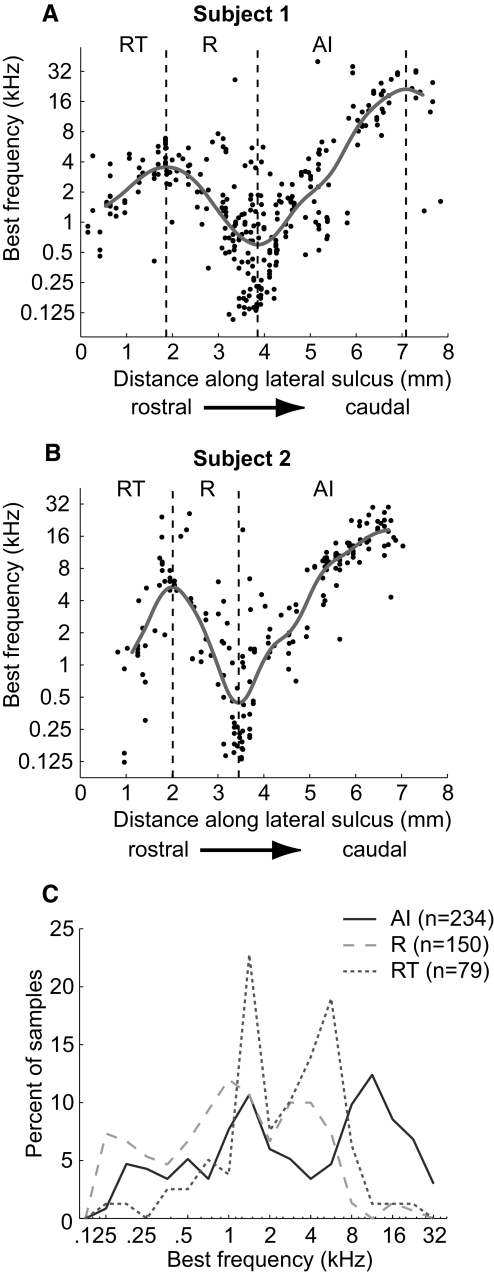
Calculation of core area boundaries. Best frequency of units according to their location along the caudal-to-rostral axis (parallel to lateral sulcus). The median best frequency (gray line) calculated using a sliding window (see methods) is plotted on the data. A: data from M2P (left hemisphere). B: data from M32Q (left hemisphere). C: BF distributions for neurons in AI, R, and RT.
Although the cochleotopic gradient (low to high frequency) is rostrolateral to caudomedial in AI, and caudolateral to rostromedial in R, we observed that it was sufficient to use the frequency reversal along the caudal-to-rostral axis (parallel to lateral sulcus) to determine the border between these two core areas. Figure 3, A and B shows the smoothed median BF along the rostral-to-caudal axis of auditory cortex in both subjects. The rostrally located high-frequency reversal indicates the border of R/RT, whereas the caudally located low-frequency reversal indicates the border of AI/R. In addition, Subject 1 (M2P) had a second caudal high-frequency reversal. It is likely that this caudal region is the caudomedial belt (CM) and/or caudolateral belt (CL) area (Recanzone et al. 2000).
We calculated the correlation between BF and position along the caudal-to-rostral axis for each of the three core fields in each subject. We found that in all cases there was a significant correlation (Spearman correlation coefficient, P < 0.05; see Table 1) demonstrating that each of the three fields is cochleotopically organized.
Figure 3C shows that the distributions of BF between the three core fields were dissimilar, either due to incomplete frequency representations or biases in our sampling of BF across the cortical surface. The latter may have resulted from the fact that we recorded from the surface of the superior temporal gyrus, and a portion of the core (i.e., high-frequency regions of R and RT) was not recorded from because it was buried within the lateral sulcus.
The division between core and belt was somewhat less clear. The pure-tone–responsive sites (see methods) indicated by the gray circles in Fig. 2 are clustered near the medial portion of the map and give a rough indication of the core relative to the lateral belt region. Pure-tone–responsive sites were found beyond this border, but more typically neurons at those sites required an acoustic signal with a broader spectral composition than that of pure tones (Barbour and Wang 2003; Rauschecker et al. 1995). At the most lateral portion of the BF map in Fig. 2A the frequency map becomes discontinuous. Because the majority of neurons responded only to complex stimuli such as marmoset vocalizations, wideband noise, or amplitude-modulated wideband noise, we could not accurately determine the BF. It is important to note that in this region, we also started to observe visually responsive neurons that were unresponsive or weakly responsive to acoustic stimuli. Although visually responsive neurons have been found in all areas of auditory cortex, a higher incidence of these neurons has been found in nonprimary regions (Bizley et al. 2007).
Pure-tone responses in AI, R, and RT
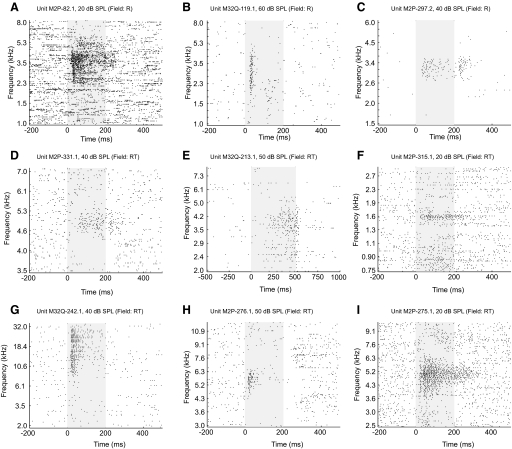
Neurons within each of the three core fields generally responded to pure tones. Figure 4 shows examples of single-unit responses to pure tones recorded from fields R and RT. In both subjects, field RT had the smallest proportion of neurons responding to pure-tone stimuli (60%; see Table 2). Neurons in these three fields exhibited a wide range of response latencies, sound level preferences, and frequency tuning bandwidths to pure-tone stimuli.
FIG. 4.
Examples of neuronal responses to pure tones in fields R and RT. Subject, unit number, and sound level of acoustic stimulus are indicated on each plot. The stimulus is presented during the shaded portion of the plot (E: 0–500 ms; all others: 0–200 ms). A–C: field R neurons. D–I: field RT neurons.
TABLE 2.
Percentage of tone-responsive neurons
| Subject | AI | R | RT |
|---|---|---|---|
| 1 | 173/202 (86%) | 165/231 (71%) | 66/94 (70%) |
| 2 | 148/203 (73%) | 71/88 (81%) | 42/86 (49%) |
| Total | 321/405 (79%) | 236/319 (74%) | 108/180 (60%) |
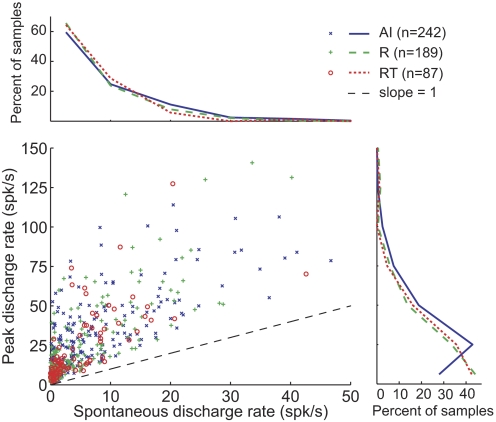
The median spontaneous rate across all three areas was 2.9 spikes/s, and no significant difference was observed between the three core areas (Kruskal–Wallis test; see Table 3 and Fig. 5). However, AI neurons typically had a higher discharge rate to pure tones at their preferred sound level than neurons in either field R or field RT (Tukey's HSD test, P < 0.05; see Table 3 and Fig. 5). No significant difference in the peak discharge rates to pure tones was observed between R and RT (Tukey's HSD test, P = 0.97).
TABLE 3.
Median and mean values of different analyses and core field comparisons
| Analysis |
Median Values (Total Units) |
Mean Values ± SD
|
Tukey's HSD Test P-Value
|
||||||
|---|---|---|---|---|---|---|---|---|---|
| AI | R | RT | AI | R | RT | AI vs. R | R vs. RT | AI vs. RT | |
| Peak firing rate, spikes/s | 22.6 (242) | 14.7 (189) | 14.3 (87) | 30.5 ± 28.2 | 25.7 ± 29.0 | 22.8 ± 21.9 | 0.01 | 0.97 | 0.03 |
| Spontaneous firing rate, spikes/s | 3.3 (242) | 2.2 (189) | 1.9 (87) | 6.9 ± 8.8 | 5.5 ± 7.3 | 4.9 ± 6.4 | 0.12 | 0.97 | 0.39 |
| Minimum latency, ms | 27.0 (177) | 35.0 (120) | 37.0 (56) | 39.6 ± 55.9 | 41.3 ± 33.9 | 62.8 ± 81.9 | 0.04 | 0.22 | 8.0 × 10⁻³ |
| Peak latency [1–16 kHz], ms | 54.0 (128) | 51.0 (81) | 97.0 (51) | 97.5 ± 178.6 | 64.0 ± 45.1 | 97.0 ± 117.0 | 0.07 | 9.0 × 10⁻³ | 0.51 |
| Response duration, ms | 173.0 (196) | 135.0 (151) | 142.0 (54) | 164.1 ± 87.7 | 144.1 ± 92.8 | 154.0 ± 90.0 | 0.06 | 0.53 | 0.87 |
| Persistent activity duration, ms | 25.0 (84) | 33.0 (46) | 53.0 (24) | 46.0 ± 54.7 | 54.5 ± 56.9 | 65.3 ± 49.1 | 0.58 | 0.22 | 0.03 |
| Sound level threshold, dB SPL | 20.0 (150) | 20.0 (109) | 10.0 (74) | 17.9 ± 17.6 | 23.9 ± 21.6 | 13.5 ± 16.1 | 0.11 | 5.0 × 10⁻⁴ | 0.07 |
| Best sound level, dB SPL | 40.0 (150) | 50.0 (109) | 20.0 (74) | 42.5 ± 23.4 | 48.3 ± 24.0 | 33.8 ± 24.1 | 0.16 | 2.0 × 10⁻⁴ | 0.03 |
| Monotonicity index | 0.43 (242) | 0.54 (189) | 0.14 (87) | 0.42 ± 0.49 | 0.44 ± 0.51 | 0.26 ± 0.47 | 0.91 | 0.01 | 0.02 |
| Q10 values [0.5–8 kHz] | 2.4 (27) | 3.1 (22) | 5.9 (24) | 7.5 ± 15.0 | 4.5 ± 3.0 | 7.7 ± 8.9 | 0.65 | 0.57 | 0.12 |
| BW10 values [0.5–8 kHz] | 0.57 (27) | 0.48 (22) | 0.25 (24) | 0.83 ± 0.81 | 0.59 ± 0.55 | 0.44 ± 0.39 | 0.70 | 0.53 | 0.12 |
| sAM tBMF—sync population, Hz | 8.1 (55) | 6.5 (50) | 5.7 (28) | 12.9 ± 14.8 | 11.5 ± 14.5 | 11.4 ± 19.0 | 0.19 | 0.74 | 0.07 |
| sAMfmax—sync population, Hz | 26.1 (55) | 12.8 (50) | 12.3 (28) | 56.3 ± 84.1 | 25.5 ± 38.2 | 24.9 ± 28.5 | 0.03 | 0.99 | 0.10 |
| sAMfmax—all neurons, Hz | 5.5 (101) | 4.7 (91) | 0.0 (86) | 30.7 ± 67.9 | 14.0 ± 30.9 | 8.1 ± 19.9 | 0.58 | 0.03 | 9.0 × 10⁻⁴ |
| sAM rBMF, Hz | 43.4 (98) | 27.2 (88) | 25.1 (86) | 107.0 ± 135.1 | 56.5 ± 85.5 | 90.3 ± 128.7 | 0.11 | 0.83 | 0.34 |
| sAM rMTF half-max BW, octaves | 22.6 (98) | 14.7 (88) | 14.3 (86) | 2.4 ± 1.6 | 2.0 ± 1.3 | 1.8 ± 1.2 | 0.15 | 0.29 | 2.0 × 10⁻³ |
| sAM rMTF half-max BW—nonsync population | 1.9 (46) | 1.2 (41) | 1.0 (58) | 2.1 ± 1.4 | 1.4 ± 0.7 | 1.3 ± 0.9 | 0.02 | 0.73 | 6.0 × 10⁻⁴ |
| sAM rMTF half-max BW—sync population | 2.2 (52) | 2.3 (47) | 2.1 (28) | 2.6 ± 1.7 | 2.6 ± 1.5 | 2.6 ± 1.3 | 0.99 | 0.98 | 0.98 |
| sAM rMTF BW, octaves | 3.9 (98) | 3.4 (88) | 2.8 (86) | 4.2 ± 2.2 | 3.7 ± 2.2 | 3.6 ± 2.4 | 0.31 | 0.88 | 0.12 |
| sAM rMTF BW—nonsync population | 3.0 (46) | 2.1 (41) | 2.1 (58) | 3.5 ± 2.1 | 2.7 ± 1.8 | 2.8 ± 2.0 | 0.14 | 0.99 | 0.09 |
| sAM rMTF BW—sync population | 5.2 (52) | 5.0 (47) | 6.3 (28) | 4.7 ± 2.2 | 4.6 ± 2.2 | 5.2 ± 2.1 | 0.94 | 0.42 | 0.59 |
| sAM rMTF Q-value | 0.35 (98) | 0.40 (88) | 0.54 (86) | 0.51 ± 0.60 | 0.65 ± 0.90 | 0.70 ± 0.74 | 0.75 | 0.76 | 0.32 |
| sAM rMTF Q-value—nonsync population | 0.49 (48) | 0.66 (43) | 0.71 (61) | 0.61 ± 0.51 | 0.98 ± 1.17 | 0.91 ± 0.79 | 0.32 | 0.94 | 0.13 |
| sAM rMTF Q-value—sync population | 0.20 (52) | 0.25 (47) | 0.11 (28) | 0.43 ± 0.66 | 0.37 ± 0.41 | 0.25 ± 0.30 | 0.98 | 0.35 | 0.25 |
HSD, honestly significant difference.
FIG. 5.
Average spontaneous and peak discharge rate. Comparison of spontaneous discharge rates and peak discharge rates in AI, R, and RT. Distribution of spontaneous rates is shown in the top plot. The distribution of peak discharge rates is shown on the right plot. The spontaneous rate has not been subtracted from the peak rate in this analysis. Two AI units and one R unit have peak discharge rates >150 spikes/s, and are not displayed. Only neurons tested with tone durations ≥200 ms are analyzed here. The black dashed diagonal line has slope = 1.
Best level and threshold differences between core fields
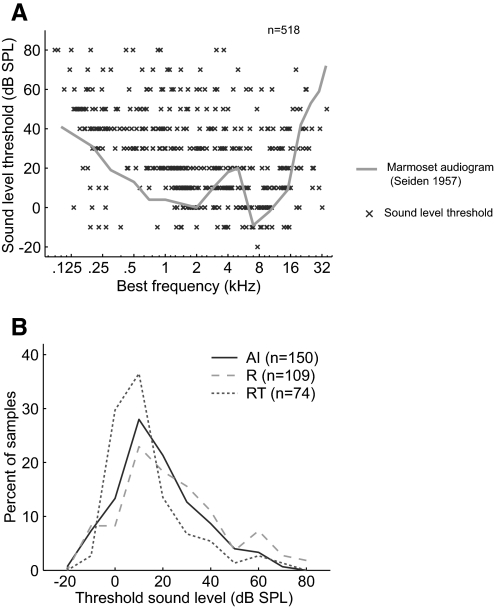
Figure 6 A shows the distribution of sound level thresholds at BF measured from individual neurons from all three fields. In the same figure, we overlay the marmoset audiogram (adapted from Seiden 1957). Because there is a dependence of the sound level threshold on BF, we compared the distributions of thresholds among the three core areas between 1 and 16 kHz, where the marmoset's audiogram changes by <20 dB. We observed that RT neurons had relatively lower sound level threshold among the three core fields (Fig. 6B). However, only the difference between R and RT was significant (Tukey's HSD test, P < 0.05; see Table 3). No statistically significant differences were observed between AI and RT (P = 0.07) or AI and R (P = 0.11).
FIG. 6.
Distribution of sound level threshold. A: sound level threshold across all neurons (2 subjects) with significant discharge rates. Marmoset audiogram (data from Seiden 1957) shown in gray. B: distribution of sound level threshold in AI, R, and RT. Only neurons with BFs between 1 and 16 kHz were used to avoid biases resulting from differences between areas in their frequency map.
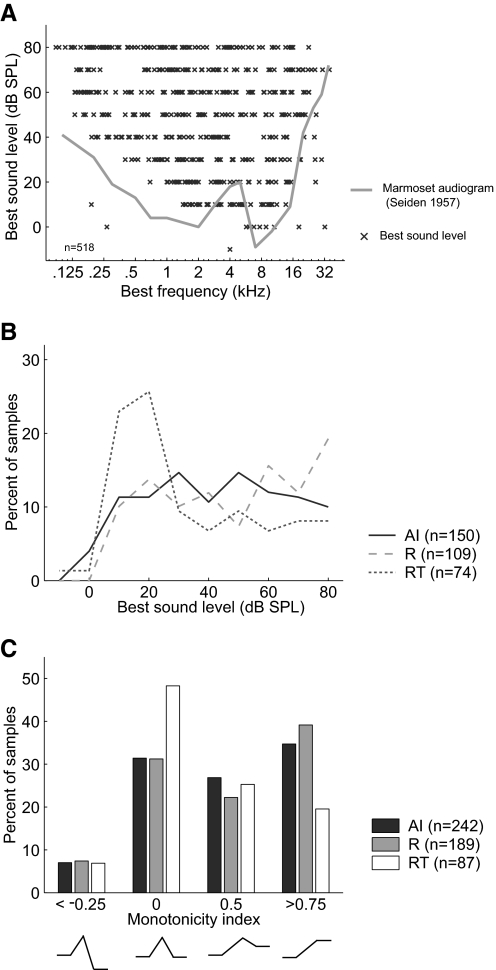
Figure 7 A shows the distribution of best sound level (sound level evoking the maximum discharge rate) across BF in all three fields. As observed with sound level threshold, the best sound level of neurons varied with BF and, as such, we limited our comparisons of the three fields to neurons with BFs between 1 and 16 kHz. We observed that RT neurons had lower best sound levels than those of neurons in both field AI and field R (Tukey's HSD test, P < 0.05), whereas there was not a significant difference in best level between AI and R (P = 0.16) (Table 3, Fig. 7B). We next calculated the monotonicity index of the rate-level function (see methods). We observed that RT neurons had significantly lower monotonicity indices than those of neurons in AI and R (Tukey's HSD test, P < 0.02), indicating that RT has a higher proportion of neurons with nonmonotonic rate-level functions (Table 3, Fig. 7C). The monotonicity indices of AI and R neurons were not significantly different (Tukey's HSD test, P = 0.91).
FIG. 7.
Distribution of best sound level and monotonicity index. A: best sound level across all neurons (2 subjects) with significant discharge rates. Marmoset audiogram (data from Seiden 1957) shown in gray. B: distribution of best sound levels in AI, R, and RT. Only neurons with BFs between 1 and 16 kHz were used to avoid biases resulting from differences between areas in their frequency map. C: distribution of the monotonicity index in AI, R, and RT.
Comparison of frequency tuning to pure tones between the three core fields
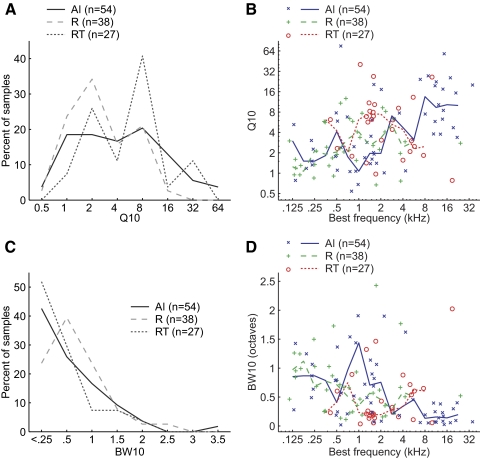
In previous studies, the bandwidth of spectral tuning to pure tones has commonly been quantified by calculating Q10 values (BF/bandwidth at 10 dB above threshold), for which higher Q10 values indicate narrower bandwidths. We observed that neurons in field RT had higher Q10 values than those of neurons in fields AI and R (Fig. 8 A). However, AI and R showed a significant correlation between Q10 values and BF (Spearman correlation coefficient: AI: r = 0.55, P < 2.3 × 10⁻⁵; R: r = 0.36, P < 0.025; see Fig. 8B). We thus reanalyzed the Q10 distributions in the three fields using only neurons with BFs between 0.5 and 8 kHz because in this range there was no significant correlation between Q10 and BF in any of the three fields (Spearman correlation coefficient, P > 0.3). Field RT had a higher median Q10 value (5.9) than that of either field R (3.1) or field AI (2.4), but no statistically significant difference between fields was observed (Kruskal–Wallis test, Table 3). We also analyzed the BW10 (bandwidth at 10 dB above threshold measured in octaves) of neurons in the three fields (Fig. 8C). Similar to our Q10 analysis, we observed a significant correlation between BW10 values and BF (Spearman correlation coefficient, r = −0.54, P < 3.7 × 10⁻⁵; R: r = −0.38, P < 0.02; see Fig. 8D). After reanalyzing our data using only neurons with BFs between 0.5 and 8 kHz, we observed that field RT had the narrowest median BW10 (0.25), compared with that of fields R (0.48) and AI (0.57). However, we did not observe a statistically significant difference between any of the three fields (Kruskal–Wallis test, Table 3).
FIG. 8.
Spectral bandwidth comparison (Q10 and BW10) between fields AI, R, and RT. A: distribution of Q10 values in AI, R, and RT. B: comparison of BF and Q10 values. Solid/dashed lines indicate the median Q10 values within a 1-octave BF range. C: distribution of BW10 values in AI, R, and RT. D: comparison of BF and BW10 values. Solid/dashed lines indicate the median BW10 values within a 1-octave BF range. One AI neuron with a BW10 value >2.5 is not shown in this plot.
Differences between core fields in pure-tone–response latencies
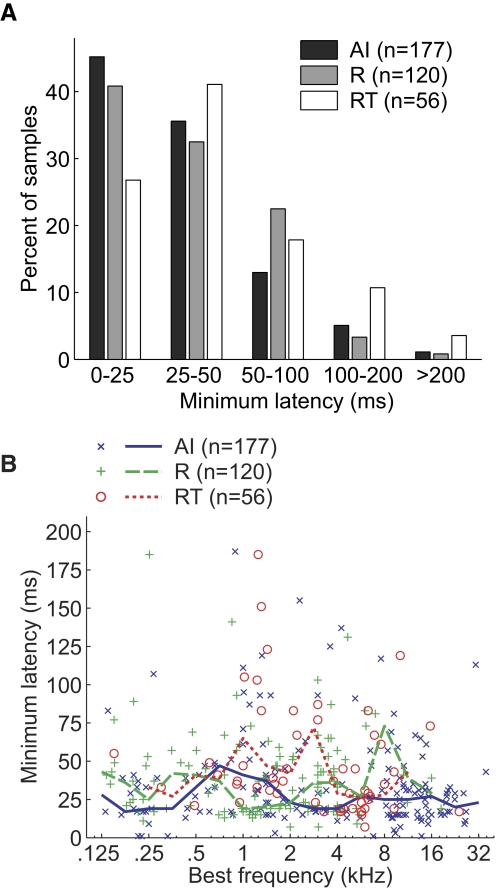
Figures 9 and 10 show the minimum and peak response latencies to pure-tone stimuli, respectively, for neurons in the three core fields. We compared minimum response latencies between areas using neurons across all BFs (Fig. 9A) and found that both R and RT had a significantly longer minimum latency than that of AI (Tukey's HSD test, P < 0.05, Table 3). No significant difference in minimum latency was observed between R and RT (Tukey's HSD test, P = 0.22). Figure 9B shows the distribution of minimum response latency across BFs in the three core fields. In fields R and AI, we did not observe a statistically significant correlation between BF and minimum latency (Spearman correlation coefficient: AI, P = 0.07; R, P = 0.98) and only a marginally significant correlation in field RT (Spearman correlation coefficient, r = −0.27, P = 0.04).
FIG. 9.
Minimum response latencies in the 3 core fields. A: distribution of minimum pure-tone–response latencies of neurons in AI, R, and RT. B: minimum response latency and BF of individual neurons. Five neurons [AI (2), R(1), RT (2)] are not shown on the plot because their minimum latency is >200 ms. Solid/dashed lines plot median minimum latency within a 1-octave BF range.
FIG. 10.
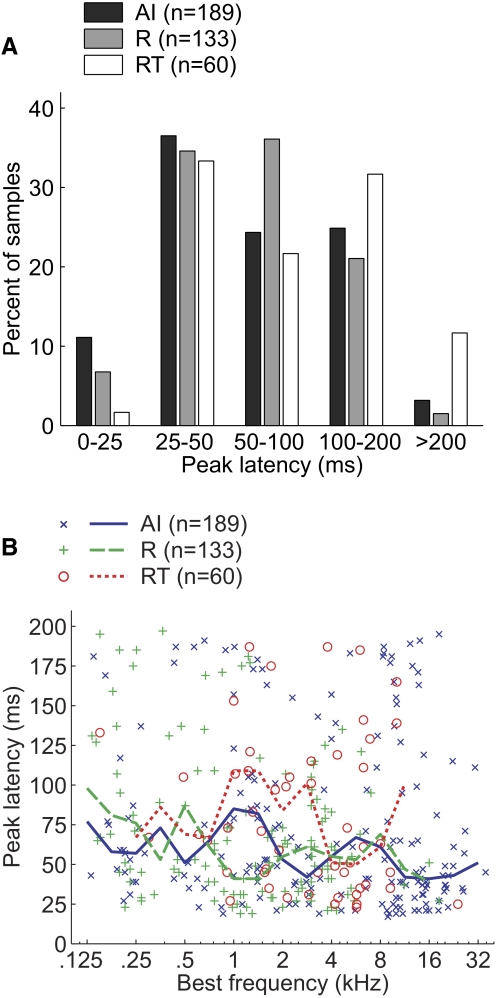
Peak response latencies in the 3 core fields. A: distribution of peak pure-tone–response latencies of neurons in AI, R, and RT. B: peak latency of individual neurons compared with BF. Fifteen neurons [AI (6), R(2), RT (7)] are not shown on the plot because their peak latency is >200 ms. Solid/dashed lines plot median peak latency within a 1-octave BF range.
Figure 10A shows the distribution of peak response latencies in the three core fields. Peak latencies did show a significant correlation with BF in both AI and R (Spearman correlation coefficient: AI: r = −0.2, P < 0.004; R: r = −0.2, P < 0.02), but not in RT (Spearman correlation coefficient, P = 0.24; see Fig. 10B). We therefore limited our core field comparisons of peak latencies to neurons with BFs in the range of 1 to 16 kHz. No significant correlation between BF and peak latency was observed in this range of BFs (Spearman correlation coefficient, P > 0.05). We observed that within this range of BFs, only R and RT showed a significant difference in peak latency (Tukey's HSD test, P < 0.05; see Table 3). Therefore RT had both the longest minimum and peak latency of the three core fields. Field R had a significantly longer minimum latency (but not peak latency) compared with that of field AI.
Persistent activity and response duration in the three core fields
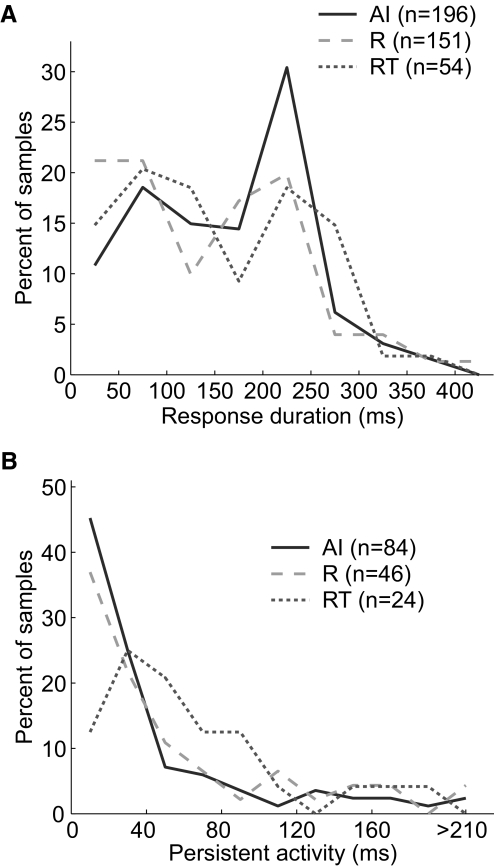
Figure 11 A shows the distribution of pure-tone–response durations in the three core fields. Only responses to 200-ms tones were used and the response duration was measured from the onset of the stimulus. Although field AI had the lowest proportion of onset responses to pure tones, we did not observe a statistically significant difference in response duration between any of the three fields (Kruskal–Wallis test, Table 3).
FIG. 11.
Response duration and persistent activity. A: distribution of response duration in AI, R, and RT. B: distribution of persistent activity in AI, R, and RT.
Figure 11B shows the distribution of persistent activity to pure tones in the three core fields. Persistent activity was defined as the duration of significant activity following the offset of the stimulus, after the minimum response latency was subtracted (see methods). Only neurons with significant sustained discharge rates throughout the entire stimulus were included in this analysis. We observed that field RT had longer duration persistent activity than that of either of the two other fields (Fig. 11B). However, the only statistically significant difference in persistent activity was between fields AI and RT (Tukey's HSD test, P < 0.05; see Table 3).
Responses to sinusoidally amplitude modulated tones in the three core fields
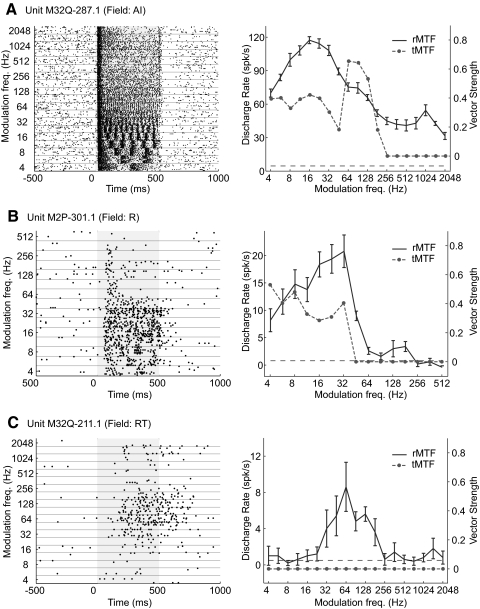
Figure 12 shows examples of single-unit responses to sAM stimuli recorded from three core fields. The example AI neuron (Fig. 12A) responds over a wide range of modulation frequencies, exhibiting stimulus-synchronized discharges at modulation frequencies ≤181 Hz. The example of a field R neuron shown in Fig. 12B is more limited in the range of modulation frequencies to which it responds. Compared with the AI example (Fig. 12A), the field R neuron has an upper limit of stimulus synchronization that is lower (only ≤32 Hz) and a more narrow range of modulation frequencies evoking a significant discharge rate. In Fig. 12C, the example field RT neuron does not stimulus synchronize to any modulation frequency tested and encodes an even narrower range of modulation frequencies with its firing rate. These single-unit examples illustrate a decrease in the upper limit of stimulus synchronization as well as the bandwidth of the firing-rate–based modulation transfer function (rMTF) between fields AI, R, and RT. In addition, from these examples we can see an increase in the latency and persistent activity in R and RT relative to AI.
FIG. 12.
Individual neuron responses to sinusoidally amplitude modulated (sAM) tones. Raster plots (left) and firing-rate–based modulation transfer function (rMTF)/temporal modulation transfer function (tMTF) plots (right) for 3 neurons. The stimulus is presented during the shaded portion of the raster plot (0–500 ms). The horizontal dashed line in the rMTF/tMTF plot indicates the criteria for a significant firing rate (see methods). The error bars in the rMTF plot indicate the SE. A: synchronized unit example from AI (Unit M32Q-287.1). B: synchronized unit example from R (Unit M2P-301.1). C: nonsynchronized unit example from RT (Unit M32Q-211.1).
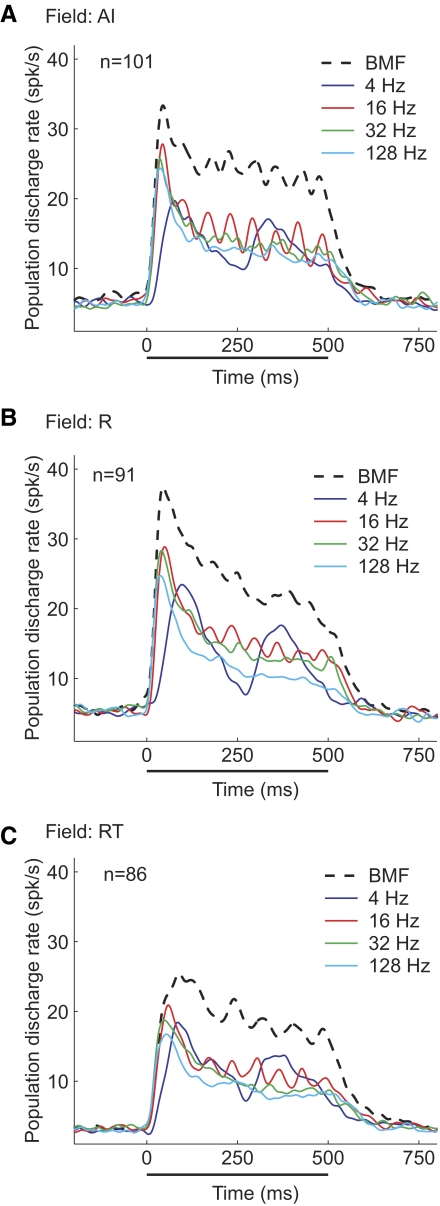
Figure 13 compares overall discharge patterns of responses to sAM stimuli in the three core fields. When the responses of all neurons in each core auditory field (AI, R, and RT) were averaged together, we observed two main trends (Fig. 13). First, the stimulus synchronization of the RT and R populations was slightly weaker than that of the AI population. At a modulation frequency of 32 Hz, stimulus synchronization was clearly observable in the AI population (Fig. 13A) but not in either the R population (Fig. 13B) or the RT population (Fig. 13C). Second, the population-averaged responses to each neuron's rate-based best modulation frequency (rBMF) were significantly higher than averaged responses to any other modulation frequency (Fig. 13).
FIG. 13.
Population discharge patterns to sAM tones. Average PSTHs for a 4-, 16-, 32-, and 128-Hz modulation frequency as well as the modulation frequency evoking the peak response (rate-based best modulation frequency [rBMF]), shown for the AI (A), R (B), and RT (C) populations. The sAM tone is played from 0 to 500 ms on the plot (indicated by the solid bar).
Comparing stimulus synchronization between AI, R, and RT
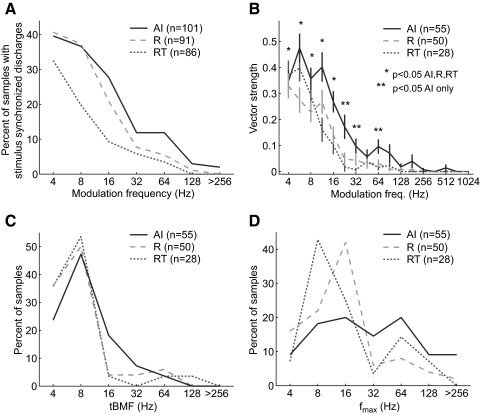
Figure 14 analyzes the temporal response properties of the AI, R, and RT populations. Figure 14A shows that at modulation frequencies >8 Hz, the percentage of sampled neurons with significant stimulus synchronization (Rayleigh statistic, P < 0.001) decreased not only between AI and R, but also between R and RT. Below 8 Hz, the difference was seen only between RT and the other two fields (Fig. 14A). Field RT also had a larger percentage of nonsynchronized neurons (67%) than that of either AI (46%) or R (45%) (see Table 4). We use the term “nonsynchronized” here to indicate that a neuron did not synchronize to any tested modulation frequency between 4 and 512 Hz.
FIG. 14.
Temporal response properties of neurons in AI, R, and RT. A: percentage of samples with stimulus locked discharges in AI, R, and RT. B: average vector strength of AI, R, and RT populations. Average vector strengths significantly different from zero (Wilcoxon rank-sum test, Bonferroni corrected, P < 0.05) are indicated. C: distribution of temporal best modulation frequencies (tBMFs) in AI, R, and RT. D: distribution of the stimulus synchronization limit (fmax) in AI, R, and RT.
TABLE 4.
Percentage of nonsynchronized neurons in each core field
| Subject | AI | R | RT |
|---|---|---|---|
| 1 | 37/63 (59%) | 34/74 (46%) | 33/55 (60%) |
| 2 | 9/38 (24%) | 7/17 (41%) | 25/31 (81%) |
| Total | 46/101 (46%) | 41/91 (45%) | 58/86 (67%) |
Figure 14B shows the average vector strengths of the three core fields for modulation frequencies tested between 4 and 1,024 Hz. In all three areas, average vector strength decreased as modulation frequency increased. The AI population had an average vector strength that was significantly greater than zero for modulation frequencies as high as 64 Hz, whereas both the R and RT populations had significant vector strengths only at modulation frequencies as high as 16 Hz (Wilcoxon rank-sum test, P < 0.05, Bonferroni corrected) (Fig. 14B). We next compared the temporal best modulation frequencies (tBMFs) of neurons in the three auditory fields (Fig. 14C). We observed that the only significant difference in the distributions of tBMFs was between AI and RT (Kolmogorov–Smirnov test, P < 0.05). However, the median tBMFs were not significantly different between any of the three core fields (Kruskal–Wallis test, P > 0.05; see Table 3 and Fig. 14C). We also computed the maximum stimulus synchronization frequency (fmax) of each neuron and compared the fmax distributions between the three core fields (Fig. 14D). We observed that only AI and R had a significantly different median fmax (Tukey's HSD test, P < 0.03). However, nonsynchronized neurons were not included in these analyses shown in Fig. 14. Given that RT has a higher percentage of nonsynchronized neurons, inclusion of these neurons in the analyses of average vector strength, tBMF, and fmax would yield even larger differences between RT and the other two core areas. For instance, with the inclusion of nonsynchronized neurons in the analysis of fmax, we found that the median stimulus synchronization was significantly lower in RT than that in both AI and R (Tukey's HSD test, P < 0.03; see Table 3).
Comparing rate coding properties between AI, R, and RT
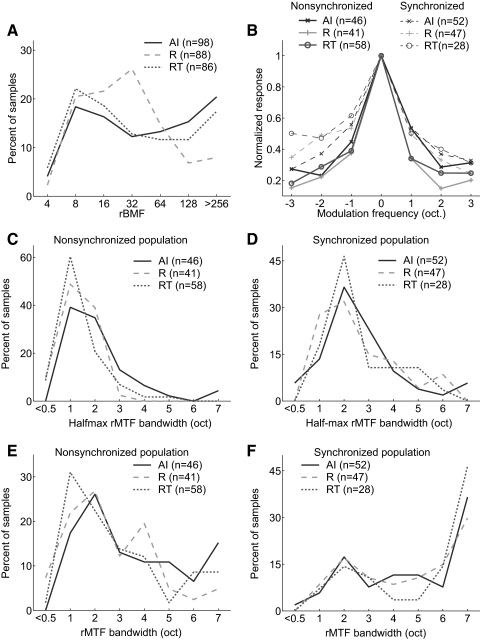
We did not observe a significant difference in the distribution of the rate-based best modulation frequencies (rBMFs) between any of the three fields (Kruskal–Wallis test; Table 3, Fig. 15 A). We next analyzed modulation transfer function (MTF) bandwidths (see methods) using both the full bandwidth (calculated using all modulation frequencies with significant firing rates) and the half-maximum bandwidth (using all modulation frequencies with firing rates greater than half the peak firing rate). We observed that the average half-maximum bandwidth of the MTF was significantly less in RT than that in AI (Tukey's HSD test, P < 0.002; Table 3). When the full bandwidth was calculated using all significant firing rates within the MTF, we observed a similar trend; however, there was no statistically significant difference between any of the three fields (Kruskal–Wallis test; Table 3). When we analyzed synchronized and nonsynchronized neuronal populations separately, we observed that the tuning for the preferred modulation frequency was narrower for nonsynchronized neurons than for synchronized neurons, for both full bandwidth and half-maximum bandwidth values (Table 3, Fig. 15B). This difference was statistically significant in fields R and RT for half-maximum bandwidth (AI: P = 0.08; R: P < 2.0 × 10⁻⁵; RT: P < 9.3 × 10⁻⁷, Wilcoxon rank-sum test) and in all fields for full bandwidth comparisons (AI: P < 0.02; R: P < 5.3 × 10⁻⁵; RT: P < 9.2 × 10⁻⁶, Wilcoxon rank-sum test). Furthermore, among the nonsynchronized population, neurons in fields R and RT had narrower modulation frequency tuning than that in field AI. The median rMTF half-maximum bandwidth of nonsynchronized neurons in R (1.2) and RT (1.0) neurons was significantly less than that in field AI (1.9) (Tukey's HSD test, P < 0.05; Table 3, Fig. 15C). A similar trend was observed for the median rMTF full bandwidth, but no statistically significant difference between fields was observed (Fig. 15E, Table 3). We did not observe a significant difference between any of the auditory fields for either the median rMTF half-maximum or full bandwidth when only the synchronized populations were compared (Kruskal–Wallis test; Table 3, Fig. 15, D and F). We also calculated the Q-values of rMTFs (rBMF divided by the rMTF full bandwidth). Field RT had the highest mean Q-value (0.54) and Q-values were significantly higher in the nonsynchronized population compared with those in the synchronized populations in all three fields (AI: P < 0.02; R: P < 1.8 × 10⁻⁴; RT: P < 5.7 × 10⁻⁶, Wilcoxon rank-sum test; see Table 3). No statistically significant difference in rMTF Q-values was observed between fields for either synchronized or nonsynchronized neurons (Kruskal–Wallis test; see Table 3).
FIG. 15.
Firing rate response properties of neurons in AI, R, and RT to sAM tones. A: distribution of rBMFs in AI, R, and RT. B: normalized responses of AI, R, and RT population to a sAM tone's modulation frequency (normalized by the rBMF). Synchronized population (dashed), nonsynchronized population (solid). C: half-maximum bandwidth of rMTFs for AI, R, and RT nonsynchronized populations. D: half-maximum bandwidth of rMTFs for AI, R, and RT synchronized populations. E: full bandwidth of rMTFs for AI, R, and RT nonsynchronized populations. F: full bandwidth of rMTFs for AI, R, and RT synchronized populations.
Correlation between synchronization and response latency
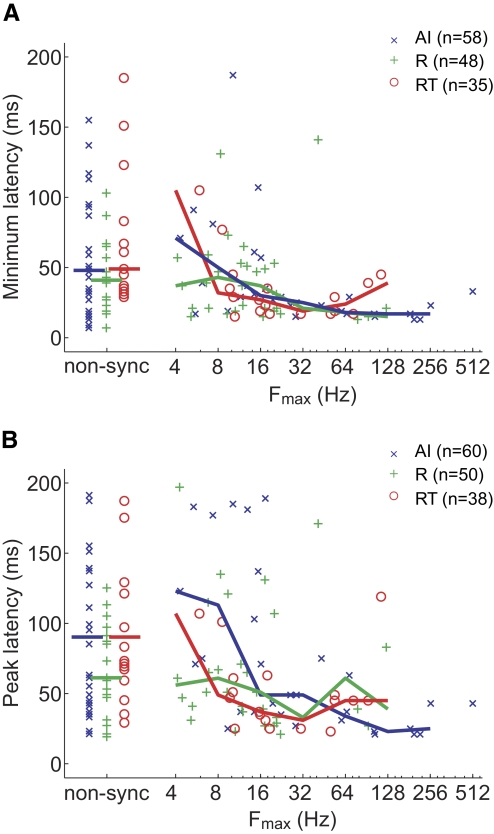
Figure 16 shows that the minimum and peak response latencies to pure tones vary with fmax. All three areas had a negative Spearman correlation coefficient between fmax and response latency (see Table 5). Fields AI and RT both showed a statistically significant correlation between minimum latency and fmax as well as between peak latency and fmax (Spearman correlation coefficient, P < 0.004; Table 5). Field R did not show a significant correlation between either type of response latency and fmax (P > 0.34; Table 5). We also analyzed the correlation between response latency and both the tBMF and rBMF. We did not observe a significant correlation between either the minimum latency and rBMF or the peak latency and rBMF for any of the three fields (Spearman correlation coefficient, P > 0.15). Field AI was the only core field to have a significant correlation (P < 0.05) between the peak latency and tBMF. We did not observe a significant correlation between the minimum latency and tBMF (P > 0.05) for any of the three fields.
FIG. 16.
Comparison of response latency with stimulus synchronization limit (fmax). Median values are indicated by the plotted line. A: minimum latency vs. stimulus synchronization limit (fmax): 2 AI nonsync and 2 RT nonsync units not shown in the plot have minimum latencies >200 ms. B: peak latency vs. stimulus synchronization limit (fmax): 4 AI nonsync, 1 R sync, and 5 RT nonsync units not shown in the plot have peak latencies >200 ms.
TABLE 5.
Spearman correlation coefficient of synchronization limit (fmax) and latency
| Subject | AI | R | RT |
|---|---|---|---|
| Minimum latency | r = −0.38; P = 3.3 × 10⁻³ | r = −0.14; P = 0.35 | r = −0.60; P = 1.4 × 10⁻⁴ |
| (n = 58) | (n = 48) | (n = 35) | |
| Peak latency | r = −0.40; P = 1.6 × 10⁻³ | r = −0.12; P = 0.43 | r = −0.53; P = 6.2 × 10⁻⁴ |
| (n = 60) | (n = 50) | (n = 38) |
DISCUSSION
In this report, we used single-unit recordings in awake marmoset monkeys to map three tonotopically organized, pure-tone–responsive auditory cortical areas. The tonotopic organization of fields AI and R have been reported previously in owl monkeys (Imig et al. 1977; Morel and Kaas 1992) and macaque monkeys (Merzenich and Brugge 1973; Morel et al. 1993; Petkov et al. 2006; Scott 2004). Field AI is generally observed to be organized from low to high best frequencies along the rostrolateral to caudomedial axis, although previous reports on the direction of the tonotopic gradient in field R have been more variable. The caudolateral to rostromedial direction of the tonotopic gradient (low to high best frequencies) reported here is similar to what has been observed in the macaque monkey (Merzenich and Brugge 1973; Morel et al. 1993; Petkov et al. 2006; Scott 2004). The organization of AI in our study was similar to that of earlier reports describing marmoset AI (Aitkin et al. 1986)—i.e., that there was a fan-shaped organization of frequency contours with a disproportionate amount of AI devoted to frequencies between 2 and 16 kHz (Figs. 2 and 3). Also, similar to Aitkin et al. (1986), we observed that the lowest sound level thresholds occurred for BFs between 7 and 9 kHz (Fig. 6A); however, thresholds were slightly lower in our study, most likely due to differences in methodologies (free vs. closed field stimulus delivery, awake vs. anesthetized preparation). Our results also confirm previous reports of a field RT in owl monkeys (Morel and Kaas 1992) and macaque monkeys (Petkov et al. 2006). Although the core fields (AI, R, and RT) each receive leminiscal thalamic inputs (via vMGB) and share architectonic properties such as a prominent granular layer, there has been some uncertainty whether field RT should be considered part of the core. However, the preference for narrowband sound—such as pure tones and amplitude-modulated tones as well as the resulting tonotopicity shared by all three areas—supports an organizational model of primate auditory cortex where the core consists of three fields: AI, R, and RT. In humans, only fields AI and R have been identified thus far, and field R is observable only using higher-resolution-imaging techniques (Formisano et al. 2003). Field RT is likely more difficult to image in humans due to its small size and its poorer response to tones compared with AI and R.
Comparison with previous studies in awake primate auditory cortex
Previous results by Recanzone et al. (2000) in macaque monkeys show that AI and R differ in their peak firing rates, minimum response latency to pure tones, spectral tuning bandwidth, and best intensities, but not in their spontaneous firing rates, thresholds, and peak response latency. Similar to Recanzone et al. (2000), we observed no significant difference between auditory fields with respect to their mean spontaneous rate (current study: 6.0 ± 7.9 spike/s; Recanzone et al.: 8.2 ± 12.1 spikes/s; see Fig. 5). We also observed that field AI had greater peak firing rates to tones than did field R (current study: AI = 30.5 ± 28.2, R = 25.7 ± 29.0; Recanzone et al.: AI = 39.3 ± 33.3, R = 18.6 ± 17.9; see Fig. 5). Unlike Recanzone et al., however, we subtracted the mean spontaneous rate from our calculation of the driven firing rate. Keeping this in mind, our AI firing rates are similar, but our recordings in field R yielded higher mean peak firing rates than those in the study by Recanzone et al. (2000).
We also observed that the minimum response latency, but not peak response latency, was significantly different between AI and R (Figs. 9 and 10, Table 3). Our mean minimum latencies for fields AI and R were similar to those reported by Recanzone et al. (2000) (current study: AI = 39.6 ± 55.9, R = 41.3 ± 33.9; Recanzone et al.: AI = 32.4 ± 13.6, R = 41.9 ± 13.9; see Fig. 9). The SDs are larger in our study, most likely due to the difference in stimulus duration between the two studies (Recanzone et al. used 50-ms stimuli, whereas we used a duration ≥200 ms). Because the stimulus duration used in each study differed, it is difficult to directly compare our measurements of peak latency (even though both studies found a nonsignificant difference between AI and R).
Recanzone et al. (2000) reported that the mean best sound level of neurons in R was lower than that in AI, and that a higher percentage of field R neurons had nonmonotonic rate-level functions compared with that in AI. When we restricted our analysis to neurons with mid-frequency BFs, to eliminate a frequency bias in our data, we observed that the mean best sound levels in AI and R were not significantly different (current study: AI = 42.5 ± 23.4, R = 48.3 ± 24; Recanzone et al.: AI = 59.5 ± 17.5, R = 49.8 ± 16.5; see Fig. 7). Although we did not observe a significant difference in best sound level between AI and R, we did observe that RT (33.8 ± 24.1) had a significantly lower mean best sound level than that of both AI and R (Table 3, Fig. 7B). Unlike the study by Recanzone et al. we did not see a difference in the monotonicity index (referred to in that study as the firing rate index) between AI and R (current study: AI = 0.42 ± 0.49, R = 0.44 ± 0.51; Recanzone et al.: AI = 0.83 ± 0.18, R = 0.72 ± 0.29; see Fig. 8C). However, we did observe a significant difference between field RT (0.26 ± 0.47) and both fields R and AI (Table 3, Fig. 7C). It is important to note that we observed a lower mean monotonicity index in AI and R than did Recanzone et al. (2000), indicating that we observed more nonmonotonic rate-level functions overall in AI, R, and RT in our study. This may be due to differences in search stimuli (tone duration and level) and recording protocols. Furthermore, unlike Recanzone et al. (2000), we subtracted the mean spontaneous rate during our calculation of the monotonicity index, resulting in index values that can be <0. However, when the monotonicity index was calculated without subtracting the mean spontaneous rate, we still found lower values in all three core fields (AI = 0.56 ± 0.36, R = 0.57 ± 0.38, RT = 0.41 ± 0.36) compared with the results from Recanzone et al. (2000). There was no difference in thresholds between AI and R in this study, matching the results by Recanzone et al. (current study: AI = 17.9 ± 17.6, R = 23.9 ± 21.6; Recanzone et al.: AI = 39.7 ± 22.4, R = 43.4 ± 28.2; see Fig. 6). Mean sound level thresholds were lower by about 20 dB in this study, although this is mainly attributed to the fact that we analyzed neurons with BFs ranging only from 1 to 16 kHz, which have lower thresholds than those of neurons with BFs outside this frequency range.
Recanzone et al. (2000) also reported that spectral bandwidths are narrower in field R than in AI (smaller BW10 values and larger Q10 values). We did not observe a significant difference in the BW10 or Q10 values between any of the three fields (Fig. 8, Table 3). Differences can arise out of sampling biases in the best frequencies of neurons, given the correlation observed between Q10 and BF. In our experiment protocol, we did not measure frequency response areas (FRAs) for each neuron; rather we measured frequency tuning at only a single sound level, typically 10–30 dB above threshold for monotonic neurons and at the best sound level for nonmonotonic neurons. Therefore only for a subset of neurons were we able to obtain Q10 and BW10 values, limiting our sample size. It is possible that with a larger sample of neurons we would see larger differences in spectral tuning bandwidths between the three fields. The mean BW10 values reported in our study are roughly double those reported by Recanzone et al. (current study: AI = 0.83 ± 0.81, R = 0.59 ± 0.55; Recanzone et al.: AI = 0.43 ± 0.50, R = 0.31 ± 0.25; see Fig. 8, C and D). Marmosets have significantly smaller cochleae than those of macaque monkeys and, as such, may have poorer spectral resolvability on their basilar membranes.
For practical and ethical reasons, we could not use a large number of subjects in these experiments—thus some caution should be exercised while interpreting these results. For example, although field RT had a higher number of nonsynchronized neurons than that of the other two fields, this effect was largely due to the second subject (Table 4). It is important to note that the field R data from Recanzone et al. (2000) is from only a single subject, and so a similar degree of caution is warranted for interpreting our comparisons between Recanzone et al. (2000) and the current study.
Potential homologies of auditory areas between primate and nonprimate species
The organization of auditory cortex into core and belt regions appears to be unique to primates. Like primates, however, nonprimate mammalian species have several primary- like or secondary auditory fields in addition to primary auditory cortex; it thus remains possible that the function of these fields has been conserved through evolution. Although we cannot determine the functional role of each auditory field with our data, similar trends in response properties between primary auditory cortex and primary-like auditory fields in other species can indicate which auditory fields are potentially homologous (or functionally similar).
The anterior auditory field (AAF) and posterior auditory fields in cats (PAF and VPAF) and ferrets (PPF and PSF) are tonotopically organized, tone-responsive, primary-like fields. Response latencies are longer in the posterior fields and shorter in the anterior field compared with AI (Bizley et al. 2005; Kowalski et al. 1995). Furthermore, in cats the AAF has equal or better stimulus synchronization to temporally modulated sounds compared with that of AI, whereas stimulus synchronization decreases in both posterior fields (Eggermont 1998; Imaizumi et al. 2004; Joris et al. 2004; Schreiner and Urbas 1988). These data suggest that with respect to temporal processing, the two rostral fields in marmosets are more likely to be functionally similar to the posterior fields in cats and ferrets compared with the anterior field. The remaining field in primate auditory cortex that is tone responsive is the caudal–medial field (CM). Field CM has response properties that differ from the rostral fields: i.e., a shorter response latency than that of AI and thus it appears to be more similar to the anterior field than the posterior fields in cats and ferrets (Kajikawa et al. 2005). However, at least one potential issue with assigning a strict homology between these two fields is that AAF receives vMGB input (Bizley 2005; Winer and Lee 2007), but CM does not (De la Mothe et al. 2006b). Field CM does receive a major input from the anterior dorsal division of the medial geniculate body (MGad), which may also be part of the lemniscal pathway (De la Mothe et al. 2006b). In cats, AAF receives a major input from the rostral pole of the medial geniculate body (RP) (Lee et al. 2004), which shares some anatomical properties with MGad in primates (Jones 1997). Similar functional properties in AAF and CM may still arise even if there are some differences in thalamic inputs, as long as the primary thalamic inputs for both CM and AAF are from the lemniscal pathway. Another important point to consider is that we are comparing data between awake primates and anesthetized nonprimate species. Temporal response properties such as synchronization and response latency are effected by anesthesia (Pandya et al. 2008; Ter-Mikaelian et al. 2007; Wang et al. 2005) and therefore species comparisons need to be done using awake subjects.
Monotonic versus nonmonotonic rate codes
We have previously shown a differential encoding of acoustic flutter between AI and the two rostral core fields (R and RT) (Bendor and Wang 2007). Here we studied rate and temporal representations of sAM tones in the three core fields over a wider range of temporal modulation rates, which extended beyond the perceptual range of acoustic flutter. We observed a degraded temporal representation of modulation frequency in the rostral fields compared with AI (Table 3, Fig. 14B), matching the observations by Bendor and Wang (2007). However, the rate coding strategy used by the auditory cortex appears to differ between the two studies. In Bendor and Wang (2007), roughly two thirds of neurons encountered changed their firing rate monotonically over the range of acoustic flutter. In this study, although we encountered both monotonically and nonmonotonically tuned neurons, the rMTF became more sharply tuned in the rostral fields. This supports a model of nonmonotonic or unimodal rate coding for modulation frequency, potentially in the form of a modulation frequency filter bank (Dau et al. 1997a,b). In fact, the mean rMTF Q-values in the nonsynchronizing population in fields R (0.91) and RT (0.98), the cortical areas with the sharpest tuning for modulation frequency, match the modulation frequency filter bandwidth estimated in human psychophysical experiments (Sek and Moore 2003). An alternative explanation is that the sharpening of tuning curves acts to increase its slope, providing a great dynamic range for a slope-based neural code. The mean rMTF full bandwidths in all three areas were >3.5 octaves, which is sufficient for either a slope- or peak-based neural code for the entire perceptual range of flutter, which is only slightly >2 octaves (10–45 Hz). However, monotonic nonsynchronized rate coding of an acoustic pulse train's repetition rate in the mid-to-lower range of pitch (30–330 Hz) has also been observed in both AI (Lu et al. 2001) and the rostral fields (unpublished observations). Unlike flutter encoding neurons that have monotonic responses >2 octaves, these neurons can have monotonic responses >4–5 octaves, which is higher than the mean rMTF full bandwidth observed in nonsynchronized neurons (AI = 3.5, R = 2.7, RT = 2.8; Table 3). Do both monotonic and nonmonotonic rate-coding neurons coexist or do neurons switch between these two types of neural codes depending on the stimulus (sAM tones vs. acoustic pulse trains)?
Previous studies that have reported monotonic rate coding of repetition rate in sensory cortical areas have all used pulse trains (acoustic or tactile), a stimulus that does not change its pulse width as the repetition rate changes (Bendor and Wang 2007; Lu et al. 2001; Salinas et al. 2000). In this study we used sAM tones, an acoustic stimulus that is more commonly used in experiments studying the temporal processing of auditory neurons. However, the crucial difference between acoustic pulse trains and sAM tones is that sAM tones have wider pulses and narrower spectral bandwidths at lower modulation frequencies. Therefore if neurons are sensitive to one of these parameters in addition to repetition rate, responses could potentially switch between monotonic and nonmonotonic depending on the acoustic stimulus.
If both monotonic (slope-based) and nonmonotonic (peak-based) rate coding coexist in auditory cortex, they may each serve a unique function for encoding repetition rate. Each population may provide a neural encoding advantage depending on the stimulus signal-to-noise ratio (Butts and Goldman 2006) or behavioral constraints related to the downstream stimulus-evoked motor responses (Salinas 2006). Monotonic coding may be advantageous for making comparisons (higher or lower) between two repetition rates (Machens et al. 2005), whereas nonmonotonic (unimodal) coding may be advantageous for determining whether two repetition rates are the same or different (categorization tasks). In prefrontal cortex, monotonic rate coding has been observed for comparison tasks along a continuous parametric space (Romo et al. 1999), whereas nonmonotonic rate coding has been observed for discrete categorization tasks (Freedman et al. 2001; Nieder et al. 2002). Even minor differences in a behavioral task can result in opposing neural coding interpretations. For instance, nonmonotonic (Nieder and Miller 2004) and monotonic tuning (Roitman et al. 2007) have both been suggested as the neural representation of numerosity in the lateral intraparietal (LIP) area in macaque monkeys.
Spectral and temporal processing pathways in primate auditory cortex
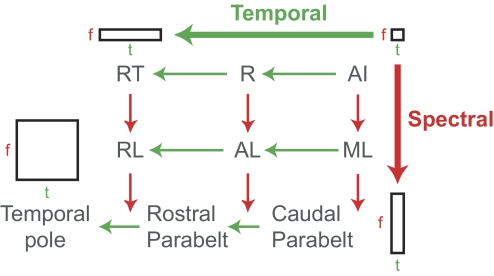
Previous data in primates suggest that lateral and rostral regions of auditory cortex are responsible for determining what a sound is, whereas caudal regions of auditory cortex are important for determining the spatial location of a sound's source (Romanski et al. 1999; Tian et al. 2001). The data presented here and in previous reports (Barbour and Wang 2003; Bendor and Wang 2007; Petkov et al. 2006; Rauschecker and Tian 2004; Rauschecker et al. 1995; Wessinger et al. 2001) provide evidence for a secondary division of the “what” pathway, in which spectral and temporal processing occur along the medial-to-lateral and caudal-to-rostral axis of auditory cortex, respectively. An increase in the temporal integration window along the caudal-to-rostral axis of auditory cortex decreases stimulus synchronization, creating a temporal-to-rate coding transformation for temporal information in the acoustic signal (Bendor and Wang 2007). A longer temporal integration window is necessary to detect more complex temporal features. Smaller temporal segments of such features could be initially processed by neurons with shorter temporal integration windows, after which the responses of these neurons could be summed together by neurons with larger temporal integration windows to detect the entire feature. Previous studies have suggested that the spectral integration window increases along the medial-to-lateral axis of the superior temporal gyrus, given that core fields respond to narrowband spectrums, whereas lateral and parabelt fields respond to only broadband spectrums (Barbour and Wang 2003; Petkov et al. 2006; Rauschecker and Tian 2004; Rauschecker et al. 1995). It is important to note that our use of the term “spectral integration” does not imply a larger pure-tone tuning bandwidth or multipeak tuning (Kadia and Wang 2003; Sutter and Schreiner 1991), but rather that the neuron's response requires multiple simultaneous spectral inputs. In this sense, a “spectral integration window” is a nonlinear spectral feature detector. Although one purpose of a larger spectral integration window could be spectral bandwidth discrimination, an additional and perhaps more important function would be the discrimination of different spectral shapes. In this way, the increase in the spectral integration window is analogous to the increased complexity and size of visual receptive fields at higher levels of the visual system (Connor et al. 2007).
We propose that the “what” pathway in primates can be further subdivided into temporal and spectral processing streams (originating from AI) along the caudal-to-rostral and medial-to-lateral axes, respectively, of the superior temporal gyrus (Fig. 17). According to this proposed model neurons in the temporal pole would possess the largest spectral and temporal integration window, thus acting as detectors for complex spectrotemporal features in vocalizations and other biologically relevant sounds (Poremba et al. 2004). In addition, according to this model, the pitch-processing region located anterolaterally from AI (Bendor and Wang 2005) would also be part of both the spectral and temporal processing pathways; however, the spectral and temporal integration windows would be smaller in size than those in the temporal pole. The results we present in this report support the model of a temporal processing pathway along the caudal-to-rostral axis of the core. Future experiments will be needed to determine whether similar temporal processing pathways exist along the caudal-to-rostral axis of auditory cortex in secondary areas (e.g., lateral belt). Furthermore, this model's prediction that the change in stimulus synchronization (for similar acoustic signals) would change minimally between neighboring regions of core and lateral belt along the medial-to-lateral axis of auditory cortex will need to be verified in future experiments.
FIG. 17.
Proposed model of spectral and temporal processing pathways in primate auditory cortex. In the proposed model, the temporal processing pathway is in the caudal-to-rostral axis, where AI has the smallest temporal integration window and this temporal integration window increases in R and RT. The spectral processing pathway is in the medial-to-lateral axis, where AI and the other core fields have the smallest spectral integration window, and belt and parabelt areas have larger spectral integration windows. AI, primary auditory cortex; R, rostral field; RT, rostrotemporal field; ML, middle lateral field; AL, anterolateral field; RL, rostrolateral field; f, frequency, t, time.
GRANTS
This work was supported by National Institute on Deafness and Other Communication Disorders Grants DC-03180 to X. Wang and F31 DC-006528 to D. Bendor.
Acknowledgments
We thank A. Pistorio, J. Estes, Y. Zhou, E. Bartlett, and E. Issa for assistance with animal care; A. Pistorio for creating Fig. 1; and Y. Zhou and E. Issa for contributing data to the best-frequency maps.
The costs of publication of this article were defrayed in part by the payment of page charges. The article must therefore be hereby marked “advertisement” in accordance with 18 U.S.C. Section 1734 solely to indicate this fact.
REFERENCES
- Aitkin and Park 1993.Aitkin L, Park V. Audition and the auditory pathway of a vocal New World primate, the common marmoset. Prog Neurobiol 41: 345–367, 1993. [DOI] [PubMed] [Google Scholar]
- Aitkin et al. 1988.Aitkin LM, Kudo M, Irvine DR. Connections of the primary auditory cortex in the common marmoset, Callithrix jacchus jacchus. J Comp Neurol 8; 269: 235–248, 1988. [DOI] [PubMed] [Google Scholar]
- Aitkin et al. 1986.Aitkin LM, Merzenich MM, Irvine DR, Clarey JC, Nelson JE. Frequency representation in auditory cortex of the common marmoset (Callithrix jacchus jacchus). J Comp Neurol 252: 175–185, 1986. [DOI] [PubMed] [Google Scholar]
- Barbour and Wang 2003.Barbour DL, Wang X. Contrast tuning in auditory cortex. Science 299: 1073–1075, 2003. [DOI] [PMC free article] [PubMed] [Google Scholar]
- Bendor and Wang 2005.Bendor D, Wang X. The neuronal representation of pitch in primate auditory cortex. Nature 436: 1161–1165, 2005. [DOI] [PMC free article] [PubMed] [Google Scholar]
- Bendor and Wang 2007.Bendor D, Wang X. Differential neural coding of acoustic flutter within primate auditory cortex. Nat Neurosci 10: 763–771, 2007. [DOI] [PubMed] [Google Scholar]
- Bieser and Muller-Preuss 1996.Bieser A, Muller-Preuss P. Auditory responsive cortex in the squirrel monkey: neural responses to amplitude-modulated sounds. Exp Brain Res 108: 273–284, 1996. [DOI] [PubMed] [Google Scholar]
- Bizley 2005.Bizley JK Organization and Function of Ferret Auditory Cortex (PhD thesis). Oxford, UK: Univ. of Oxford, 2005.
- Bizley et al. 2007.Bizley JK, Nodal FR, Bajo VM, Nelken I, King AJ. Physiological and anatomical evidence for multisensory interactions in auditory cortex. Cereb Cortex 17: 2172–2189, 2007. [DOI] [PMC free article] [PubMed] [Google Scholar]
- Bizley et al. 2005.Bizley JK, Nodal FR, Nelken I, King AJ. Functional organization of ferret auditory cortex. Cereb Cortex 15: 1637–1653, 2005. [DOI] [PubMed] [Google Scholar]
- Brodmann 1909.Brodmann K Vergleichende Lokalisationslehre der Groβhirnrinde in ihren Prinzipien dargestellt auf Grund des Zellenbaues. Leipzig, Germany: Barth, 1909.
- Burman et al. 2006.Burman KJ, Palmer SM, Gamberini M, Rosa MG. Cytoarchitectonic subdivisions of the dorsolateral frontal cortex of the marmoset monkey (Callithrix jacchus), and their projections to dorsal visual areas. J Comp Neurol 495: 149–172, 2006. [DOI] [PubMed] [Google Scholar]
- Butts and Goldman 2006.Butts DA, Goldman MS. Tuning curves, neuronal variability, and sensory coding. PLoS Biol 4: e92, 2006. [DOI] [PMC free article] [PubMed] [Google Scholar]
- Connor et al. 2007.Connor CE, Brincat SL, Pasupathy A. Transformation of shape information in the ventral pathway. Curr Opin Neurobiol 17: 140–147, 2007. [DOI] [PubMed] [Google Scholar]
- Dau et al. 1997a.Dau T, Kollmeier B, Kohlrausch A. Modeling auditory processing of amplitude modulation. I. Detection and masking with narrow-band carriers. J Acoust Soc Am 102: 2892–2905, 1997a. [DOI] [PubMed] [Google Scholar]
- Dau et al. 1997b.Dau T, Kollmeier B, Kohlrausch A. Modeling auditory processing of amplitude modulation. II. Spectral and temporal integration. J Acoust Soc Am 102: 2906–2919, 1997b. [DOI] [PubMed] [Google Scholar]
- De la Mothe et al. 2006a.De la Mothe LA, Blumell S, Kajikawa Y, Hackett TA. Cortical connections of the auditory cortex in marmoset monkeys: core and medial belt regions. J Comp Neurol 496: 27–71, 2006a. [DOI] [PubMed] [Google Scholar]
- De la Mothe et al. 2006b.De la Mothe LA, Blumell S, Kajikawa Y, Hackett TA. Thalamic connections of the auditory cortex in marmoset monkeys: core and medial belt regions. J Comp Neurol 496: 72–96, 2006b. [DOI] [PMC free article] [PubMed] [Google Scholar]
- Eggermont 1998.Eggermont JJ Representation of spectral and temporal sound features in three cortical fields of the cat: similarities outweigh differences. J Neurophysiol 80: 2743–2764, 1998. [DOI] [PubMed] [Google Scholar]
- Formisano et al. 2003.Formisano E, Kim DS, Di Salle F, van de Moortele PF, Ugurbil K, Goebel R. Mirror-symmetric tonotopic maps in human primary auditory cortex. Neuron 40: 859–869, 2003. [DOI] [PubMed] [Google Scholar]
- Freedman et al. 2001.Freedman DJ, Riesenhuber M, Poggio T, Miller EK. Categorical representation of visual stimuli in the primate prefrontal cortex. Science 291: 312–316, 2001. [DOI] [PubMed] [Google Scholar]
- Hackett et al. 2001.Hackett TA, Preuss TM, Kaas JH. Architectonic identification of the core region in auditory cortex of macaques, chimpanzees, and humans. J Comp Neurol 441: 197–222, 2001. [DOI] [PubMed] [Google Scholar]
- Hackett et al. 1998a.Hackett TA, Stepniewska I, Kaas JH. Thalamocortical connections of the parabelt auditory cortex in macaque monkeys. J Comp Neurol 400: 271–286, 1998a. [DOI] [PubMed] [Google Scholar]
- Hackett et al. 1998b.Hackett TA, Stepniewska I, Kaas JH. Subdivisions of auditory cortex and ipsilateral cortical connections of the parabelt auditory cortex in macaque monkeys. J Comp Neurol 394: 475–495, 1998b. [DOI] [PubMed] [Google Scholar]
- Imaizumi et al. 2004.Imaizumi K, Priebe NJ, Crum PA, Bedenbaugh PH, Cheung SW, Schreiner CE. Modular functional organization of cat anterior auditory field. J Neurophysiol 92: 444–457, 2004. [DOI] [PubMed] [Google Scholar]
- Imig et al. 1977.Imig TJ, Ruggero MA, Kitzes LM, Javel E, Brugge JF. Organization of auditory cortex in the owl monkey (Aotus trivirgatus). J Comp Neurol 171: 111–128, 1977. [DOI] [PubMed] [Google Scholar]
- Jones 1997.Jones EG The relay function of the thalamus during brain activation. In: Thalamus, edited by Steriade M, Jones E, McCormick D. New York: Elsevier, 1997, p. 393–531.
- Joris et al. 2004.Joris PX, Schreiner CE, Rees A. Neural processing of amplitude-modulated sounds. Physiol Rev 84: 541–577, 2004. [DOI] [PubMed] [Google Scholar]
- Kaas and Hackett 2000.Kaas JH, Hackett TA. Subdivisions of auditory cortex and processing streams in primates. Proc Natl Acad Sci USA 97: 11793–11799, 2000. [DOI] [PMC free article] [PubMed] [Google Scholar]
- Kadia and Wang 2003.Kadia SC, Wang X. Spectral integration in A1 of awake primates: neurons with single- and multipeaked tuning characteristics. J Neurophysiol 89: 1603–1622, 2003. [DOI] [PubMed] [Google Scholar]
- Kajikawa et al. 2005.Kajikawa Y, de La Mothe L, Blumell S, Hackett TA. A comparison of neuron response properties in areas A1 and CM of the marmoset monkey auditory cortex: tones and broadband noise. J Neurophysiol 93: 22–34, 2005. [DOI] [PubMed] [Google Scholar]
- Kosaki et al. 1997.Kosaki H, Hashikawa T, He J, Jones EG. Tonotopic organization of auditory cortical fields delineated by parvalbumin immunoreactivity in macaque monkeys. J Comp Neurol 386: 304–316, 1997. [PubMed] [Google Scholar]
- Kowalski et al. 1995.Kowalski N, Versnel H, Shamma SA. Comparison of responses in the anterior and primary auditory fields of the ferret cortex. J Neurophysiol 73: 1513–1523, 1995. [DOI] [PubMed] [Google Scholar]
- Lee et al. 2004.Lee CC, Imaizumi K, Schreiner CE, Winer JA. Concurrent tonotopic processing streams in auditory cortex. Cereb Cortex 14: 441–451, 2004. [DOI] [PubMed] [Google Scholar]
- Liang et al. 2002.Liang L, Lu T, Wang X. Neural representations of sinusoidal amplitude and frequency modulations in the auditory cortex of awake primates. J Neurophysiol 87: 2237–2261, 2002. [DOI] [PubMed] [Google Scholar]
- Lu et al. 2001.Lu T, Liang L, Wang X. Temporal and rate representations of time-varying signals in the auditory cortex of awake primates. Nat Neurosci 4: 1131–1138, 2001. [DOI] [PubMed] [Google Scholar]
- Lu and Wang 2000.Lu T, Wang X. Temporal discharge patterns evoked by rapid sequences of wide- and narrowband clicks in the primary auditory cortex of cat. J Neurophysiol 84: 236–246, 2000. [DOI] [PubMed] [Google Scholar]
- Luethke et al. 1989.Luethke LE, Krubitzer LA, Kaas JH. Connections of primary auditory cortex in the New World monkey, Saguinus. J Comp Neurol 285: 487–513, 1989. [DOI] [PubMed] [Google Scholar]
- Machens et al. 2005.Machens CK, Romo R, Brody CD. Flexible control of mutual inhibition: a neural model of two-interval discrimination. Science 307: 1121–1124, 2005. [DOI] [PubMed] [Google Scholar]
- Mardia and Jupp 2000.Mardia KV, Jupp PE. Directional Statistics. New York: Wiley, 2000.
- Merzenich and Brugge 1973.Merzenich MM, Brugge JF. Representation of the cochlear partition of the superior temporal plane of the macaque monkey. Brain Res 50: 275–296, 1973. [DOI] [PubMed] [Google Scholar]
- Morel et al. 1993.Morel A, Garraghty PE, Kaas JH. Tonotopic organization, architectonic fields, and connections of auditory cortex in macaque monkeys. J Comp Neurol 335: 437–459, 1993. [DOI] [PubMed] [Google Scholar]
- Morel and Kaas 1992.Morel A, Kaas JH. Subdivisions and connections of auditory cortex in owl monkeys. J Comp Neurol 318: 27–63, 1992. [DOI] [PubMed] [Google Scholar]
- Nieder et al. 2002.Nieder A, Freedman DJ, Miller EK. Representation of the quantity of visual items in the primate prefrontal cortex. Science 297: 1708–1711, 2002. [DOI] [PubMed] [Google Scholar]
- Nieder and Miller 2004.Nieder A, Miller EK. A parieto-frontal network for visual numerical information in the monkey. Proc Natl Acad Sci USA 101: 7457–7462, 2004. [DOI] [PMC free article] [PubMed] [Google Scholar]
- Pandya et al. 2008.Pandya PK, Rathbun DL, Moucha R, Engineer ND, Kilgard MP. Spectral and temporal processing in rat posterior auditory cortex. Cereb Cortex 18: 301–314, 2008. [DOI] [PMC free article] [PubMed] [Google Scholar]
- Petkov et al. 2006.Petkov CI, Kayser C, Augath M, Logothetis NK. Functional imaging reveals numerous fields in the monkey auditory cortex. PLoS Biol 4: e215, 2006. [DOI] [PMC free article] [PubMed] [Google Scholar]
- Pistorio et al. 2004.Pistorio A, Hendry S, Wang X. Correlation between electrophysiology and anatomical markers in the auditory cortex of the common marmoset. Soc Neurosci Abstr 650: 13, 2004. [Google Scholar]
- Poremba et al. 2004.Poremba A, Malloy M, Saunders RC, Carson RE, Herscovitch P, Mishkin M. Species-specific calls evoke asymmetric activity in the monkey's temporal poles. Nature 427: 448–451, 2004. [DOI] [PubMed] [Google Scholar]
- Rauschecker and Tian 2004.Rauschecker JP, Tian B. Processing of band-passed noise in the lateral auditory belt cortex of the rhesus monkey. J Neurophysiol 91: 2578–2589, 2004. [DOI] [PubMed] [Google Scholar]
- Rauschecker et al. 1995.Rauschecker JP, Tian B, Hauser M. Processing of complex sounds in the macaque nonprimary auditory cortex. Science 268: 111–114, 1995. [DOI] [PubMed] [Google Scholar]
- Rauschecker et al. 1997.Rauschecker JP, Tian B, Pons T, Mishkin M. Serial and parallel processing in rhesus monkey auditory cortex. J Comp Neurol 382: 89–103, 1997. [PubMed] [Google Scholar]
- Recanzone et al. 2000.Recanzone GH, Guard DC, Phan ML. Frequency and intensity response properties of single neurons in the auditory cortex of the behaving macaque monkey. J Neurophysiol 83: 2315–2331, 2000. [DOI] [PubMed] [Google Scholar]
- Roitman et al. 2007.Roitman JD, Brannon EM, Platt ML. Monotonic coding of numerosity in macaque lateral intraparietal area. PLoS Biol 5: e208, 2007. [DOI] [PMC free article] [PubMed] [Google Scholar]
- Romanski et al. 1999.Romanski LM, Tian B, Fritz J, Mishkin M, Goldman-Rakic PS, Rauschecker JP. Dual streams of auditory afferents target multiple domains in the primate prefrontal cortex. Nat Neurosci 2: 1131–1136, 1999. [DOI] [PMC free article] [PubMed] [Google Scholar]
- Romo et al. 1999.Romo R, Brody CD, Hernandez A, Lemus L. Neuronal correlates of parametric working memory in the prefrontal cortex. Nature 399: 470–473, 1999. [DOI] [PubMed] [Google Scholar]
- Salinas 2006.Salinas E How behavioral constraints may determine optimal sensory representations. PLoS Biol 4: e387, 2006. [DOI] [PMC free article] [PubMed] [Google Scholar]
- Salinas et al. 2000.Salinas E, Hernandez A, Zainos A, Romo R. Periodicity and firing rate as candidate neural codes for the frequency of vibrotactile stimuli. J Neurosci 20: 5503–5515, 2000. [DOI] [PMC free article] [PubMed] [Google Scholar]
- Schreiner and Urbas 1988.Schreiner CE, Urbas JV. Representation of amplitude modulation in the auditory cortex of the cat. II. Comparison between cortical fields. Hear Res 32: 49–63, 1988. [DOI] [PubMed] [Google Scholar]
- Scott 2004.Scott BH Physiological Organization of Auditory Cortex in Awake Macaque (PhD thesis). New York: Center for Neural Science, New York Univ., 2004.
- Seiden 1957.Seiden HR Auditory Acuity of the Marmoset Monkeys (Hapale jacchus) (PhD thesis). Princeton, NJ: Princeton Univ., 1957.
- Sek and Moore 2003.Sek A, Moore BC. Testing the concept of a modulation filter bank: the audibility of component modulation and detection of phase change in three-component modulators. J Acoust Soc Am 113: 2801–2811, 2003. [DOI] [PubMed] [Google Scholar]
- Sutter and Schreiner 1991.Sutter ML, Schreiner CE. Physiology and topography of neurons with multipeaked tuning curves in cat primary auditory cortex. J Neurophysiol 65: 1207–1226, 1991. [DOI] [PubMed] [Google Scholar]
- Ter-Mikaelian et al. 2007.Ter-Mikaelian M, Sanes DH, Semple MN. Transformation of temporal properties between auditory midbrain and cortex in the awake Mongolian gerbil. J Neurosci 27: 6091–6102, 2007. [DOI] [PMC free article] [PubMed] [Google Scholar]
- Tian et al. 2001.Tian B, Reser D, Durham A, Kustov A, Rauschecker JP. Functional specialization in rhesus monkey auditory cortex. Science 292: 290–293, 2001. [DOI] [PubMed] [Google Scholar]
- Wang et al. 2005.Wang X, Lu T, Snider RK, Liang L. Sustained firing in auditory cortex evoked by preferred stimuli. Nature 435: 341–346, 2005. [DOI] [PubMed] [Google Scholar]
- Wessinger et al. 2001.Wessinger CM, VanMeter J, Tian B, Van Lare J, Pekar J, Rauschecker JP. Hierarchical organization of the human auditory cortex revealed by functional magnetic resonance imaging. J Cogn Neurosci 13: 1–7, 2001. [DOI] [PubMed] [Google Scholar]
- Winer and Lee 2007.Winer JA, Lee CC. The distributed auditory cortex. Hear Res 229: 3–13, 2007. [DOI] [PMC free article] [PubMed] [Google Scholar]
- Woods et al. 2006.Woods TM, Lopez SE, Long JH, Rahman JE, Recanzone GH. Effects of stimulus azimuth and intensity on the single-neuron activity in the auditory cortex of the alert macaque monkey. J Neurophysiol 96: 3323–3337, 2006. [DOI] [PubMed] [Google Scholar]


