Abstract
The central auditory system creates various types of neurons tuned to different acoustic parameters other than a specific frequency. The response latency of auditory neurons typically shortens with an increase in stimulus intensity. However, ∼10% of collicular neurons of the little brown bat show a “paradoxical latency-shift (PLS)”: long latencies to intense sounds but short latencies to weak sounds. These neurons presumably are involved in the processing of target distance information carried by a pair of an intense biosonar pulse and its weak echo. Our current studies show that collicular PLS neurons of the big brown bat are modulated by the corticofugal (descending) system. Electric stimulation of cortical auditory neurons evoked two types of changes in the PLS neurons, depending on the relationship in the best frequency (BF) between the stimulated cortical and recorded collicular neurons. When the BF was matched between them, the cortical stimulation did not shift the BFs of the collicular neurons and shortened their response latencies at intense sounds so that the PLS became smaller. When the BF was unmatched, however, the cortical stimulation shifted the BFs of the collicular neurons and lengthened their response latencies at intense sounds, so that the PLS became larger. Cortical electric stimulation also modulated the response latencies of non-PLS neurons. It produced an inhibitory frequency tuning curve or curves. Our findings indicate that corticofugal feedback is involved in shaping the spectrotemporal patterns of responses of subcortical auditory neurons presumably through inhibition.
INTRODUCTION
For echolocation, a bat emits orientation sounds (simply, pulses) and listens to their echoes to obtain various types of information of a target: range, size, shape, direction, speed, etc. The central auditory system creates various types of neurons tuned to different acoustic parameters other than a single frequency. Their response properties are quite different from those of the peripheral auditory neurons (Covey and Casseday 1999; Suga et al. 1990). Target ranging has been extensively studied behaviorally (Simmons 1993) and neurophysiologically (Suga et al. 1990). The mustached bat, Pteronotus parnellii, emits pulses each consisting of a constant frequency (CF) and a frequency modulated (FM) component. Range information is extracted by the combination-sensitive neurons, called FM-FM neurons, which are tuned to the specific delays of an echo's second through fourth harmonics from the emitted pulse's first harmonic (O'Neil and Suga 1979; Suga and O'Neil 1979). However, the little brown bat, Myotis lucifugus, emits FM pulses consisting of a single harmonic, so range information is extracted from a pulse-echo pair by a neural mechanism different from that in the mustached bat (Berkowitz and Suga 1989; Sullivan 1982a,b). The auditory cortex of the little brown bat has paradoxical latency shift (PLS) neurons instead of FM-FM neurons. The PLS neurons show longer response latencies for intense sounds and shorter latencies for weaker sounds. When a weak sound is paired with an intense sound with a delay equal to the PLS of a given PLS neuron, the neuron shows a facilitatory response to the pair. Therefore Sullivan (1982a,b) proposed a hypothesis that PLS neurons are specialized for processing range information. The corticofugal system forms multiple feedback loops and improves and adjusts subcortical auditory signal processing in the frequency, amplitude, time, and spatial domains (Suga and Ma 2003). However, it has not yet been examined whether the corticofugal system modulates subcortical PLS neurons.
Because the big brown bat, Eptesicus fuscus, uses FM pulses for echolocation as does the little brown bat, we used the FM sounds similar to its biosonar pulses to study the response properties of collicular neurons. We found that the big brown bat also has PLS neurons and that cortical electric stimulation evoked inhibition and modulated collicular PLS neurons in the frequency and time domains. In other words, the corticofugal feedback system changed the spectrotemporal patterns of their responses.
METHODS
Materials, surgery, acoustic stimulation, cortical electric stimulation, recording of action potentials, and data acquisition and processing were the same as those described in Ma and Suga (2001). Therefore only the essential portions of the methods are described in the following text.
Nine adult big brown bats (E. fuscus) were used for the current experiments. Under neuroleptanalgesia (Innovar 4.08 mg/kg body wt), a 1.5-cm-long metal post was glued on the dorsal surface of the bat's skull. Physiological experiments were started 3–4 days after the surgery. The awake animal was placed in a polyethylene-foam body mold that was hung with an elastic band at the center of a soundproof room maintained at 31°C. The metal post glued on the skull was fixed to a metal rod with set screws to immobilize the animal's head, and the head was adjusted to face directly toward a loudspeaker located 74 cm away. Holes (50–100 μm diam) were made in the skull covering the auditory cortex (AC) and inferior colliculus (IC). Through the holes, a multi-electrode assembly (NeuroNexus Technologies, Ann Arbor, MI) was inserted into the central nucleus of the IC (ICc) for recording action potentials of collicular neurons, and a pair of tungsten-wire electrodes was inserted into the primary AC (AI) for recording action potentials of cortical neurons and then for stimulating these cortical neurons. The protocol for this research was approved by the Animal Studies Committee of Washington University in St. Louis.
Acoustic stimulation
For the measurement of the best frequency (BF) of a collicular or cortical neuron, a 4.0-ms tone burst, including a 0.5-ms rise-decay time, was delivered to the bat at a rate of 5/s with a leaf tweeter (Panasonic, Model EAS-10 TH-800). (Because the big brown bat emits a biosonar pulse at a rate of 5–100/s and listens to its echoes during echolocation that may last a few to several hours, the neurophysiological studies of the bat's auditory system have commonly been performed by delivering short acoustic stimuli at the rate of 4–5/s.) Its frequency and amplitude were varied manually or computer- controlled (TDT system 3, Tucker-Davis Technologies). The amplitude was calibrated with a one-quarter-inch calibrated microphone (Brüel and Kjæel, No. 4135) placed at the bat's head and was expressed in decibels in sound pressure level (dB SPL).
The frequency-tuning curve of a single collicular or cortical neuron was first audiovisually measured. Then the tone burst was randomly changed in amplitude in 5-dB steps from 0 to 80 dB SPL and in frequency in 0.5-kHz steps between ±5.0 kHz of the BF if a tuning curve was narrow but in 1.0-kHz steps between ±10 kHz of the BF if it was broad by TDT system 3 (Tucker-Davis Technologies). This frequency-amplitude scan was repeated five times to obtain five responses at each frequency-amplitude combination. It took 7 min to complete the five scans. A frequency-tuning curve of a neuron was obtained from its responses to the frequency-amplitude scans.
To measure an inhibitory area, a 4.0-ms probe tone at the BF and at 10 ∼15 dB above the minimum threshold (MT) of a given collicular neuron was delivered immediately after the tone burst in the frequency-amplitude scan, and it was studied whether the tone burst inhibited the response to the probe tone.
To measure a PLS, a 4.0-ms FM sound was presented in 5-dB steps. The FM sound swept downward linearly with time over one octave across the BF of a given neuron, so it was similar to the bat's species-specific biosonar pulse. Because five samples at each frequency- amplitude combination were not adequate for latency measurement, an identical FM sound was delivered 15 times at each amplitude. We defined a neuron as a PLS neuron when the response latency at 70–80 dB SPL is longer than that at the 30–40 dB SPL.
Action potentials of cortical and collicular neurons
Our tungsten-wire electrodes (∼7 μm diam at the tip) commonly recorded action potentials originating from a few neurons. So we used an amplitude-window-time discriminator software (Tucker-Davis Technologies) to select action potentials of a single collicular neuron. At the beginning of data acquisition, the waveform of an action potential was stored and displayed on the monitor screen. This action potential (i.e., template) was compared with other action potentials obtained during data acquisition.
Electric stimulation
An electric stimulator (Grass, S88) and a constant current isolator (WPI, A360) were used for focal electric stimulation of the auditory cortex. A 6.2-ms train of four monophasic electric pulses (100-nA constant current, 0.2-ms duration, 2.0-ms interval) was delivered to cortical neurons at a depth of 400–800 μm at a rate of 10/s for 30 min through a pair of tungsten-wire electrodes. The tips of these electrodes were 6–8 μm in diameter and were separated by ∼150 μm, one proximal to the other. Such stimulation was estimated to stimulate neurons within a 60-μm radius around the electrode tip (Yan and Suga 1996). The bat showed no behavioral response at all to such weak electric stimulation.
Data acquisition and processing
The arrays of the poststimulus time (PST) histograms or raster displaying the responses of a single collicular neuron to the FM sounds were recorded. The PST cumulative histograms were used to measure the response latencies for the FM sounds. The response latency was defined as the time from the onset of the FM sound to the onset of the response, which was determined by the deflection point of the PST cumulative histogram.
RESULTS
In nine animals, 622 collicular neurons were recorded mostly from the central portion of the central nucleus of the inferior colliculus. Their BFs ranged from 19 to 45 kHz [31 ± 2.5 (SD) kHz]. Sixty-one neurons of the 622 showed a PLS. The amount of the PLS ranged between 1.0 and 12 ms (3.42 ± 2.28 ms). Cortical electric stimulation changed the PLSs of 34 collicular neurons (56%) of the 61 studied but did not change the PLSs of the remaining 27 neurons. The effect of the cortical electric stimulation was also studied on 121 non-PLS neurons. Of the 121, only 7 neurons (6%) showed PLSs after the stimulation, but the remaining 114 did not.
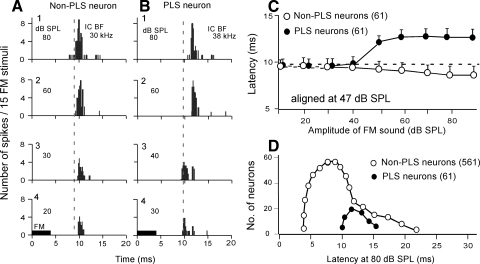
In the great majority of collicular neurons, the response latency became shorter with an increase in stimulus amplitude (Fig. 1 A), whereas that of a PLS neuron became abruptly longer when the stimulus amplitude was increased beyond 47 ± 4.6 dB SPL (n = 61; Fig. 1, B and C). To obtain the mean amplitude-latency curve for the 61 PLS collicular neurons, individual amplitude-latency curves were first plotted by shifting them along the amplitude axis so as to make the stimulus amplitudes for their abrupt latency changes to be 47 dB SPL. Then mean latencies were calculated at different stimulus amplitudes. The mean amplitude-latency curve indicates that the response latency stayed nearly the same ≤40 dB SPL and then lengthened to another fixed value for higher stimulus levels beyond 50 dB SPL (Fig. 1C, •). The mean PLS was 3.4 ± 2.28 ms. The mean amplitude-latency curve for randomly selected 61 non-PLS neurons was obtained by calculating mean latencies at different stimulus amplitudes. Unlike the latency of the PLS neurons, the latency of non-PLS neurons gradually shortened with an increase in stimulus amplitude beyond 40 dB SPL. The mean latency shortening was 0.8 ms between 30 and 80 dB SPL at a rate of 16 μs/dB (Fig. 1C,•). The distribution of response latencies measured at 80 dB SPL and at the BF of a given neuron was clearly different between the PLS and non-PLS neurons (Fig. 1D; t-test; P < 0.05). The distribution of the response latencies of non-PLS neurons is similar to that reported by Ferragamo et al. (1998).
FIG. 1.
Changes in the response latencies of single collicular neurons with stimulus amplitudes. Each poststimulus-time (PST) histogram displays the response of a single neuron to a FM sound repeated 15 times. A: a non-paradoxical latency-shift (PLS) neuron showed longer response latencies to smaller stimulus amplitudes. B: a PLS neuron showed shorter response latencies to stimulus amplitudes <50 dB SPL. C: the mean amplitude-latency functions of 61 non-PLS (○) and 61 PLS neurons (•). Each data point shows a mean ± SE. D: the distributions of response latencies of PLS and non-PLS neurons at 80 dB SPL and the best frequency (BF) of a given neuron.
We found that the response latency of collicular neurons could be changed by electric stimulation of AI. The change systematically depended on the difference in the BF between the recorded collicular and stimulated cortical neurons. Therefore corticofugal modulation is tonotopically organized (Suga and Ma 2003 for review). Of 88 stimulated cortical neurons, 12 were PLS neurons. The mean PLS was 3.5 ± 3.2 ms and their BFs ranged from 21 to 50 kHz (38 ± 8.6 kHz). Changes in collicular neurons evoked by electric stimulation of these cortical neurons mainly depended on the BF difference between them. When the BF difference was <10 kHz, the collicular neurons changed their response properties. These changes depended on the amount of the BF difference between the collicular and cortical neurons. When the BF difference was larger than 10 kHz (7 of 12), however, no effect of the stimulation was observed on the collicular neurons.
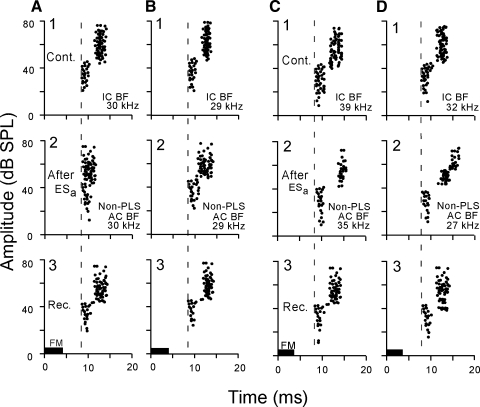
When the BF of a recorded collicular PLS neuron was the same as that of the stimulated cortical neurons (i.e., BF-matched), the PLS became shorter. In Fig. 2, A and B, the BFs of the recorded collicular and stimulated cortical neurons were the same: 30 (A) or 29 (B) kHz. The PLSs of these collicular neurons reduced from 4.0 to 1.0 ms (A) or from 3.0 to 1.8 ms (B) after the 30-min electric stimulation of the BF-matched cortical neurons. These changes disappeared ∼80 min after the onset of the electric stimulation (A3 and B3). The short response latencies at weak sounds were little affected by the cortical electric stimulation.
FIG. 2.
Corticofugal modulation of 4 collicular PLS neurons, the BFs of which matched (A and B) or didn't match (C and D) the BFs of the stimulated cortical neurons. In A and B, the PLS disappeared (A2) or became smaller (B2) after the cortical electrical stimulation. In C and D, the PLS became larger after the cortical electric stimulation (C2 and D2). One through 3 show the spike discharges obtained before (control), 30 min after, and 60 min after the onset of the cortical electric stimulation (ESa). IC BF, the BF of the recorded collicular neuron; AC BF, the BF of the stimulated cortical neurons.
In the BF-unmatched collicular PLS neurons, a PLS became longer after cortical electric stimulation. In Fig. 2C1, the BFs of the collicular and cortical neurons were 39 and 35 kHz, respectively. The PLS of the collicular neuron was 4.0 ms. After the 30-min electric stimulation of the 35-kHz-tuned cortical neurons, the PLS became longer, 6.0 ms, and its response slightly reduced (C2). These changes recovered back to the control 60 min after the onset of the electric stimulation (Fig. 2C3). In Fig. 2D, the PLS of the collicular neuron tuned to 32 kHz became 4–5 ms longer at 45–80 dB SPL 30 min after the onset of the cortical stimulation (D2). The PLS returned to the control value 65 min after the onset of the stimulation (D3). All these changes in PLS were short-lasting.
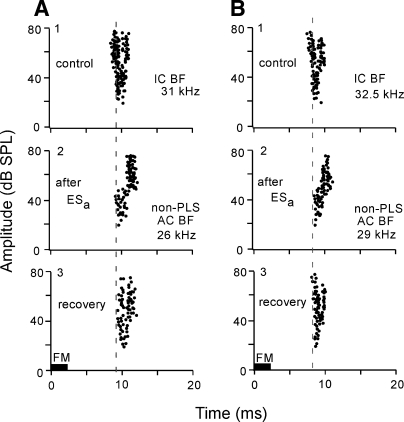
About 6% of the BF-unmatched non-PLS collicular neurons showed a PLS after cortical electric stimulation. In the control condition, the response latencies of those neurons became shorter with an increase in sound amplitude (Fig. 3, A1 and B1). After the cortical electric stimulation, however, the latencies of their responses at 45–80 dB SPL became 2–3 ms longer than those at 30–50 dB SPL (A2 and B2). The latency is the same from 50 to 80 dB SPL in A2 but became longer with an increase in stimulus level beyond 50 dB SPL in B2. These PLSs disappeared ∼60 min after the onset of the cortical stimulation (A3 and B3).
FIG. 3.
Corticofugal modulation of 2 collicular non-PLS neurons (A and B). The neuron showed PLS after ESa of cortical non-PLS neurorns. The BFs of the recorded and stimulated neurons were, respectively, 31.0 and 26.0 kHz in A and 32.5 and 29 kHz in B; 1–3: prior to (control), 7 min, and 30 min after the onset of ESa.
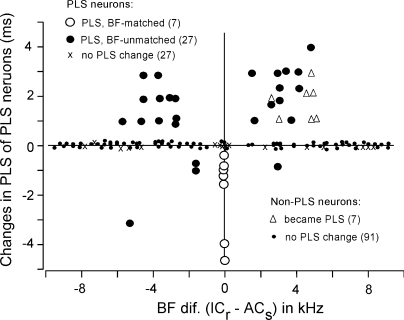
All the data obtained from the PLS and non-PLS neurons were plotted as a function of BF differences between the recorded collicular and stimulated cortical neurons in Fig. 4. The PLS became shorter in seven BF-matched PLS neurons (○) and four BF-unmatched PLS neurons (filled circles below the zero line), whereas it became longer in 23 BF-unmatched PLS neurons (• above the zero line). Both types of PLS changes in the BF-unmatched neurons (○ and •) were observed regardless of whether the recorded collicular neurons were higher or lower than the cortical stimulated neurons in BF. Of 27 PLS neurons that showed no PLS change, 8 were BF-matched neurons (Fig. 4, ×). Of 121 non-PLS neurons, 7 became PLS after cortical electric stimulation. Their BFs were 2–5 kHz higher than those of the stimulated cortical neuron (Fig. 4, ▵).
FIG. 4.
Changes in the PLS of collicular neurons evoked by cortical electric stimulation are different depending on the BF differences between the recorded collicular and stimulated cortical neurons. Some non-PLS neurons showed PLSs after cortical electric stimulation (▵).
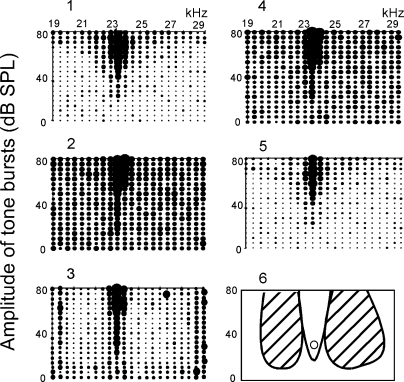
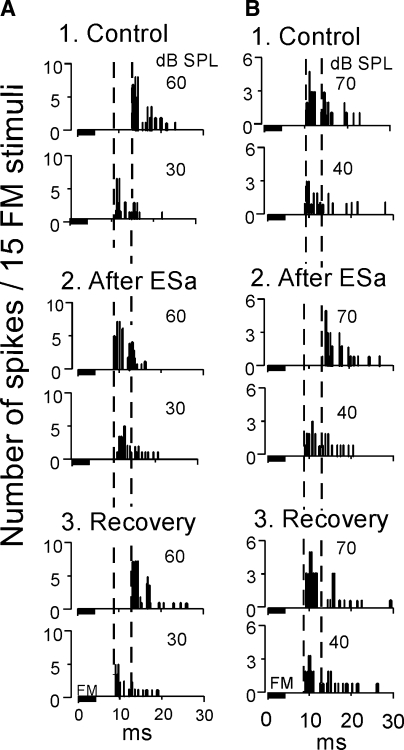
To examine whether corticofugal inhibition was related to the changes in collicular response latencies evoked by the cortical electric stimulation, we delivered an excitatory probe tone at the BF and 10–15 dB above the minimum threshold of a given neuron immediate after each tone burst in the frequency- amplitude scan and studied whether the tone burst inhibited the response to the probe tone. In Fig. 5, a collicular PLS neuron tuned to 23.5 kHz responded to tone bursts from 19 to 29 kHz at 70–80 dB SPL (1). The neuron showed a 4.0-ms PLS (Fig. 6 A1). Background discharges were low, so that it was not clear whether it had an inhibitory area in which a single tone burst inhibited the neuron. A 4.0-ms probe tone was delivered to the animal at 23.5 kHz, 35 dB SPL immediately after the tone burst, which was randomly varied by the computer-controlled frequency-amplitude scan. In the control condition, the neuron always responded to the probe tone regardless of the frequency and amplitude of the tone burst (Fig. 5, 2). When 23.5-kHz-tuned cortical neurons (i.e., BF-matched neurons) were electrically stimulated, however, the response to the probe tone was reduced by the tone bursts between 20 and 22 kHz and between 24 and 28 kHz. That is, the cortical stimulation evoked inhibition on both sides of the excitatory tuning curve so that the excitatory tuning curve became narrow at high sound pressure levels, namely, the tuning curve was sharpened (Fig. 5, 3). Then the neuron showed no PLS (Fig. 6, A2). The corticofugal inhibition disappeared 60 min after the onset of the electric stimulation (Fig. 5, 4). When the probe tone was turned off, the excitatory response curve resumed (Fig. 5, 5). In total, 25 collicular PLS neurons were studied in the same way as in the preceding text. The inhibitory area or areas evoked by cortical electric stimulation were observed in 5 of the 25 neurons. In other words, 20 collicular PLS neurons changed their PLSs but did not show inhibitory areas for the cortical stimulation.
FIG. 5.
Inhibition of a collicular PLS neuron evoked by electric stimulation of BF-matched cortical neurons. The BFs of the recorded collicular and stimulated cortical neurons were the same, 23.5 kHz. The frequency-amplitude (F-A) scan repeated 5 times. The size of a dot is proportional to the number of spikes/tone burst. 1: control, i.e., F-A scan only. 2: F-A scan with a probe tone at 23.5 kHz and 40 dB SPL. The probe tone alone excited the neuron, evoking 0.6 spike/probe on the average. 3: F-A scan with the probe 30 min after the onset of cortical electric stimulation. 4: F-A scan with the probe 60 min after the electric stimulation. 5: F-A scan only 80 min after the electric stimulation (recovery). In 3, the cortical electric stimulation sharpened the excitatory area (excitatory frequency-tuning curve) and produced the large inhibitory areas on both sides of it. In 6, the excitatory and inhibitory areas in 3 are schematically drawn. The open circle indicates the probe tone.
FIG. 6.
Changes in the response latencies of two collicular neurons (A and B) to FM sound stimuli elicited by cortical electric stimulation. The neurons in A and B are the same as those in Figs. 5 and 7, respectively. In A, the PST histograms display the responses to FM sounds at 60 and 30 dB SPL. The BFs of the recorded collicular and stimulated cortical neurons both were 23.5 kHz. In B, the histograms display the responses to FM sounds at 70 and 40 dB SPL. The BFs of the recorded and stimulated neurons were 24 and 21 kHz, respectively; 1–3, respectively, show the responses prior to (control), 30 min after, and 180 min after (recovery) the onset of electric stimulation.
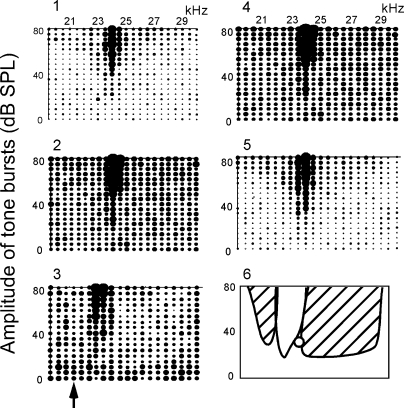
The inhibitory area or areas evoked by cortical electric stimulation were also studied in non-PLS neurons which showed PLS after cortical electric stimulation. In Fig. 7, the neuron was tuned to 24.0 kHz and responded to tone bursts from 20 to 30 kHz at 70–80 dB SPL (1). The neuron did not show a PLS in the control condition (Fig. 6B1). There were no inhibitory areas where background discharges were inhibited by single tone stimuli. When the probe tone at 24.0 kHz and 35 dB SPL was delivered to the animal after tone bursts of the frequency-amplitude scan, the neuron responded to the probe tone regardless of the scan (Fig. 7, 2). When electric stimulation was delivered to the cortical neurons tuned to 21.0 kHz (i.e., BF-unmatched neurons), the response to the probe tone was inhibited on both sides of the excitatory response area. The inhibitory area at the frequencies higher than the BF was much larger than that at the frequencies lower than the BF (Fig. 7, 3). The neuron shifted its BF by 1.0 kHz (Fig. 7, 3) and showed a 4.0-ms PLS (Fig. 6, B2). These changes elicited by the cortical stimulation disappeared 60 min after the onset of the cortical stimulation (Fig. 7, 4). When the probe tone was turned off, the excitatory response area resumed as shown in Fig. 7, 5.
FIG. 7.
Inhibition of a collicular non-PLS neuron evoked by electric stimulation of BF-unmatched cortical neurons. The F-A scan repeated five times as in Fig. 5. 1: control, i.e., F-A scan only (control). 2: F-A scan with a probe tone at 24 kHz and 35 dB SPL. The probe tone alone excited the neuron, evoking 0.8 spikes/probe on the average. 3: F-A scan with the probe 20 min after the onset of the electric stimulation. Stimulated 21.0-kHz-tuned cortical neurons (↑). 4: F-A scan with the probe 60 min after the electric stimulation. 5: F-A scan 80 min after the electric stimulation (recovery). In 3, the BF shifted from 24 to 23 kHz; an inhibitory area was large at the side higher than the excitatory area, but small at the side lower than that. In 6, the excitatory and inhibitory areas in 3 are schematically drawn. ○, the probe tone.
DISCUSSION
The percentage of collicular PLS neurons recorded is ∼13% in the Mexican free-tailed bat (Klug et al. 2000), ∼10% in the big brown bat (our current paper), and ∼29% (Galazyuk et al. 2005) and 21% (Wang et al. 2007) in the little brown bat. It is not clear whether the population of PLS neurons in the ICc is really different between these species of bats because they all emit short FM biosonar signals and because the population of PLS neurons sampled may vary depending on the locations of recording electrode penetrations across the ICc. We don't yet know whether the PLS neurons are clustered at a certain portion of the ICc. If we knew the location of the cluster (if clustered), the percentage of recorded PLS neurons would become much larger than 10%.
Response latencies measured with FM sounds
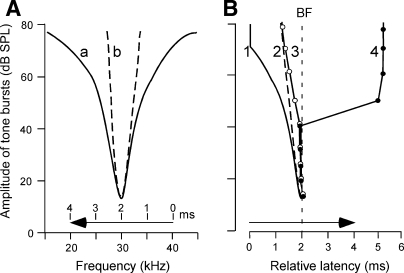
An FM sound sweeps across an excitatory area (frequency-tuning curve), so one may speculate that the response latency may simply depend on the time when the FM sound sweeps into the excitatory area and that the corticofugally evoked changes in latency or PLS may simply depend on the changes in the shape of the excitatory area. However, this speculation does not hold. Let us consider a collicular neuron tuned to 30 kHz, and a 4.0-ms FM sound stimulus swept from 40 to 20 kHz at a rate of 5.0 kHz/ms for the measurement of its response latency. The excitatory area of a collicular neuron of the big brown bat is commonly an inverted triangular shape as shown in Figs. 5 and 7. Figure 8A shows the schematized excitatory areas similar to those obtained before (a) and after (b) the cortical electric stimulation. If the amplitude of the FM sound stimulus increases and the response latency to it simply depends on the time when the FM sound sweeps into the excitatory area, the response latency to the FM sound would gradually shorten as shown by curves 1 and 2 in Fig. 8B. The amplitude-latency function of the PLS neurons studied (Figs. 2 and 5) was quite different from these curves because it showed a large increase in latency at the stimulus levels >40 dB SPL (Fig. 8B, curve 4).
FIG. 8.
Excitatory areas, i.e., frequency-tuning curves (A) and amplitude-latency functions (B) of collicular neurons. A: the excitatory areas in the control (a) and corticofugally sharpened (b) conditions. B: amplitude-latency functions 1 and 2 are respectively based on the time when the 4.0-ms-long FM sound (→) sweeps into the excitatory area a or b in A. Amplitude-latency functions 3 and 4 are those of non-PLS and PLS neurons shown in Fig. 1C, respectively. All the curves are plotted in register at the latencies of curves 1 and 2 at 15 dB SPL.
The amplitude-latency function of the non-PLS neurons studied (curve 3 in Fig. 8B) was also different from curve 1 in Fig. 8B. This amplitude-latency function indicates that the response latency predominantly depended on the response at the BF, not on the edge of the excitatory area swept by the FM sound, because the latency at 80 dB SPL was different only by 0.5 ms from that at 15 dB SPL at which the FM sound swept across only the BF. If the speed of the frequency sweep is slow and if there is no inhibitory area, however, the response latency would depend on the edge of the excitatory area swept by the FM sound. After cortical electric stimulation, their excitatory response latencies became longer at the stimulus levels higher than 40 dB SPL (Figs. 3 and 6, B2). Such a change in latency could not be predicted by the shape of the sharpened excitatory area (curve b in Fig. 8A). Cortical electric stimulation evokes BF shifts of BF-unmatched collicular neurons which are at most 2.0 kHz (Ma and Suga 2001). The 2.0-kHz shift of the excitatory area would cause a 0.2-ms change in response latency if the response latency simply depended on the edge of the area swept by the FM sound. Therefore the shift of the excitatory area associated with the BF shift itself has, if any, only a minor influence on the latency shift. It is thus clear that the long latencies at high stimulus levels did not depend on the time when the FM sound swept into the excitatory area but rather on some inhibitory mechanism.
The responses of central auditory neurons to FM sounds depend on the interaction between an excitatory and inhibitory areas of the neurons swept, i.e., stimulated, by the FM sounds (Jen et al. 2002; Suga 1965a,b). Therefore it is expected that some collicular neurons would show amplitude-latency functions that are different from those shown in Fig. 1C.
PLS and inhibition
The response latencies of peripheral sensory neurons generally shorten with an increase in stimulus level. This level-dependent latency change is basically the same at auditory nerve fibers and cortical auditory neurons (Heil 1998; Heil and Irvine 1997). A PLS exists at the inferior colliculus and above (Berkowitz and Suga 1989; Covey 1993; Suga 1970; Sullivan 1982a,b). Sullivan (1982a,b) proposed two possible mechanisms for creating the long response latency at intense sounds: multiple-delay lines and a rebound excitation after inhibition. Bicuculline, a GABAA receptor antagonist, applied to collicular PLS neurons increases their spike discharges and abolishes their PLSs. Therefore the PLS is undoubtedly created in the inferior colliculus by inhibition (Galazyuk et al. 2005). Our current data show that 56% of the collicular PLS neurons were corticofugally modulated and that 6% of non-PLS neurons showed a PLS by cortical electric stimulation. Some of those PLS and non-PLS neurons showed inhibitory areas when cortical neurons were electrically stimulated. It is most likely that the changes in the response latencies of collicular neurons are directly related to corticofugal inhibition. However, the relationship between the corticofugal modulation of the latencies and corticofugal inhibition remains to be further studied. It also remains to be studied whether inactivation of the auditory cortex evokes the change in collicular PLS.
Difference in corticofugal modulation between BF-matched and -unmatched neurons
The excitatory area of an inferior collicular neuron is often sculptured by inhibition so that the neuron has both excitatory and inhibitory areas (Suga 1965a, 1968; Yang et al. 1992), and the neural responses to FM sounds depend on the sequence in which these areas are stimulated by them (Suga 1965a,b, 1968). The corticofugal system can change these excitatory and inhibitory areas (Suga and Ma 2003; our current paper), so that the neural responses to the FM sounds would accordingly change after the cortical stimulation.
In Fig. 8, cortical electric stimulation changed excitatory area “a” of the BF-matched PLS neuron to area “b” and its amplitude-latency function “4” to the function similar to function “3”, as shown in Fig. 5. The cortical stimulation also changed excitatory area “a” of the BF-unmatched non-PLS neuron into area “b” and its amplitude-latency function from curve “3” to the function similar to function “4”, as shown in Fig. 7. Why did the change in amplitude-latency function differ between the BF-matched and -unmatched neurons?
The basic neural circuit for corticofugal modulation facilitates the responses of subcortical BF-matched neurons at their BFs and sharpens their frequency tuning by lateral inhibition. It simultaneously inhibits subcortical BF-unmatched neurons at their BFs, facilitates their responses at the frequencies between their BFs and the BF of the stimulated cortical neurons, and shifts their BFs (Gao and Suga 1998; Suga et al. 2000). Therefore we may speculate that corticofugal fibers facilitate the BF-matched PLS neurons and reduce inhibition at their BFs, so that their PLSs becomes smaller. On the other hand, they increase inhibition at the BFs of the BF-unmatched PLS neurons, so that their PLSs become larger.
Behavioral significance of corticofugal PLS modulation
In our current studies, PLS neurons compose only 10% of the collicular neurons sampled, although they composed ∼29% (Galazyuk et al. 2001) or 21% (Wang et al. 2007) in the studies of the ICc of the little brown bat. Such a percentage would vary depending on the locations of electrode penetrations across the ICc. If we knew the exact location of the cluster of PLS neurons, if clustered, the percentage would be much higher than 10%. The PLS neurons must play an important role in auditory signal processing.
Ranging is based on the analysis of echo delays from the biosonar pulses emitted by the bat (Simmons 1973, 1979). PLS neurons show delay-dependent facilitation and are tuned to a specific echo delay. Therefore Sullivan (1982b) hypothesized that PLS neurons are important for target ranging. Our current data indicate that PLS neurons are corticofugally modulated. Namely, the corticofugal fibers facilitate BF-matched subcortical neurons and reduce the PLSs of the PLS neurons, so that more PLS neurons respond to the echoes with shorter delays. At the same time, the corticofugal fibers increase the PLSs of BF-unmatched PLS neurons. Therefore this corticofugal modulation increases the contrast in neural representation between short and long echo delays. The 30-min cortical electric stimulation evoked prominent changes in the PLS and some non-PLS neurons. The electric stimulation is unnatural and the prominent changes evoked by that may not commonly occur in the normal condition. Our data indicate a basic corticofugal function by which the response properties of subcortical neurons are maintained as they are but can be changed to adapt for processing a repeatedly stimulating and/or behaviorally relevant sound.
The preceding discussion is based on Sullivan's hypothesis (1982b) that PLS neurons play a role in processing echo delays. However, there has been a theory that on-response latencies of non-PLS neurons are essential for processing target-distance information (Sanderson and Simmons 2005; Simmons 1973, 1979). The response latencies of peripheral auditory neurons to a FM sound depend on the time when its frequency sweeps into their frequency tuning curves. The latencies of some collicular neurons may also depend on that. However, the PLS and non-PLS collicular neurons we studied did not depend on the time when the FM sound swept into the excitatory frequency-tuning curve, but on the BF (Fig. 8B, curve 3). Results similar to these were also obtained by Ferragamo et al. (1998). The response latency of the non-PLS (i.e., common) neurons changes at a rate of ∼16 μs/dB (Fig. 1C), which matches the 13 ∼17 μs/dB amplitude-latency trading ratio observed in behavioral experiments with the big brown bat (Simmons et al. 1990). So the amplitude-latency function of non-PLS collicular neurons is apparently behaviorally relevant. On the other hand, the response latencies of the PLS neurons studied are rather fixed ≤40 dB SPL and then abruptly lengthen to another fixed value for higher stimulus levels beyond 50 dB SPL. Sullivan's hypothesis is based on these unique response properties and delay-dependent facilitation (i.e., delay tuning) of the PLS neurons. We may speculate that the non-PLS neurons we studied are involved in the coding of echo delays, but the PLS neurons are involved in echo-delay processing that is one step higher than coding. The ICc is a large nucleus which contains many neurophysiologically different types of neurons, which are presumably involved in processing the different aspects of auditory signals.
GRANTS
This work was supported by National Institute on Deafness and Other Communication Disorders Grant DC-000175.
The costs of publication of this article were defrayed in part by the payment of page charges. The article must therefore be hereby marked “advertisement” in accordance with 18 U.S.C. Section 1734 solely to indicate this fact.
REFERENCES
- Berkowitz and Suga 1989.Berkowitz A, Suga N. Neural mechanisms of ranging are different in two species of bats. Hear Res 41: 255–264, 1989. [DOI] [PubMed] [Google Scholar]
- Covey 1993.Covey E Response properties of single units in the dorsal nucleus of the lateral lemniscus and paralemniscal zone of an echolocating bat. J Neurophysiol 69: 842–859, 1993. [DOI] [PubMed] [Google Scholar]
- Covey and Casseday 1999.Covey E, Casseday JH. Timing in the auditory system of the bat. Annu Rev Physiol 61: 457–476, 1999. [DOI] [PubMed] [Google Scholar]
- Ferragamo et al. 1998.Ferragamo MJ, Haresign T, Simmons JA. Frequency tuning, latencies, and responses to frequency-modulated sweeps in the inferior colliculus of the echolocating bat, Eptesicus fuscus. J Comp Physiol [A] 182: 65–79, 1998. [DOI] [PubMed] [Google Scholar]
- Galazyuk and Feng 2001.Galazyuk AV, Feng AS. Oscillation may play a role in time domain central auditory processing. J Neurosci 21: RC147, 2001. [DOI] [PMC free article] [PubMed] [Google Scholar]
- Galazyuk et al. 2005.Galazyuk AV, Lin W, Llano D, Feng AS. Leading inhibition to neural oscillation is important for time-domain processing in the auditory midbrain. J Neurophysiol 94: 314–326, 2005. [DOI] [PubMed] [Google Scholar]
- Gao and Suga 1998.Gao E, Suga N. Experience-dependent corticofugal adjustment of midbrain frequency map in bat auditory system. Proc Natl Acad Sci USA 95: 12663–12670, 1998. [DOI] [PMC free article] [PubMed] [Google Scholar]
- Heil 1998.Heil P Further observations on the threshold model of latency for auditory neurons. Behav Brain Res 95: 233–236, 1998. [DOI] [PubMed] [Google Scholar]
- Heil and Irvine 1997.Heil P, Irvine DR. First-spike timing of auditory-nerve fibers and comparison with auditory cortex. J Neurophysiol 78: 2438–2454, 1997. [DOI] [PubMed] [Google Scholar]
- Jen et al. 2002.Jen PH, Chen QC, Wu FJ. Interaction between excitation and inhibition affects frequency tuning curve, response size and latency of neurons in the auditory cortex of the big brown bat,Eptesicus fuscus. Hear Res 174: 281–289, 2002. [DOI] [PubMed] [Google Scholar]
- Klug et al. 2000.Klug A, Khan A, Burger RM, Bauer EE, Hurley LM, Yang L, Grothe B, Halvorsen MB, Park TJ. Latency as a function of intensity in auditory neurons: influences of central processing. Hear Res 148: 107–123, 2000. [DOI] [PubMed] [Google Scholar]
- Ma and Suga 2001.Ma X, Suga N. Corticofugal modulation of duration-tuned neurons in the midbrain auditory nucleus in bats. Proc Natl Acad Sci USA 98: 14060–14065, 2001. [DOI] [PMC free article] [PubMed] [Google Scholar]
- O'Neill and Suga 1979.O'Neill WE, Suga N. Target range-sensitive neurons in the auditory cortex of the mustache bat. Science 203: 69–73, 1979. [DOI] [PubMed] [Google Scholar]
- Sanderson and Simmons 2005.Sanderson MI, Simmons JA. Target representation of naturalistic echolocation sequences in single unit responses from the inferior colliculus of big brown bats. J Acoust Soc Am 118: 3352–3361, 2005. [DOI] [PubMed] [Google Scholar]
- Simmons 1993.Simmons JA Evidence for perception of fine echo delay and phase by the FM bat, Eptesicus fuscus. J Comp Physiol [A] 172: 533–547, 1993. [DOI] [PubMed] [Google Scholar]
- Simmons 1973.Simmons JA The resolution of target range by echolocating bats. J Acoust Soc Am 54: 157–173, 1973. [DOI] [PubMed] [Google Scholar]
- Simmons 1979.Simmons JA Perception of echo phase information in bat sonar. Science 22: 1336–1338, 1979. [DOI] [PubMed] [Google Scholar]
- Simmons et al. 1990.Simmons JA, Ferragamo M, Moss CF, Stevenson SB, Altes RA. Discrimination of jittered sonar echoes by the echolocating bat, Eptesicus fuscus: the shape of target images in echolocation. J Comp Physiol [A] 167: 589–616, 1990. [DOI] [PubMed] [Google Scholar]
- Suga 1965a.Suga N Functional properties of auditory neurones in the cortex of echo-locating bats. J Physiol 181: 671–700, 1965a. [DOI] [PMC free article] [PubMed] [Google Scholar]
- Suga 1965b.Suga N Responses of cortical auditory neurones to frequency modulated sounds in echo-locating bats. Nature 206: 890–891, 1965b. [DOI] [PubMed] [Google Scholar]
- Suga 1968.Suga N Analysis of frequency-modulated and complex sounds by single auditory neurones of bats. J Physiol 198: 51–80, 1968. [DOI] [PMC free article] [PubMed] [Google Scholar]
- Suga 1970.Suga N Echo-ranging neurons in the inferior colliculus of bats. Science 170: 449–452, 1970. [DOI] [PubMed] [Google Scholar]
- Suga 1989.Suga N Principles of auditory information-processing derived from neuroethology. J Exp Biol 146: 277–286, 1989. [DOI] [PubMed] [Google Scholar]
- Suga et al. 2000.Suga N, Gao E, Zhang Y, Ma X, Olsen JF. The corticofugal system for hearing: recent progress. Proc Natl Acad Sci USA 97: 11807–11814, 2000. [DOI] [PMC free article] [PubMed] [Google Scholar]
- Suga et al. 1990.Suga N, Kawasaki M, Burkard RF. Delay-tuned neurons in auditory cortex of mustached bat are not suited for processing directional information. J Neurophysiol 64: 225–235, 1990. [DOI] [PubMed] [Google Scholar]
- Suga and Ma 2003.Suga N, Ma X. Multiparametric corticofugal modulation and plasticity in the auditory system. Nat Rev Neurosci 4: 783–794, 2003. [DOI] [PubMed] [Google Scholar]
- Suga and O'Neill 1979.Suga N, O'Neill WE. Neural axis representing target range in the auditory cortex of the mustache bat. Science 206: 351–353, 1979. [DOI] [PubMed] [Google Scholar]
- Sullivan 1982a.Sullivan WE 3rd. Neural representation of target distance in auditory cortex of the echolocating batMyotis lucifugus. J Neurophysiol 48: 1011–1032, 1982a. [DOI] [PubMed] [Google Scholar]
- Sullivan 1982b.Sullivan WE 3rd. Possible neural mechanisms of target distance coding in auditory system of the echolocating bat Myotis lucifugus. J Neurophysiol 48: 1033–1047, 1982b. [DOI] [PubMed] [Google Scholar]
- Wang et al. 2007.Wang X, Galazyuk AV, Feng AS. FM signals produce robust paradoxical latency shifts in the bat's inferior colliculus. J Comp Physiol [A] 193: 13–20, 2007. [DOI] [PubMed] [Google Scholar]
- Yan and Suga 1996.Yan J, Suga N. Corticofugal modulation of time-domain processing of biosonar information in bats. Science 273: 1100–1103, 1996. [DOI] [PubMed] [Google Scholar]
- Yang et al. 1992.Yang L, Pollak GD, Resler C. GABAergic circuits sharpen tuning curves and modify response properties in the mustache bat inferior colliculus. J Neurophysiol 68: 1760–1774, 1992. [DOI] [PubMed] [Google Scholar]


