

Abstract
Fast-scan cyclic voltammetry at scan rates between 5 and 1000 Vs−1 was performed at the tip of a scanning electrochemical microscope immersed in a solution of redox mediator. The effect of conducting and insulating substrates on the voltammetric signal was investigated as a function of scan rate and tip-substrate distance. It was found that diffusional interactions between the tip and the substrate are greatest at lower scan rates and on the reverse sweep of the voltammogram. At the fastest scan rates used, the tip could be brought to with 1 μm of the substrate without appreciable perturbation of the voltammogram. By selecting scan rates and tip-substrate distances such that feedback effects were negligible, it was possible to image the diffusion layer of a 10 μm Pt substrate electrode. With the tip placed 1 μm above a biological cell, tip-substrate diffusional interactions were greatly diminished at a scan rate of 100 Vs−1, and absent at a scan rate of 1000 Vs−1. These results suggest conditions can be selected that allow chemical imaging of substrates without the feedback interactions typically encountered in scanning electrochemical microscopy.
Introduction
Scanning electrochemical microscopy (SECM) has developed into an invaluable tool for the study of electrochemical processes at interfaces. While the technique is very useful for making kinetic, transport, and other fundamental measurements with μm to sub-μm resolution, its enormous potential for high-resolution chemical imaging in complex systems has been largely untapped. This is partly because the steady-state tip potentials generally used in SECM are not amenable to the independent measurement of more than one species. However, several electroanalytical techniques (e.g. stripping, differential pulse, square wave, and cyclic voltammetries) are routinely used for the detection of multiple analytes. Combining such a technique with SECM promises to make a technique that is capable of imaging multiple species with high spatial resolution.
Daniele and coworkers recently combined anodic stripping voltammetry at mercury microelectrodes with SECM to measure the leaching of lead ions from sediment samples.1, 2 While that work demonstrated the use of a scanned potential technique to make a selective chemical measurement, only a single analyte was measured, and the time required for deposition and stripping were such that imaging would be impractical. Another established electroanalytical technique, fast-scan cyclic voltammetry (FSCV), promises to be more conducive to chemical imaging of multiple species with SECM because it requires no pre-deposition step and at the scan rates typically used (tens to hundreds of volts per second) measurements can be made in only a few milliseconds. FSCV has become an important analytical tool for measuring a variety of species, particularly in biological systems. Several species of biological interest, most notably dopamine3-9, serotonin3, 8, 10-14, epinephrine5, 8, 10, 15, 16, norepinephrine3, 5, 8, 10, 15, 16, O24, 7, and pH4, 6, 10, are amenable to detection by FSCV. Multiple species can be measured with a single voltammogram by monitoring the current at the appropriate potentials providing their E½ values are sufficiently different.
FSCV has two other important advantages that make it well-suited for application in SECM. First, the products of the redox reaction are generated only transiently (a few ms or less), and for reversible systems most of the product is re-converted to the starting material on the reverse sweep. This may be of particular importance in biological systems if the product is reactive or toxic. Second, with FSCV the diffusion layer is much smaller than that of conventional SECM, where the tip is held at a constant potential.17 This smaller diffusion field means that the tip can approach the substrate more closely before the presence of the substrate perturbs the measured current. It also means that the current should be less susceptible to convective effects, allowing for faster horizontal scan speeds. Furthermore, the smaller diffusion layer means that it takes only a short time (approximately ten times the length of the scan8, 9) for the diffusion layer to re-equilibrate with the bulk solution. In this work, we use this time between scans to move the electrode to the next x,y location, and then record the voltammogram while the electrode is stationary.
This article extends the initial demonstration of FSCV-SECM by Diaz18 to explore the effect of the voltammetric scan rate, tip-substrate separation distance, and the conducting nature of the substrate on the interaction between the tip and the substrate. We describe the conditions under which these interactions are minimized, and demonstrate their effect on imaging of model substrates. By understanding these diffusional interactions, it will then be possible to use the technique for chemical imaging of multiple species.18,19
Experimental Section
Instrumentation
The instrument used for FSCV-SECM was based on that described previously.20, 21 The positioning system uses optical encoders with a resolution of 0.5 μm, so all distances reported are accurate only to within ±0.25 μm. Potential waveforms for cyclic voltammetry were applied using the internal waveform generator of the bipotentiostat (EI-400, Cypress Systems, Chelmsford, MA), which has an upper scan rate limit of 1000 Vs−1. The low-pass filter of the potentiostat was maintained at a frequency 20 times the scan rate (e.g. cut-off frequency of 2 kHz at 100 Vs−1). To reduce power-line noise, a locally-built power line trigger synchronizer was used to delay the computer-generated waveform trigger so that cyclic voltammograms were recorded at the same location on the 60-Hz power line wave. Locally-written software was used to collect data and position the SECM tip. To ensure that data points were recorded at regularly-spaced intervals at all voltammetric scan rates, cyclic voltammograms were only recorded with the electrode stopped in between movements. Between voltammograms, the tip was moved at a rate of 5 – 10 μm s−1, usually in 0.5 μm steps (the resolution of the positioning system encoders.) For experiments involving cells and polystyrene beads, the SECM was mounted onto the stage of an inverted optical microscope (IX-50, Olympus America, Melville, NY). For all other experiments the substrate electrode was held inverted using a custom-built electrochemical cell.
Electrochemical Methods
Carbon fiber microelectrodes were constructed from 7 μm diameter carbon fibers (T-650, Cytec, Greenville, SC) using previously published methods.22 Care was taken during construction to ensure that the value of RG (the ratio of the insulator radius to the carbon fiber radius) was approximately 1.5. The electrode tips were polished at a 90° angle on a micropipette beveller (BV-10, Sutter Instruments, Novato, CA) prior to use. All potentials are reported versus a Ag/AgCl reference electrode filled with 3 M NaCl (Bioanalytical Systems, West Lafayette, IN). Approach curves and cyclic voltammograms were extracted from the raw 4-dimensional data (i vs. E vs. x vs. y or d) using the Scanning Probe Image Processor (SPIP, Image Metrology, Lyngby, Denmark).
Cell Culture
Frozen RAW 264.7 macrophage cells were purchased from the American Type Culture Collection (Manassas, VA). The cells were maintained in Dulbecco's Modification of Eagle's Serum (Sigma Chemicals, St. Louis, MO) supplemented with 10% fetal calf serum (Atlanta Biologicals, Norcross, GA), L-glutamine, and penicillin-streptomycin antibiotics (Sigma Chemicals) and incubated at 37°C in humidified atmosphere of 95% air and 5% carbon dioxide. Cells were plated on uncoated polystyrene tissue culture plates (60 × 15 mm, Corning) and incubated under the same conditions for at least 24 hrs prior to FSCV-SECM experiments.
Reagents
A 1.0 mM or 5.0 mM solution of hexaammineruthenium(III) chloride, [Ru(NH3)6]Cl3, (Strem Chemicals, Newburyport, MA) was used as the redox mediator for all experiments. For experiments involving polystyrene beads and biological cells, Ru(NH3)63+ was dissolved in Hank's Buffer Balanced Salts (Sigma) containing 10 mM HEPES (Sigma) and adjusted to pH 7.4. For all other experiments 0.1 M phosphate buffer (pH 7.4) was used. Solutions were prepared using 18.3 MΩ·cm deionized water (NanoPure, Barnstead-Thermolyne, Inc., Dubuque, IA).
Results and Discussion
To characterize the effect of the substrate on the FSCV measurements, a series of experiments were carried out in a solution of a redox mediator, Ru(NH3)63+ (E½ = −0.205 V). For all experiments, the tip potential was scanned between +0.2 to −0.6 V and held at +0.2 V between voltammograms.
FSCV-SECM at an Insulating Substrate
The effect of a substrate on the tip voltammetry can be visualized with a 2-dimensional contour plot in which the tip-substrate separation distance (d) is plotted as a function of tip potential (E) and change in current from the bulk solution (Δi) is plotted as the contour color. We refer to these plots as “approach surfaces,” as they are analogous to approach curves used in conventional SECM but with the addition of a third dimension (tip potential). Figure 1 shows approach surfaces for an insulating substrate at three representative tip scan rates: 10, 100, and 1000 Vs−1. Only the closest 20 μm are shown, although data was recorded to d = 60 μm. In these figures, the initial cathodic sweep is shown to the left of the switching potential, Esw (−0.6 V), and the anodic sweep is shown to the right. It is immediately apparent that the substrate has a greater influence on the tip current at lower scan rates. At a scan rate of 10 Vs−1, the tip current begins to show changes as far as 6 μm (L = d/a = 1.7, where a is the tip electrode radius) from the substrate, whereas at a scan rate of 1000 Vs−1 there is no notable effect of the substrate even at the distance of closest approach (0.5 μm, or L = 0.15). This difference is not surprising, as the size of the diffusion layer is dependent on the scan rate. At lower scan rates (i.e. longer times) the diffusion layer extends farther into solution, thus the presence of the substrate should have a greater effect on the measured tip current. Furthermore, this perturbation of the current occurs farthest from the substrate at potentials close to the peak anodic potential, Ep,a (denoted by the right-hand vertical dashed line) because the diffusion layer grows as the scan progresses through Esw and toward Ep,a. The result is a rightward skewing of the contours evident at 10 and 100 Vs−1.
Figure 1.
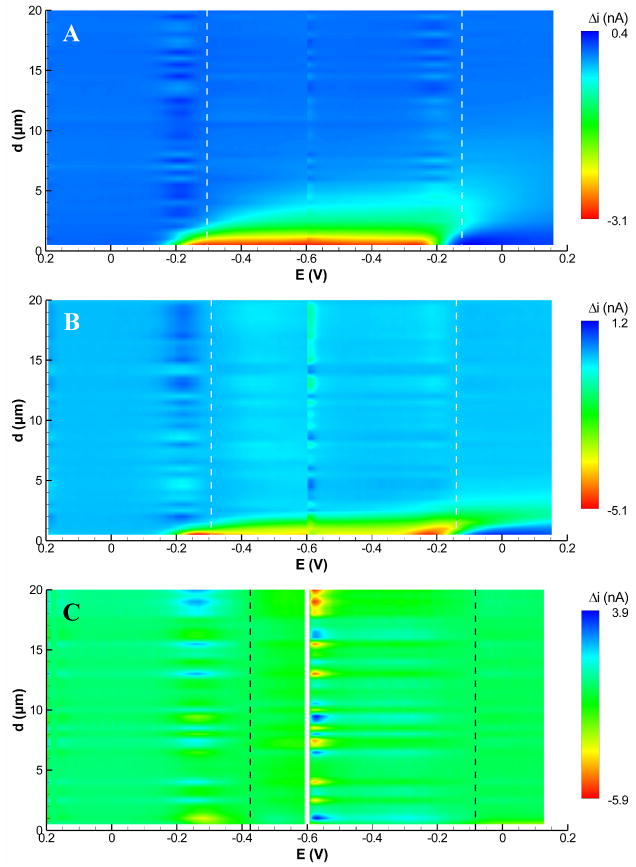
FSCV approach surfaces recorded with a 7-μm diameter carbon fiber tip above an insulating substrate recorded at tip scan rates of (A) 10 Vs−1, (B) 100 Vs−1, and (C) 1000 Vs−1. Current is plotted as the change from the start of the approach curve (d = 60 μm). Peak cathodic and anodic potentials in bulk solution are indicated by vertical dashed lines. Conditions: 1.0 mM Ru(NH3)63+ in pH 7.4 phosphate buffer.
Cyclic voltammograms and approach curves, which are easily extracted from approach surfaces, can give further insights into the tip-substrate interactions. Figure 2 compares cyclic voltammograms recorded in bulk solution to cyclic voltammograms extracted from the three approach surfaces of Figure 1 at d = 2 μm (L = 0.6). The voltammograms recorded at 10 and 100 Vs−1 show significant changes with respect to those recorded in bulk solution. The cathodic current is diminished (most notably at 10 Vs−1) and the current decays more quickly than in the bulk solution. Furthermore, the peak on the reverse anodic scan is larger than that in the bulk solution, and at 10 Vs−1 this anodic peak is shifted slightly toward E½. These effects are characteristic of thin-layer behavior,23 as the reduction product, Ru(NH6)32+, is trapped in the region between the tip and the substrate. At closer distances (not shown), this effect is even more pronounced and becomes notable at 100 Vs−1. The voltammogram at 1000 Vs−1, however, is essentially unaffected by the presence of the substrate because the time between E½ on anodic and cathodic segments is too short (∼0.8 ms) for appreciable negative feedback to occur.
Figure 2.

Cyclic voltammograms of 1.0 mM Ru(NH3)63+ recorded at the 7 μm diameter carbon fiber tip in bulk solution (solid line) and 2 μm above an insulating substrate (dashed line). Voltammograms were recorded at (A) 10 Vs−1; (B) 100 Vs−1; (C) 1000 Vs−1.
Figure 3 shows approach curves extracted from Figure 1 at the peak cathodic potential, Ep,c (Figure 3A), and Ep,a (Figure 3B). These approach curves were extracted at the potentials indicated by the vertical dashed lines shown in Figure 1, and are plotted as the ratio of the background-corrected peak current at d to the background-corrected peak current in bulk solution. For comparison purposes, a conventional feedback curve is also shown. It should be noted that because these curves are plotted as ratios, the sign of the peak current is lost and the data points thus represent the magnitude of the peak current relative to the peak current in bulk solution. At Ep,c, the production of Ru(NH3)62+ has just begun, whereas at Ep,a Ru(NH3)62+ has been generated throughout the scan. As a result, the approach curves extracted at Ep,c show a much smaller dependence on d than those extracted at Ep,a. At Ep,c, deviations from the bulk begin to occur at d ∼ 3 μm (10 Vs−1), d ∼ 1.5 μm (100 Vs−1), and no change is evident at 1000 Vs−1. It is possible to calculate an average difference from the time between E½ (−0.205 V) and Ep,c (−0.295 V), which is approximately 9 ms at 10 Vs−1. This corresponds to a diffusion distance of about 3 μm for D = 5.48 × 10⁻⁶ cm2s−1.24 Similar calculations at scan rates of 100 Vs−1 and 1000 Vs−1 give diffusion distances of 1.0 and 0.3 μm, respectively. These calculations qualitatively agree with the scan rate dependence of the approach curves in Figure 3A.
Figure 3.

Approach curves (extracted from Figure 1) to an insulating substrate at (A) peak cathodic potential and (B) peak anodic potential. Scan rates are (■) 10 Vs−1; (▲) 100 Vs−1; and (◆) 1000 Vs−1. The peak current at each vertical position is normalized by the peak anodic or cathodic current in bulk solution and corrected for charging current. For comparison to conventional SECM, the negative feedback curve recorded at a constant tip potential of −0.4 V is shown in Figure A (dashed line).
The approach curves extracted at Ep,a show a more complex behavior. For scan rates of 10 and 100 Vs−1, the current initially increases as d decreases, but then decreases as the tip is moved nearer the substrate. As the tip-substrate distance decreases, the anodic peak current increases due to a thin-layer effect as the redox product is trapped between the tip and substrate. However, as the tip moves nearer to the surface the anodic peak current decreases. This decrease is mostly due to the depletion of Ru(NH3)63+ at close separation, as the decrease closely mirrors that observed for the cathodic peak current (Figure 3A). This behavior is observed for 10 and 100 Vs−1, although the inversion is shifted more closely to the substrate at 100 Vs−1. At 1000 Vs−1, the current does begin to change at d = 1 μm, but no inversion is visible before the distance of closest approach (0.5 μm). Calculations of the diffusion distance at the anodic peak potential also are consistent with the data of Figure 3B. The time between E½ on the cathodic sweep and Ep,a on the reverse sweep is approximately 90, 9, and 0.9 ms for 10, 100, and 1000 Vs−1, respectively. These times correspond to diffusion distances of 10, 3.1, and 1.0 μm, which qualitatively agree with the onset of the change in the peak anodic current evident in Figure 3B.
Figure 4 shows the scan-rate dependence of the anodic and cathodic peak currents at d = 2 μm (L = 0.6). While the cathodic peak current is only affected at scan rates below 10 Vs−1, the anodic peak current is greatly affected by the substrate at scan rates as high as 200 Vs−1. These results suggest that when feedback images of an insulating substrate are desirable, the peak anodic potential should be monitored. If feedback effects are undesirable, e.g. for chemical imaging, monitoring the current at Ep,c will minimize these feedback effects. Note also that there is a region of scan rates for which the cathodic peak could be used for chemical imaging (i.e. there is no feedback influence on the peak current) while the anodic peak could be used for feedback imaging. For the conditions used in this work, this range is approximately 50 to 200 Vs−1.
Figure 4.

Scan rate dependence of the peak current measured at a 7-μm diameter carbon fiber tip positioned 2 μm above an insulating substrate. The peak current is normalized by the (■) peak cathodic or the (□) peak anodic current with the carbon fiber electrode in bulk solution.
FSCV-SECM at a Conductive Substrate
The situation at a conductive substrate is more complex because the substrate potential can vary from one extreme in which any reduced mediator generated by the tip is re-oxidized at the substrate (the usual positive feedback case in conventional SECM) to another in which the mediator in the bulk solution is also reduced at the substrate. In the first case, positive feedback between the tip and the substrate will occur at all tip potentials only when the tip is reducing the mediator (approximately when the potential is negative of E½). In the second case, positive feedback between the tip and substrate will occur except when the tip is reducing the mediator (approximately when the potential is positive of E½). Both situations were investigated.
Figure 5 shows approach surfaces for both conditions at 10, 100, and 1000 Vs−1. In Figure 5A-C, the substrate is held at an oxidizing potential, and in Figure 5D-F the substrate is held at a reducing potential. As expected, the largest change in current (red) occurs at potentials negative of E½ for the oxidizing substrate (positive feedback is occurring during the scan) and at potentials positive of E½ for the reducing substrate. Two other important effects are notable in these figures. First, the distance from the substrate at which positive feedback occurs is smaller than that for an insulating substrate. This is because for the positive feedback to occur a molecule must make a round trip between the tip and substrate. This requires extra time, and thus the tip must be closer to the substrate for this effect to be apparent. This also occurs in conventional SECM.25, 26 Second, with the substrate set to a reducing potential, the depletion of the oxidized form of the mediator near the substrate is apparent. This is evidenced by the gradual change in the contour color from blue to green quite far from the substrate (approximately 15 μm) in Figure 5D-F. As the tip approaches the substrate, positive feedback is also observed, but only at close distance (<2 μm). Both sets of curves show that at 1000 Vs−1, very little interaction between the tip and substrate occurs.
Figure 5.
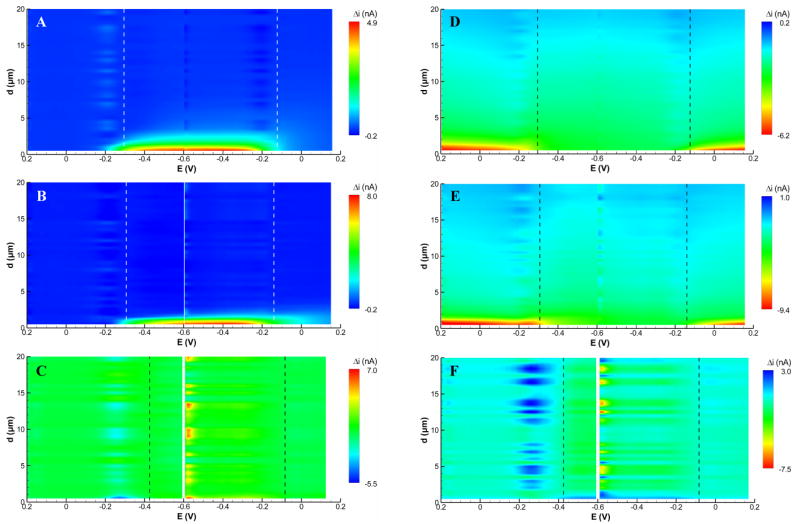
FSCV approach surfaces recorded at a 7-μm diameter carbon fiber tip above a 100 μm diameter Pt substrate held at (A–C) +0.4 V and (D–F) −0.4 V recorded at scan rates of (A,D) 10 Vs−1, (B,E) 100 Vs−1, and (C,F) 1000 Vs−1. Current is plotted as the change from the start of the approach curve (d = 60 μm). Peak cathodic and anodic potentials in bulk solution are indicated by vertical dashed lines. Conditions: 1.0 mM Ru(NH3)63+ in pH 7.4 phosphate buffer.
Figure 6 compares voltammograms of Ru(NH3)63+ recorded in bulk solution to voltammograms extracted from the approach surfaces of Figure 5 at d = 2 μm. As with the insulating substrate, feedback effects are most notable at 10 Vs−1. At the oxidizing substrate potential (Figure 6A), the peak cathodic current amplitude is increased compared to the bulk solution voltammogram, whereas the peak anodic current is decreased. This behavior is typical generator-collector behavior for closely-spaced electrodes.27, 28 At increased scan rates, the feedback effect is significantly diminished. At 100 Vs−1 (Figure 6B) feedback is noticeable only near the end of the cathodic scan and reaches a maximum near the peak on the anodic scan. Essentially no feedback is observable at 1000 Vs−1 (Figure 6C).
Figure 6.

Cyclic voltammograms of 1.0 mM Ru(NH3)63+ recorded at a 7 μm diameter carbon fiber tip in bulk solution (solid line) and 2 μm above a conducting substrate (dashed line) held at an oxidizing potential of +0.4 V (A–C) and at a reducing potential of −0.4 V (D–F). Voltammograms were recorded at (A,D) 10 Vs−1; (B,E) 100 Vs−1; (C,F) 1000 Vs−1.
With the substrate set to a reducing potential (Figures 6D-F), the voltammograms show the effect of the positive feedback before the potential reaches E½. Each voltammogram is shifted in the anodic direction by about 4 nA compared to bulk solution because of the oxidation of Ru(NH3)62+ generated by the substrate. This shift is equal for the three scan rates because the feedback occurs during the entire time between voltammograms, a time that is equal for all three scan rates (the delay between scans is a function of the tip movement velocity, which was identical for these data). As the tip potential reaches E½ and becomes more negative, this anodic reaction ceases and the tip competes with the substrate for Ru(NH3)63+, giving a somewhat lowered cathodic peak amplitude. In the absence of feedback (i.e. d > 2 μm), this amplitude should be a measure of the Ru(NH3)63+ concentration near the substrate electrode.
Figure 7 shows approach curves extracted from the data of Figure 5 at Ep,c and Ep,a. For the substrate set to an oxidizing potential (Figure 7A), the approach curves obtained at the cathodic peak potential resemble the positive feedback approach curves recorded with conventional, constant-potential SECM (dashed line). As with the insulating substrate, the distance from the substrate at which this perturbation occurs is greater on the anodic scan because of the longer time for diffusion. At both potentials, however, there is no change in current at the fastest scan rate, but significant changes at lower values of scan rate.
Figure 7.

Approach curves (extracted from Figure 5) at a conductive substrate with the potential held at (A) +0.4 V and (B) −0.4 V. Filled symbols are recorded at Ep,c and the open symbols are recorded at the Ep,a. Scan rates are (■, □) 10 Vs−1; (▲,△) 100 Vs−1; and (◆,◇) 1000 Vs−1. The peak current at each vertical position is normalized by the peak anodic or cathodic current in bulk solution and corrected for charging current. For comparison to conventional SECM, the positive feedback curve recorded at a constant tip potential of −0.4 V is shown in Figure A (dashed line).
The approach curves for the substrate held at the reducing potential (Figure 7B), exhibit both feedback and substrate generator-tip collector (SG-TC) behavior. The SG-TC behavior is most notable in the current at Ep,a. This current is significantly larger than the bulk, even at large distances from the substrate. This results from the detection of Ru(NH3)62+ generated by the substrate, a 100 μm diameter Pt electrode. The effect is also evident at 100 and 1000 Vs−1, but is a smaller fraction of the bulk current. Similarly, the cathodic peak current shows a diminished amplitude, even at d = 60 μm, as the depletion of Ru(NH3)63+ by the substrate electrode reduces the magnitude of the cathodic peak current at the tip. At smaller tip-substrate distances, positive feedback becomes significant at Ep,a, as evidenced by a large increase in the peak current ratio at slow scan rates and very close distances (d < 2 μm at 10 Vs−1). At the same time, the cathodic peak current ratio is essentially unaffected by positive feedback and approaches zero as the concentration of Ru(NH3)63+ approaches zero near the substrate surface. In effect, the peak cathodic current ratio is a SG-TC measurement, whereas the anodic peak current contains both SG-TC and feedback information, especially at slow scan rates.
The dependence of the background-corrected peak current at d = 2 μm on scan rate over the range from 5 to 1000 Vs−1 is shown in Figure 8. These data further show that feedback interaction between the tip and substrate is greatly reduced at faster scan rates, regardless of whether the substrate is operated at an oxidizing or reducing potential. In both cases the peak cathodic current is least affected by scan rate, as the time for feedback becomes significant only at the lowest scan rates. Scan rates of approximately 500 Vs−1 or greater must be used to have minimal perturbation of the current at the anodic peak.
Figure 8.

Scan rate dependence of the peak current measured at a 7-μm diameter carbon fiber tip positioned 2 μm above a conductive substrate held at (A) +0.4 V and (B) −0.4 V. The peak current is normalized by the (■) peak cathodic or the (□) peak anodic current with the carbon fiber electrode in bulk solution.
FSCV-SECM Imaging at a Mixed Conductive and Insulating Substrate
The results of the previous section show that feedback effects can be minimized by using increased scan rates. This has important implications for chemical imaging with FSCV-SECM. To demonstrate how scan rate can be used to reduce or eliminate feedback effects while recording SG-TC chemical images, a 10 μm diameter Pt substrate electrode was imaged in the vertical plane (xd) by plotting the peak anodic current as a function of x and d. This current was used because it shows the greatest change between the bulk solution and the insulating and conducting substrates. Figure 9 shows these vertical images at scan rates of 10, 100, and 1000 Vs−1 for a 10 μm Pt substrate held at an oxidizing potential (Figure 9A–C) and at a reducing potential (Figure 9D–F). These images are a series of linescans progressing across the horizontal (x) axis from the insulator (at 0 μm < x < 17 μm) to the Pt substrate (17 μm < x < 27 μm) and back to the insulator (27 μm < x < 39 μm).
Figure 9.
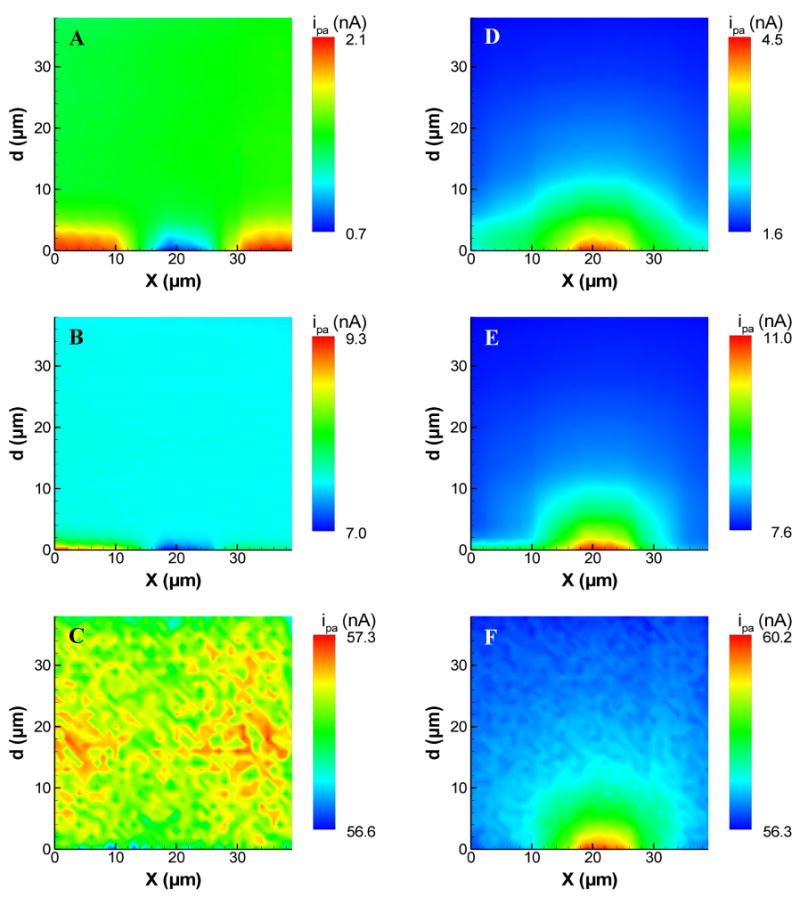
FSCV approach curves (recorded at Ep,a) as a function of distance along the x axis for a 10 μm diameter Pt substrate electrode centered at x ≈ 22 μm. The substrate was immersed in a solution of Ru(NH3)63+ and held at (A–C) +0.4 V or (D–F) −0.4 V. The data were recorded at (A,D) 10 Vs−1, (B,E) 100 Vs−1, and (C,F) 1000 Vs−1.
With the substrate set to an oxidizing potential of +0.4 V, only feedback interactions are observed. At scan rates of 10 and 100 Vs−1, anodic peak current increases near the insulator and decreases near the conductor. When the 7 μm tip electrode is between the insulating and conducting areas of the substrate, both effects combine to give essentially no change over a narrow range of x. More importantly, the vertical extent of the image greatly decreases with scan rate, and is totally indistinguishable from the noise at 1000 Vs−1.
When the substrate is set to a reducing potential of −0.4 V, both feedback and generator-collector effects are observed. This combination of effects is most notable at a scan rate of 10 Vs−1 (Figure 9D). The SG-TC image is seen as a semicircular region directly above the substrate. Above the insulator, however, there is a change in current (in the positive direction) resulting from the thin-layer behavior that occurs at the insulating substrate. While some feedback likely occurs directly above the substrate electrode, it should also produce an increase in current. As shown in Figure 7B, however, this effect occurs only very close to a conductive electrode and likely contributes only slightly to the SG-TC images. At faster scan rates, the semicircular region above the substrate remains, but the feedback effect at the insulator is diminished at 100 Vs−1 and is absent at 1000 Vs−1. The SG-TC image of the diffusion layer remains, however, demonstrating that chemical images can be recorded without feedback effects using FSCV-SECM.
FSCV-SECM Imaging of an Insulating substrate
Our primary interest in developing FSCV-SECM is to enable chemical imaging of biological substrates. Because such substrates can usually be treated as insulators (although under certain conditions they are capable of producing positive feedback similar to conductive substrates29-31), conditions can be chosen to eliminate feedback at spherical insulating substrates. Initially, we used polystyrene beads to simulate a cellular substrate, as these beads are similar in size to many types of cells and are insulators.
Figure 10 shows a series of SECM images recorded at the 10 μm diameter polystyrene bead pictured in panel A. For comparison purposes, a conventional SECM image (constant tip E = −0.4 V) of the bead is shown in panel E. Initially, images were recorded with d = 1 μm (L = 0.3) above the highest point of the bead and at scan rates of 10, 100, and 1000 Vs−1 (Figure 10B–D). As expected, the feedback interaction decreases with increasing scan rate, but an interesting phenomenon is observed at 10 Vs−1 (Figure 10B). The peak current is at a minimum at the apex of the bead, goes through a maximum, and then reaches a background level far from the bead. This behavior is the result of the shift of the peak potential at very close tip-substrate separations, and is essentially a manifestation of the inversion in the approach curve shown in Figure 3B. Because the bead is spherical, the tip-substrate separation increases at xy positions away from the bead's center. As shown in the approach curves of Figure 3, the peak current should increase until d = 3 μm, after which it will decrease with distance. The result is the ring-like image in Figure 10B. Such behavior is not evident at 100 Vs−1 because the tip-substrate separation at the bead apex is beyond this inverted region. However a distinct image is still visible, although its lateral extent is less than that of the conventional SECM image because only the upper portion of the bead is within imaging distance of the tip. At 1000 Vs−1, there is no image distinguishable above the noise, as the bead is not within the diffusion layer of the tip.
Figure 10.
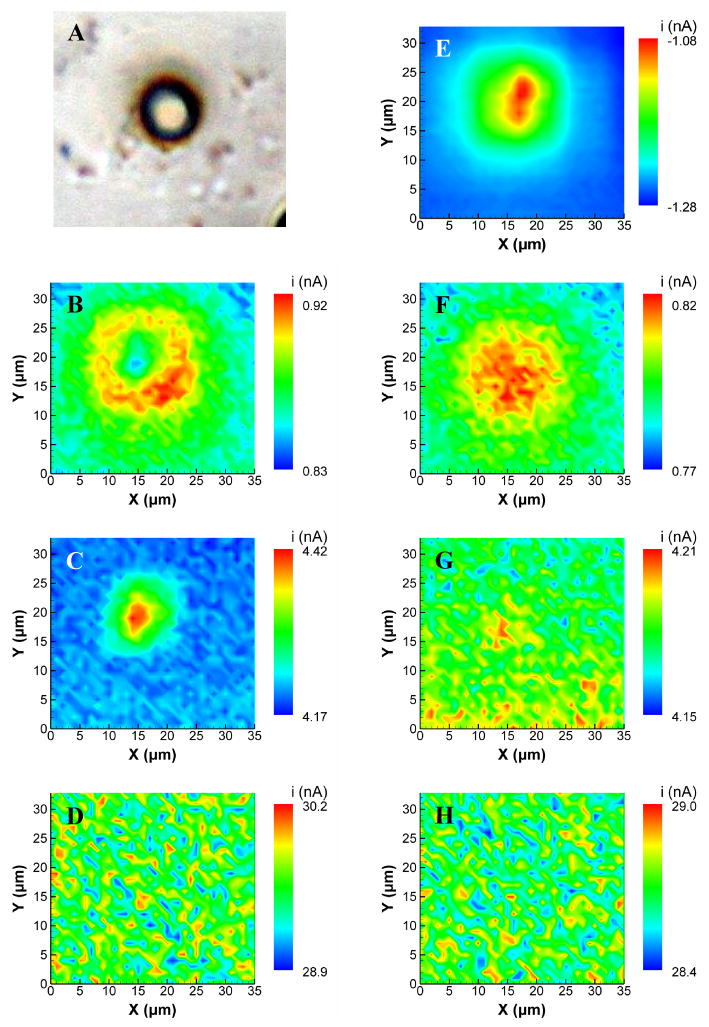
FSCV-SECM images of a spherical, 10 μm-diameter polystyrene bead. (A) Photomicrograph of the bead. Images were recorded at (B,F) ν = 10 Vs−1; (C,G) ν = 100 Vs−1; (D,H) ν = 1000 V s−1; and (E) a constant tip potential of −0.4 V. Images (B–D) were recorded at a constant height of 1 μm above the apex of the bead while images (F–H) were recorded at a constant height of 3 μm above the apex of the bead. Images are the average of 5 potentials around the peak anodic potential.
The images of Figure 10F–H were recorded under identical conditions to B–D except the electrode was raised to d = 3 μm above the highest point of the bead. At this distance, the electrode is just beyond the inverted region of the approach curve at 10 Vs−1, and therefore the image of Figure 10F no longer shows the ring shape. At 100 Vs−1, only a very slight change in current can be detected in the image, indicating that the tip-substrate distance is sufficient to nearly eliminate the image. As with d = 1 μm, there is no image visible at 1000 Vs−1 when d = 3 μm. These results show that feedback effects can be made negligible with appropriate selections of scan rate and/or tip-substrate separation.
To demonstrate that similar behavior is observed with a living biological substrate, a RAW 264.7 macrophage cell was used as a target substrate instead of a polystyrene bead. These immune cells are of interest to our laboratory, as they produce an oxidative burst when stimulated that generates products and/or byproducts that are detectable with FSCV-SECM.19 Figure 11 shows images recorded with the SECM using a RAW 264.7 substrate. The tip electrode was placed approximately 2 μm above the highest point of the cell, and imaging was conducted at a constant potential (Figure 11B), and at scan rates of 10, 100, and 1000 Vs−1 (Figures 11C,D, and E, respectively). Significant feedback is visible with a scan rate of 10 Vs−1, as this image closely resembles that recorded at constant potential. Feedback is still observable at 100 Vs−1, but is absent at 1000 Vs−1. As was the case with the model substrate, this data shows that feedback effects at real biological substrates can be reduced to negligible levels using faster scan rates, even at very close tip-substrate separations.
Figure 11.
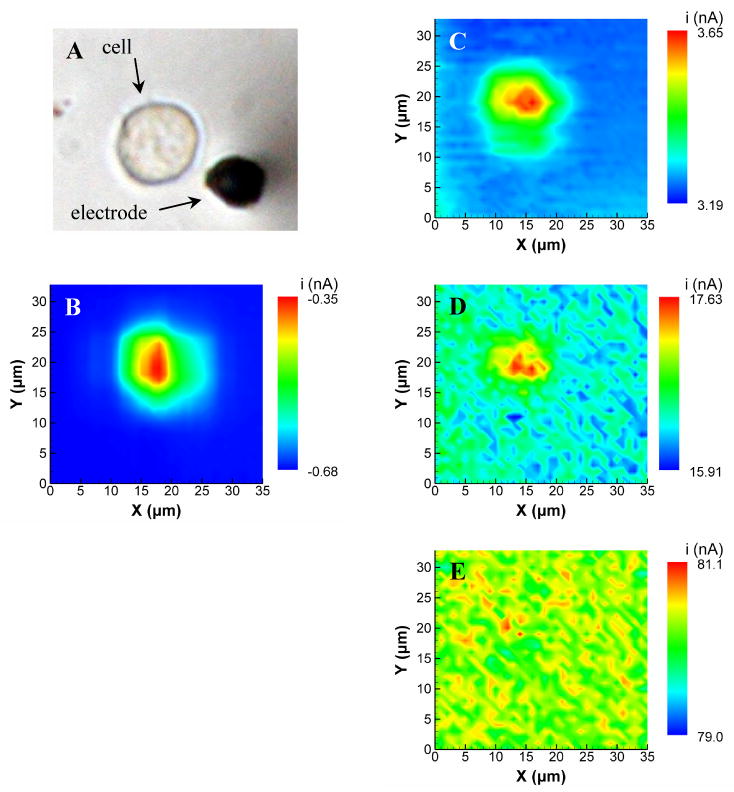
FSCV-SECM images of a RAW 264.7 cell. (A) Photomicrograph of the cell and the electrode used for imaging; (B) conventional feedback SECM image of the cell; and (C–E) FSCV-SECM images of a the cell. The SECM images were recorded at a constant height of approximately 2 μm above the highest point of the cell using 1.0 mM Ru(NH3)63+ as a mediator. Scan rates used for FSCV-SECM were (C) 10 Vs−1, (D) 100 Vs−1, and (E) 1000 Vs−1. FSCV-SECM images are the average of 5 potentials around the peak anodic potential.
Conclusions
We have shown that the combination of FSCV and SECM can be used for investigating processes occurring at both insulating and conducting substrates. Feedback effects are greatest at lower scan rates and at smaller tip-substrate separation distances. By avoiding conditions where feedback effects can occur, it is possible to obtain generator-collector images (SG-TC). Although the results of this work are somewhat qualitative, we are presently developing a quantitative theoretical treatment that will provide additional guidelines in terms of diffusion coefficients, switching potentials, and scan rates. This combination of the chemical selectivity of FSCV with the spatial resolution of the SECM promises to be a powerful tool for chemical imaging.
Acknowledgments
RAW 267.4 cells were provided by Dr. C. Frank Shaw. This work was supported by the National Institutes of Health (R15 NS050103-01).
References
- 1.Daniele S, Ciani I, Bragato C, Baldo MA. J Phys IV France. 2003;107:353–356. [Google Scholar]
- 2.Daniele S, Bragato C, Ciani I, Baldo MA. Electroanalysis. 2003;15:621–628. [Google Scholar]
- 3.Heien MLAV, Phillips PEM, Stuber GD, Seipel AT, Wightman RM. Analyst (Cambridge, U K) 2003;128:1413–1419. doi: 10.1039/b307024g. [DOI] [PubMed] [Google Scholar]
- 4.Venton BJ, Michael DJ, Wightman RM. J Neurochem. 2003;84:373–381. doi: 10.1046/j.1471-4159.2003.01527.x. [DOI] [PubMed] [Google Scholar]
- 5.Venton BJ, Troyer KP, Wightman RM. Anal Chem. 2002;74:539–546. doi: 10.1021/ac010819a. [DOI] [PubMed] [Google Scholar]
- 6.Michael D, Travis ER, Wightman RM. Anal Chem. 1998;70:586A–592A. doi: 10.1021/ac9819640. [DOI] [PubMed] [Google Scholar]
- 7.Zimmerman JB, Wightman RM. Anal Chem. 1991;63:24–28. doi: 10.1021/ac00001a005. [DOI] [PubMed] [Google Scholar]
- 8.Baur JE, Kristensen EW, May LJ, Wiedemann DJ, Wightman RM. Anal Chem. 1988;60:1268–1272. doi: 10.1021/ac00164a006. [DOI] [PubMed] [Google Scholar]
- 9.Bath BD, Michael DJ, Trafton BJ, Joseph JD, Runnels PL, Wightman RM. Anal Chem. 2000;72:5994–6002. doi: 10.1021/ac000849y. [DOI] [PubMed] [Google Scholar]
- 10.Heien MLAV, Johnson MA, Wightman RM. Anal Chem. 2004;76:5697–5704. doi: 10.1021/ac0491509. [DOI] [PubMed] [Google Scholar]
- 11.Hermans A, Seipel AT, Miller CE, Wightman RM. Langmuir. 2006;22:1964–1969. doi: 10.1021/la053032e. [DOI] [PMC free article] [PubMed] [Google Scholar]
- 12.Jackson BP, Dietz SM, Wightman RM. Anal Chem. 1995;67:1115–1120. doi: 10.1021/ac00102a015. [DOI] [PubMed] [Google Scholar]
- 13.O'Connor JJ, Kruk ZL. J Neurosci Methods. 1991;38:25–33. doi: 10.1016/0165-0270(91)90150-x. [DOI] [PubMed] [Google Scholar]
- 14.Iravani MM, Kruk ZL. Synapse (New York) 1997;25:93–102. doi: 10.1002/(SICI)1098-2396(199701)25:1<93::AID-SYN11>3.0.CO;2-#. [DOI] [PubMed] [Google Scholar]
- 15.Ciolkowski EL, Cooper BR, Jankowski JA, Jorgenson JW, Wightman RM. J Am Chem Soc. 1992;114:2815–2821. [Google Scholar]
- 16.Pihel K, Schroeder TJ, Wightman RM. Anal Chem. 1994;66:4532–4537. [Google Scholar]
- 17.Wightman RM, Wipf DO. In: Electroanalytical Chemistry. Bard AJ, editor. Vol. 15. Marcel Dekker, Inc.; New York: 1989. pp. 267–352. [Google Scholar]
- 18.Diaz-Ballote L, Alpuche-Aviles M, Wipf DO. J Electroanal Chem. In Press, Corrected Proof. [Google Scholar]
- 19.Schrock DS, Baur JE. Anal Chem. 2007 doi: 10.1021/ac071155t. to be submitted. [DOI] [PubMed] [Google Scholar]
- 20.Liebetrau JM, Miller HM, Baur JE, Takacs SA, Anupunpisit V, Garris PA, Wipf DO. Anal Chem. 2003;75:563–571. doi: 10.1021/ac026166v. [DOI] [PubMed] [Google Scholar]
- 21.Spaine TW, Baur JE. Anal Chem. 2001;73:930–938. doi: 10.1021/ac0011787. [DOI] [PubMed] [Google Scholar]
- 22.Kelly RS, Wightman RM. Anal Chim Acta. 1986;187:79–87. [Google Scholar]
- 23.Bard AJ, Faulkner LR. Electrochemical Methods: Fundamentals and Applications. Second Edition. John Wiley & Sons, Inc.; New York: 2001. [Google Scholar]
- 24.Baur JE, Wightman RM. J Electroanal Chem Interfacial Electrochem. 1991;305:73–81. [Google Scholar]
- 25.Kwak J, Bard AJ. Anal Chem. 1989;61:1221–1227. [Google Scholar]
- 26.Martin RD, Unwin PR. J Electroanal Chem. 1997;439:123–136. [Google Scholar]
- 27.Fosset B, Amatore C, Bartelt J, Wightman RM. Anal Chem. 1991;63:1403–1408. [Google Scholar]
- 28.Fosset B, Amatore CA, Bartelt JE, Michael AC, Wightman RM. Anal Chem. 1991;63:306–314. [Google Scholar]
- 29.Feng W, Rotenberg SA, Mirkin MV. Anal Chem. 2003;75:4148–4154. doi: 10.1021/ac0343127. [DOI] [PubMed] [Google Scholar]
- 30.Liu B, Cheng W, Rotenberg SA, Mirkin MV. J Electroanal Chem. 2001;500:590–597. [Google Scholar]
- 31.Liu B, Rotenberg SA, Mirkin MV. Proc Nat Acad Sci USA. 2000;97:9855–9860. doi: 10.1073/pnas.97.18.9855. [DOI] [PMC free article] [PubMed] [Google Scholar]