

Abstract
Cut muscle fibers from Rana temporaria (sarcomere length, 3.5–3.9 μm; 14–16°C) were mounted in a double Vaseline-gap chamber and equilibrated with an external solution that contained tetraethyl ammonium– gluconate and an internal solution that contained Cs as the principal cation, 20 mM EGTA, and 0 Ca. Fibers were stimulated with a voltage-clamp pulse protocol that consisted of pulses to −70, −65, −60, −45, and −20 mV, each separated by 400-ms periods at −90 mV. The change in total Ca that entered into the myoplasm (Δ[CaT]) and the Ca content of the SR ([CaSR]) were estimated with the EGTA/phenol red method (Pape, P.C., D.-S. Jong, and W.K. Chandler. 1995. J. Gen. Physiol. 106:259–336). Fibers were stimulated with the pulse protocol, usually every 5 min, so that the resting value of [CaSR] decreased from its initial value of 1,700–2,300 μM to values near or below 100 μM after 18–30 stimulations. Three main findings for the voltage pulses to −70, −65, and −60 mV are: (a) the depletion-corrected rate of Ca release (release permeability) showed little change when [CaSR] decreased from its highest level (>1,700 μM) to ∼1,000 μM; (b) as [CaSR] decreased below 1,000 μM, the release permeability increased to a maximum level when [CaSR] was near 300 μM that was on average about sevenfold larger than the values observed for [CaSR] > 1,000 μM; and (c) as [CaSR] decreased from ∼300 μM to <100 μM, the release permeability decreased, reaching half its maximum value when [CaSR] was ∼110 μM on average. It was concluded that finding b was likely due to a decrease in Ca inactivation, while finding c was likely due to a decrease in Ca-induced Ca release.
Keywords: excitation–contraction coupling, Ca release, skeletal muscle, sarcoplasmic reticulum
introduction
In vertebrate fast twitch skeletal muscle, contraction is initiated when depolarization of the surface and transverse (t)-tubular1 membranes causes calcium ions (Ca) to move from the lumen of the sarcoplasmic reticulum (SR) into the myoplasm, where it complexes with the Ca regulatory sites on troponin C. Schneider and Chandler (1973) described a nonlinear capacitative current in skeletal muscle in response to step depolarizations termed intramembranous charge movement. This signal started to become prominent at voltages near the threshold for contraction and it was suggested that it arises from movement of voltage sensors in the t-tubular membrane from a resting state to a state that activates Ca release from the SR. Later, Adrian and Peres (1979) identified two components of the movable charge, an early Q β component followed by a delayed or “hump” component called Qγ. Subsequent work employed various approaches to try to evaluate the relative contributions of Q β and Qγ (reviewed by Huang, 1988; Ríos and Pizarro, 1991; Schneider, 1994). In one of these approaches, Hui and Chandler (1991) found a statistically better fit to the overall charge (Q) vs. voltage (V) data with the sum of two Boltzmann functions as opposed to just one. The Boltzmann distribution function is given by
 |
1 |
where q
max is the maximum amount of charge,  is the voltage at which half the charge is moved, and k is the voltage-steepness factor. The value of k identified with the Qγ component was 3.3 mV on average, which was similar to the voltage steepness of Ca release and tension near the mechanical threshold (Baylor et al., 1979, 1983; Miledi et al., 1981; Maylie et al., 1987a, 1987b). This correlation and others have led to suggestions that the Qγ component is responsible for activating SR Ca release.
The voltage steepness of Ca release was also determined with small voltage pulses with the EGTA/phenol red method, a sensitive method for measuring Ca release developed in the laboratory of Knox Chandler (Pape et al., 1995). With this method, fibers are equilibrated with 20 mM EGTA and Ca release is estimated from the pH change caused by the release of protons when EGTA complexes Ca. With small voltage pulses, the density of Ca release sites is low (<1 in 104 channels are open at −75 mV) so that, in the presence of 20 mM EGTA, it is very unlikely that the open state of a Ca release site could have been influenced by Ca coming from a neighboring release site (Pape et al., 1995). A Ca release site here and throughout this article is considered to be a single SR Ca release channel activated via depolarization of the transverse tubule or a cluster of Ca release channels composed of a single such voltage-activated release channel together with any neighboring “slaved” channels activated via calcium-induced Ca release (CICR) or by some other mechanism. The rate of Ca release increased on average e -fold for 3.48 mV in the voltage range between −80 and −57 mV (Pape et al., 1995), a value close to the steepness factor of 3.3 mV for Qγ (Eq. 1 predicts that Qγ varies exponentially with voltage when  is several k values more negative than V). These results were taken as evidence that the voltage steepness of release is not due to Ca-dependent processes. They support the idea that SR Ca release is controlled by voltage sensors in the t-tubular membrane whose movement also gives rise to the Qγ signal. Measurements of the voltage steepness of Ca release at small voltages in addition to measurements of intramembranous charge movement were used to assess whether or not the voltage activation process remained stable during the long experiments in this article.
The experiments in this article were designed to establish whether or not Ca-dependent processes occur within a voltage-activated Ca release site (as defined above). Ca release was measured with the EGTA/phenol red method at small voltages (−70 to −60 mV) and at different levels of SR Ca content ([CaSR]). The idea of varying [CaSR] was to vary the free [Ca] at possible Ca binding sites on the myoplasmic side of SR Ca release channels. Solutions of the diffusion equation in the presence of 20 mM EGTA (Neher, 1986; Stern, 1992; Pape et al., 1995) indicate that the change in free [Ca] in the vicinity of an open Ca release channel should be proportional to the flux of Ca ions through the channel. Since the change in free [Ca] is predicted to be much greater than the resting free [Ca], it follows that free [Ca] in the vicinity of an open channel is approximately proportional to the Ca flux, which in turn should be proportional to the free [Ca] in the SR. The free [Ca] in the SR is expected to be approximately proportional to the SR Ca content during Ca release since calsequestrin complexes Ca with low affinity (MacLennan and Wong, 1971) and with rapid kinetics (Prieto et al., 1994). Therefore, the free [Ca] at a Ca binding site, (either on the same or an immediately adjacent release channel), should be approximately proportional to [CaSR].
One advantage of the EGTA/phenol red method is that it can give a direct estimate of [CaSR] at any time during a stimulation. This allows a determination of the depletion-corrected rate of Ca release that is expected to be approximately proportional to the Ca permeability of the SR. (For conciseness, the term “release permeability” is substituted for “depletion-corrected rate of Ca release” in this article.) The experimental goal in this article was to determine the release permeability as a function of [CaSR] at small voltages. Providing that the extent of voltage activation was unmodified, a nonconstant dependence on [CaSR] would be indicative of a Ca-dependent process acting at the level of a single Ca release site.
A major stimulus for the experiments in this article was the possibility of obtaining evidence for or against CICR in skeletal muscle. CICR plays an important role in the activation of SR Ca release in cardiac muscle, a process that requires external Ca. Although external Ca is not required for excitation–contraction coupling in skeletal muscle (Armstrong et al., 1972), various studies have suggested that some type of CICR process might still be involved. Addition of Ca has been shown to cause or enhance Ca release in skinned muscle fibers (Endo et al., 1968; Ford and Podolsky, 1968), in small microdissected sections of fibers (Fabiato, 1984), in heavy SR vesicles (e.g., Meissner, 1984), in Ca release channels reconstituted into planar lipid bilayers (Smith et al., 1986), in skinned muscle fibers stimulated by depolarization of sealed t-tubules (Lamb and Stephenson, 1991), and in depolarized cut skeletal muscle fibers (Klein et al., 1996). Experimental evidence in support of a role of CICR in normal voltage-activated Ca release has been less clear. In support of CICR, Jacquemond et al. (1991) reported that the rate of Ca release is reduced by the addition of 2–3 mM of the fast Ca buffer fura-2. In contrast to these results, Baylor and Hollingworth (1988), Hollingworth et al. (1992), Pape et al. (1993), and Jong et al. (1993) found that 2–3 mM fura-2 increased Ca release, consistent with a removal of Ca inactivation of Ca release. A reason for the different findings was never found, though it was suggested that they might be due to some unexplored difference(s) in the experimental conditions (Jong et al., 1993). In Pape et al. (1993) and Jong et al. (1993), a large decrease in Ca release was observed when [fura-2] increased from 2–4 to 6–8 mM, a finding that could be due to a decrease in CICR or to some pharmacological effect of fura-2. Based on measurements of Ca sparks with confocal microscopy, Klein et al. (1996) recently suggested that multiple channels (two to three) can open at a Ca release site in fibers held at −70 mV. Their results and the possibility that neighboring channels are activated via CICR are discussed in the discussion.
In the experiments in this study, an increase in release permeability with increasing [CaSR] would be consistent with the presence of CICR in normal voltage-activated Ca release. Ca inactivation of Ca release, another Ca-dependent mechanism acting on the SR Ca release channel, is an important and well-studied mechanism that serves to limit the amount of Ca that is released from the SR (Baylor et al., 1983; Simon et al., 1985, 1991; Schneider and Simon, 1988; Jong et al., 1995a ). Another aim of this article was to evaluate whether Ca inactivation operates at the level of an isolated Ca release site. A decrease in release permeability with increasing [CaSR] would be indicative of a reduction in Ca inactivation of Ca release.
materials and methods
The experiments were carried out at 13–14°C at sarcomere length of 3.5–3.9 μm on cut twitch fibers (Hille and Campbell, 1976) from semitendinosus or ileo-fibularis muscles isolated from Rana temporaria that were adapted to 6°C. The fiber preparation, mounting procedures, and electrical connections were identical to those described in Pape et al. (1995). One of the end pools, denoted 1, was used to measure potential and the other was used to inject current, denoted I2. Current was collected by a bath clamp that maintained the central pool at earth potential and converted the current to a voltage signal for detection. The potential in end pool 1, denoted V1, was maintained at −90 mV at rest by passing a small holding current. V1 was controlled with a voltage-clamp set-up made by the Yale University Physiology Electronics Lab (New Haven, CT) using conventional feedback electronics. The command pulses were rounded by a 0.5-ms time constant.
The temperature of the chamber was maintained by its contact with a copper block cooled by water from a regulated water bath equipped with a cooling condenser. This arrangement produced a stable temperature (fluctuations < ±0.2°C for periods >1 h).
Optical Measurements and Data Acquisition
The optical methods were similar to those described in Irving et al. (1987). Fig. 1 shows a diagram of the chamber mounted in a Zeiss Axiovert-100 inverted microscope (Carl Zeiss, Inc., Oberkochen, Germany). Briefly, when the shutter (S ) was opened, the fiber was illuminated with white light (∼400–850 nm) from a tungsten-halogen light source (TH ). The light emerging from the fiber was collected and split into three beams with two beam-splitting cubes (BSC ). The three wavelengths for the measurements were determined by three interference filters (F1, F2, and F3). A lens (L3) focused a beam onto one of the three photodiodes (PD). Each photodiode was connected to an operational amplifier circuit (not shown) made by the Yale University Physiology Electronics Lab, which had a 10 MΩ feedback resistor.
Figure 1.
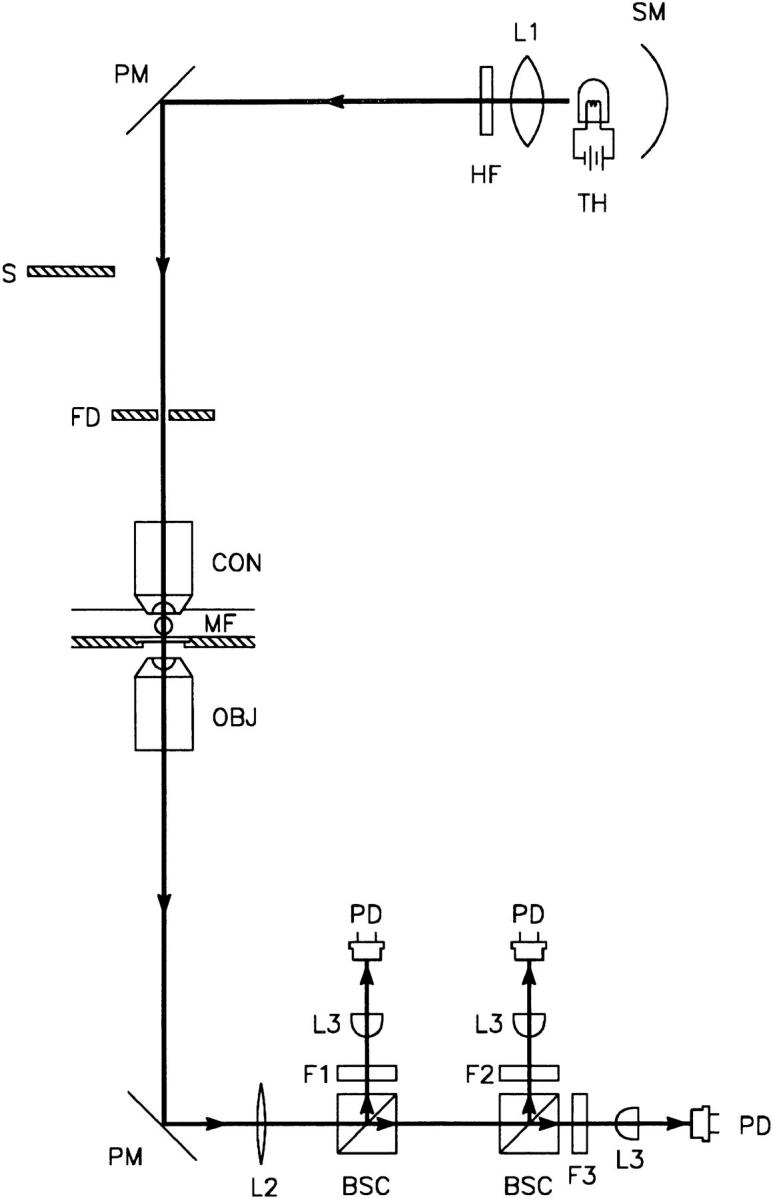
Schematic diagram of the optical apparatus used to simultaneously measure the intensities of transmitted light at three different wavelengths. SM, spherical mirror; TH, 100-W tungsten-halogen lamp powered by a regulated constant-current power supply (PAD16-18L; Kikusui Electronics Corp., Tokyo, Japan); L1, collecting lens; HF, heat filter; PM, plane mirror; S, computer-controlled shutter for limiting light exposed to muscle fiber; FD, field diaphragm for illuminating the fiber with a spot of light; CON, water immersion condenser objective (ICS Acroplan infinity-corrected objective, magnification 20×, with aperture stop to give NA 0.4; Carl Zeiss, Inc., Thornwood, NY) for focusing light onto the fiber; MF, muscle fiber in experimental chamber with a 0.16–0.19-mm glass coverslip at the bottom; OBJ, objective (LD Acroplan infinity-corrected objective, magnification 32×, NA 0.4; Carl Zeiss, Inc.) for collecting light from muscle fiber; PM, plane mirror in microscope that sends 100% of the light from OBJ to the side port; L2, lens (KPX115 plano-convex lens, F 400 mm; Newport Corp., Irvine, CA) for producing an approximately parallel beam; BSC, beam-splitting cube (Melles Griot, Irvine, CA) for splitting the light into two beams of equal intensity; F1, F2, and F3, three filters for selecting the wavelengths; L3, lens to focus light onto PD, a photodiode (UV-100B, EG&G, Electro-optics Div., Salem, MA).
The V1 and I2 signals passed through separate voltage followers (VF-4; World Precision Instruments, Sarasota, FL) and, together with the three photodiode signals, passed through separate instrumentation amplifier/filter channels constructed in the University of Sherbrooke's Electronics Lab. Each of the signals was filtered with a four-pole Bessel filter (824L8L-4; Frequency Devices Inc., Haverhill, MA) with its cutoff frequency set at 1 kHz. Separate switch-selectable amplifiers were placed before (gain of 1, 10, or 100) and after (gain of 1, 2, 5, or 10) the filter in each channel. The five signals were multiplexed and sampled by the 16-bit A/D converter in an ITC16-MAC computer interface device (Instrutech Corp., Great Neck, NY), which was connected to a Power Macintosh 7100 computer. D/A ports of the interface were also used to provide the command voltage to the voltage-clamp instrument and to control the shutter. Stimulation and sampling protocols written in C were downloaded into the ITC16-MAC interface, which then controlled the timing of the stimulation and the data acquisition during an experimental run.
Composition of the Internal and External Solutions
The Cs-glutamate solution that was used in the end pools contained 45 mM Cs-glutamate, 20 mM EGTA as a combination of the Cs salt and, if Ca was present, the Ca salt, 6.8 mM MgSO4, 5 mM Cs2-ATP, 20 mM Cs2-creatine phosphate, 5 mM Cs3-phospho(enol)pyruvate, and 5 mM 3-[N-morpholino]-propanesulfonic acid (MOPS). The solution with no Ca present is called the Ca-free Cs-glutamate solution. In the other internal solution used, the concentrations of Ca-complexed and Ca-free EGTA were 1.76 and 18.24 mM, respectively. The pH was adjusted to 7.0 by the addition of CsOH; at this pH, the calculated concentrations of free Ca and free Mg were 36 nM and 1 mM, respectively. The Cs salts of ATP, creatine phosphate, and phospho(enol)pyruvate were prepared as described in Pape et al. (1995).
The tetraethylammonium hydroxide (TEA)-gluconate solution that was used in the central pool contained 110 mM TEA-gluconate, 10 mM MgSO4, 1 μM tetrodotoxin (TTX), and 10 mM MOPS. Its pH was 7.1 and it was nominally Ca free.
Tetraethylammonium hydroxide was obtained from Aldrich Chemical Co., (Milwaukee, WI), creatine phosphate and TTX were obtained from Calbiochem-Novabiochem Corp. (La Jolla, CA), and all other compounds were obtained from Sigma Chemical Co. (St. Louis, MO). Phenol red was purified by a method similar to that used by Kendrick (1976) to purify Arsenazo III. Phenol red was dissolved in a solution containing n-butanol, pyridine, acetic acid, and water in the volume ratios 3:1:1:3, respectively, and passed through an anion-exchange column (Dowex 1-8 resin, 100–200 mesh size; Bio-Rad Laboratories, Richmond, CA) equilibrated with the same solution. Early samples from the column contained impurities as identified by their brown to amber color and their absorbance spectra, which differed from those of phenol red. Later samples were pooled together and the solvent was removed by freeze drying, followed by ether-water extractions to remove remaining pyridine as judged by the loss of a scent associated with pyridine. There were several indications that the product obtained from this procedure was not altered and that it was in fact purified phenol red. Absorbance spectra of aqueous solutions of the phenol red at different pH values were essentially the same as previously published spectra. The compound showed no apparent toxicity; all seven experiments in this article lasted for several hours. In addition, the rate of diffusion and extent of binding in the muscle were not significantly different from those determined previously (see results).
Estimation of Myoplasmic pH with Phenol Red
The method used to estimate the myoplasmic pH and changes in myoplasmic pH, denoted ΔpH, with phenol red was essentially the same as that described in Pape et al. (1995). The main differences in this article are that unpolarized light and different interference filters were used. In this article, a 10-nm bandpass interference filter centered at 480 nm, the isosbestic wavelength of phenol red, was used at position F3 in Fig. 1; a green filter with a bandpass range of 510–590 nm, a pH-sensitive range of phenol red, was used in position F1; and a long pass filter (Schott No. RG665) was used in position F2 to monitor the intrinsic absorbance of the fiber. All of these filters were obtained from Edmund Scientific (Barrington, NJ).
The concentration of phenol red at the optical site was estimated from the value of the indicator-related absorbance at 480 nm, denoted A ind(480), and the molar extinction constant of phenol red at 480, which was taken to be 1.1 × 10⁴ M−1 cm−1 (Lisman and Strong, 1979). The fractional amount of the phenol red in the nonprotonated form, f (see Irving et al., 1989), was estimated from
 |
2 |
in which r = A ind(green)/A ind(480). The values of r max and r min determined with cuvettes mounted on the set-up were 3.21 and 0.0541, respectively. The value of pH was calculated from the usual expression,
 |
3 |
with a value of 7.7 assumed for pK (Lisman and Strong, 1979).
Estimation of ΔpH and SR Ca Release
The indicator-related absorbance change during activity at the wavelength of the green filter, Δ A ind(green), was given by ΔA(green) − 1.23 · Δ A(RG665). The factor 1.23 was the same factor used to correct the active signals obtained with a 570-nm-centered filter for the intrinsic fiber absorbance estimated with a 690-nm-centered filter in Pape et al. (1995). The change in pH during activity (ΔpH) was estimated from Δ A ind(green) and the values of A ind(480), f, r max, and r min above as described in Pape et al. (1995). The noise in the Δ A(green) and Δ A(RG665) signals were first reduced with a 0.05 kHz digital Gaussian filter (Colquhoun and Sigworth, 1983) before the intrinsic correction was done.
The EGTA-phenol red method (Pape et al., 1995) was used to estimate the total amount of Ca released from the SR into the myoplasm (Δ[CaT]). Briefly, the two predominant forms of EGTA are H2EGTA2− and CaEGTA2− under the conditions of these experiments. When Ca binds to EGTA, two protons are released, producing a pH change that is measured with phenol red. Δ[CaT] is given by 0.5 β (the buffering power of myoplasm) × ΔpH. β was assumed to be 22 mM/pH unit (Pape et al. 1995). With 20 mM EGTA present in the myoplasm, almost all of the Ca that is released is rapidly captured by EGTA. The total amount of Ca in the SR (referred to as myoplasmic volume) is denoted as [CaSR] and is given by [CaSR]R − Δ[CaT], where [CaSR]R is the value of [CaSR] at the start of a stimulation (the subscript R refers to resting). [CaSR]R is estimated by the maximum value of Δ[CaT] during a stimulation that releases essentially all of the Ca from the SR. The rate of Ca release is given by dΔ[CaT]/dt. The depletion-corrected rate of release {100 × dΔ[CaT]/dt ÷ ([CaSR]R − Δ[CaT])}, in units of percent of SR Ca content released per millisecond, is expected to be approximately proportional to the Ca permeability of the SR. The depletion-correction method is similar to one that has been employed in Schneider's laboratory ( Jacquemond et al., 1991), though the method for estimating [CaSR]R is different. It is also the same method that has been used in Knox Chandler's laboratory (e.g., Jong et al., 1993; see Fig. 13 in Pape et al., 1995; Jong et al., 1995a ). For conciseness, the term “release permeability” is substituted for “depletion-corrected rate of Ca release” in this article.
Intramembranous Charge Movement
The Icm currents were obtained by subtracting off small ionic components from the Itest–Icontrol signals as described in Hui and Chandler (1990) and Jong et al. (1995b). Other aspects of the measurements are described in Chandler and Hui (1990) and Hui and Chandler (1990, 1991).
Statistical Tests of Significance
Two sets of results were considered to be significantly different if the Student's two-tailed t test parameter P was <0.05.
results
Voltage Protocol
The aim of this study was to determine the release permeability (see materials and methods for definition) over a range of voltages and at different levels of [CaSR]. In cut-fiber experiments, a long time is required to equilibrate the internal solution at the optical recording site with the end pools (several tens of minutes) and a long time (5 min or more) is required to reaccumulate Ca released in the presence of 20 mM EGTA, the amount present in these experiments. For these reasons, it was impractical to try to equilibrate a fiber at different levels of [CaSR] followed by a series of voltage-clamp measurements at each [CaSR] level. Fig. 2 shows the protocol adapted to obtain information at several voltages during a single experimental run. The top trace shows the voltage, which started and ended at the holding potential of −90 mV. Pulses to −70, −65, −60, −45, and −20 mV with durations of 400, 300, 300, 800, and 400 ms, respectively, were interspersed by 400-ms periods at −90 mV. The middle trace shows Δ[CaT] obtained with the EGTA-phenol red method. One purpose of the final pulses to −45 and −20 mV was to release all of the Ca from the SR to estimate [CaSR]R, the amount of Ca present in the SR at the start of the stimulation. The value of [CaSR]R is estimated as the maximum level of Δ[CaT], which was 2,043 μM in this case. The bottom trace shows the same trace plotted with an expanded vertical scale up until the start of the pulse to −45 mV.
Figure 2.

Illustration of stimulation protocol. The top trace shows the voltage measured in end pool 1. Given in order of application, pulses to −70, −65, −60, −45, and −20 mV had durations, respectively, of 400, 300, 300, 800, and 400 ms. The duration of the periods at −90 mV at the start and between the pulses were all 400 ms. Except where noted, this stimulation protocol was essentially the only one used during all of the experiments described in this article. The middle trace shows the Δ[CaT] trace measured with the EGTA-phenol red method. The maximum level of the trace is taken to be [CaSR]R. The bottom trace shows the same Δ[CaT] trace plotted with an expanded vertical axis; points after the start of the pulse to −45 mV are not shown. Fiber reference 510971; time after saponin treatment, 76 min; sarcomere length, 3.7 μm; fiber diameter, 107 μm; holding current, −37 nA; 14.5°C; concentration of phenol red at optical site, 1.65 mM; [CaSR]R, 2,043 μM; estimated pHR and free [Ca]R, 6.806 and 0.088 μM, respectively; interval of time between data points, 0.96 ms.
The main rationale for the five different pulses in the voltage protocol shown in Fig. 2 was to obtain information to help assess whether possible changes in release permeability could be due to changes in the voltage-sensing mechanism of E-C coupling. Since most of the charge at the small voltages (−70 to −60 mV) has been associated with Q β, measurements of charge movement (which contain both Q β and Qγ) would not be sensitive to changes in Qγ, the component of charge thought to reflect voltage activation of SR Ca release (see introduction). The main purpose for using three small voltages (−70, −65, and −60 mV) was to determine whether the voltage steepness of Ca release in this range was changed by varying [CaSR]R. Monitoring the amount of intramembranous charge moved by the pulses to −45 and −20 mV provided a rough method for assessing possible changes in the maximum amount of movable charge (Qmax) and/or a shift in the Q-V curve along the voltage axis or a change in the voltage steepness of charge movement.
One concern with using multiple pulses is that the response of a later pulse is influenced by the earlier pulses. Jong et al. (1995a) used a two-pulse protocol to study properties of Ca inactivation of Ca release produced by a 10–15-ms pulse to −20 mV. Under conditions similar to those employed here, they found that most of the Ca inactivation recovered with an exponential course with a time constant of ∼50 ms. The use of 400-ms intervals at −90 mV between each of the pulses should therefore be sufficient time for essentially complete recovery from this type of inactivation.
[CaSR]R Versus Time
Fig. 3 shows a plot of [CaSR]R vs. time after the saponin treatment for the experiment in Fig. 2. Point a is from the experimental run shown in Fig. 2. There was a significant decrease in [CaSR]R during the first three runs even though Ca was present in the internal solution. This type of initial rundown is typical of most fibers that have Ca in the internal solution, though some do not show any rundown. The reason for this rundown is unknown, though it might be related to the fact that [Ca2+] in the end-pool solution was estimated to be 36 nM; a value that is likely to be less than the resting myoplasmic [Ca2+] before the fiber was cut. After the first three stimulations, Ca was removed from the internal solution and the fiber was stimulated with the same voltage protocol applied, usually every 5 min. There was a progressive decrease in [CaSR]R with time as Ca diffused from the inside of the fiber to the end pools. The reason that the progressive decrease in [CaSR]R was not more rapid was that most of the released Ca was recaptured by the SR within 5 min so that only a fraction of the Ca escaped to the end pools. After point c (Fig. 3 ▾) was obtained, the delay until the next stimulation (▪) was reduced to <1 min. The decrease in [CaSR]R was mostly reversed with the following stimulation (▴), which was obtained 5 min later. 200 min after saponin treatment, Ca was reintroduced into the end pools and, with the exception of the □ symbols, [CaSR]R showed a progressive increase. This indicates that the decrease in [CaSR]R with no Ca present could be reversed, at least partially, by reintroducing Ca into the end pools.
Figure 3.

Time course of [CaSR]R plotted against time after saponin treatment of the fiber segments in the end pools. At 16 min, 0.8 mM phenol red was introduced into the end pools. The end-pool solution containing 1.76 mM Ca was present from the time of saponin treatment until 80 min, at which point Ca was removed from the end pools. The period in the 0-Ca solution is indicated by filled symbols and by the line labeled 0 Ca. At 203 min, 1.76 mM Ca was reintroduced into the end pools. The period of time between points was usually 5 min. The period of time was reduced to ∼1 min between the upside down triangle and the following square, and increased back to 5 min between the square and the following triangle. Point a was determined from the middle trace shown in Fig. 2. a–e correspond to traces shown in Fig. 4. Range of values from beginning to end of experiment: fiber diameter, 106– 111 μm; holding current, −37 to −128 nA; concentration of phenol red at optical site, 1.40–3.03 mM; estimated pHR, 6.802–6.707.
SR Ca Release Signals at Different [CaSR]R Values
Fig. 4 shows signals associated with points a–e in Fig. 3. Fig. 4 A, top, shows the voltage. The bottom traces show the Δ[CaT] signals. As seen in Fig. 3 and by the maximum value of the traces in Fig. 4 A (except for a, which does not show the signal after the start of the pulse to −45 mV), the value of [CaSR]R progressively decreased from a to d and increased in e after Ca had been reintroduced into the end pools. One important thing to note is that the fractional decrease in the amount of Ca released by the first three pulses from Fig. 4 A, a–b, is approximately equal to the fractional decrease in [CaSR]R from a–b. Another important thing to note is that the first three pulses in b, c, and e released about the same amount of Ca and had similar rates of Ca release (dΔ[CaT]/dt) even though [CaSR]R was much greater in b than in c and e. As indicated later, this could be due to Ca inactivation of Ca release associated with the greater [CaSR] values in b. Interestingly, dΔ[CaT]/dt during the pulse to −45 mV is much greater in b than in c and e despite the similarity of the signals during the pulses to the smaller voltages. Since one would have expected relatively more Ca inactivation of Ca release to occur at −45 mV compared with the smaller voltages, one possibility is that some type of extra activation component is present at −45 mV when the amount of Ca in the SR is relatively large. The possibility that this extra component is related to CICR is currently being explored.
Figure 4.

Voltage and Ca signals at different times. (A) The top trace shows voltage. The bottom traces show the five Δ[CaT] signals corresponding to Fig. 3, a–e. In a, points after just before starting the pulse to −45 mV are not shown. [CaSR]R values for a–e, respectively, were 2,043, 1,029, 267, 99, and 347 μM. (B, top) Same voltage trace as in A up to the start of the pulse to −45 mV. The bottom traces show 100 · ln{[CaSR]R/([CaSR]R − Δ[CaT])} determined from the Δ[CaT] signals in A (see text for explanation). A release permeability value for a given voltage was determined from the slope of the best-fit line to points during the pulse minus the average of the slopes of the lines during the periods at −90 mV on either side of the pulse. The points used in the fits are shown by the cross symbols; in every case, the first point used in the fit was 100 ms from the start of the interval and the last point was the last point of the interval.
As mentioned in the introduction, the aim in this study was to assess the effect of [CaSR] on the release permeability, which is calculated as 100 · dΔ[CaT]/dt ÷ ([CaSR]R − Δ[CaT]) (see materials and methods) to give units of percent of SR Ca content released per unit of time (percent/millisecond). If SR Ca release channels have a single conductance with a Ca flux that is proportional to the Ca content of the SR, then this release permeability should be proportional to the fraction of SR Ca release channels that are open. Because of noise in the signals at small values of [CaSR], the Ca release signals in Fig. 4 B are shown as 100 · ln{[CaSR]R ÷ ([CaSR]R − Δ[CaT])}. The slope at any time during one of these traces gives the corresponding release permeability. (This is easily demonstrated by taking the derivative of this relationship with respect to time, noting that [CaSR]R is constant during a stimulation.) These traces show that, for all three small voltage pulses, the release permeability was relatively unchanged when [CaSR]R decreased from 2,043 μM in a to 1,029 μM in b, increased when [CaSR]R decreased from 1,029 μM in b to 267 μM in c, and then decreased when [CaSR]R decreased further to 74 μM in d. This latter decrease was mostly reversed after Ca was added back to the internal solution and [CaSR]R increased to 347 μM in e. (The time courses of the release permeability signals are discussed later with Fig. 9.)
Figure 9.

Release permeability signals at −60 mV during an experiment. In A and B, the top trace shows voltage and the bottom traces show release permeability signals. (A) The five bottom traces show, in chronological order from top to bottom, the release permeability signals obtained at different [CaSR]R values, 2,043, 1,029, 562, 267, 150, and 99 μM. The release permeabilities from top to bottom were 0.025, 0.028, 0.073, 0.115, 0.074, and 0.035%/ms. The cursors show the points during the pulse used in the estimate of the release permeability and the line shows the average of the points in these signals. a–d corresponded to the similarly labeled points or traces in Figs. 3–5, 7, and 8. (B) The dotted release permeability traces (thicker lines) are the same traces shown at the same level in A, but plotted at a different gain. The trace plotted as a thin line in each pair is the same as c in A. The calibration bar applies to all of the release permeability traces. To reduce noise, the intrinsic absorbance signal was not subtracted from the ΔpH-sensitive absorbance signal in the bottom two traces in A and all of the release permeability traces were digitally filtered by an additional 0.01 kHz Gaussian filter.
One possible explanation for the dramatic changes in the calculated release permeability signals could be that there are large relative errors in the estimated values of [CaSR]R. For example, the greater release permeability signal in Fig. 4 B, c, relative to those shown in b and d, could occur if only a fraction of the Ca was released from the SR in c while essentially all of the Ca was released in b and d. As seen in Fig. 4 A, however, the Δ[CaT] trace c approached a maximum level well before the end of the series of pulses, consistent with the idea that essentially all of the Ca was released from the SR. In all of the other traces in the experiment of Fig. 4, and in the other experiments reported in this article, the time course of the Δ[CaT] signals approached a maximum level before the end of the series of pulses. This indicates that the results in Fig. 4 B and similar results from the other experiments are not attributable to an underestimation of [CaSR]R resulting from an incomplete release of Ca from the SR.
Fig. 5 shows plots of release permeability vs. [CaSR] for pulses to −60, −65, and −70 mV (A–C, respectively). The data were determined from the traces in Fig. 4 B (for a–e) and from similar traces from other stimulations from the same experiment. Each value is the difference of the slope during the pulse minus the average of the slopes during the periods at −90 mV before and after the pulse. Each slope was determined from the line fit to all points from 100 ms from the start of the interval to the end of the interval; the starting and end points are plotted as crosses in Fig. 4 B. The results for the three voltages had several features in common. As [CaSR] decreased from ∼2,300 to ∼1,000 μM, there was little if any significant change in the release permeability. As [CaSR] decreased further (Fig. 5, filled symbols), the release permeability increased significantly, reaching a maximum level when [CaSR] was 200–400 μM. As [CaSR] decreased further to below 100 μM, there was a significant decrease in release permeability. After Ca was added back to the internal solution (Fig. 5, open symbols), the release permeability increased as [CaSR] increased. This indicates that the decrease in release permeability with decreasing [CaSR] was at least partially reversible in this experiment.
Figure 5.

Release permeability vs. [CaSR]. Values of release permeability (determined as described in Fig. 4) are plotted vs. [CaSR] for pulses to −60, −65, and −70 mV in A–C, respectively. A [CaSR] value is the average of [CaSR]R − Δ[CaT] for the points during the pulse that were used to determine the release permeability (see Fig. 4). The definitions of the symbols (open vs. closed, circles, upside-down triangles, triangles, and squares) are given in Fig. 3. Points a–e correspond to similarly labeled points in Fig. 3 and traces in Fig. 4.
As shown in Fig. 3, [CaSR] was also decreased by decreasing the interval between stimulations from 5 min to ∼50 s. In Figs. 3 and 5, the upside-down triangles, squares, and triangles, respectively, show the results from the stimulations just before the decreased interstimulus period, just after the short period, and 5 min later. In Fig. 5, there was a clear decrease in release permeability as [CaSR] was decreased by the decrease in the interstimulus recovery period, both in the absence of Ca in the internal solution (▪) and after Ca was added back to the internal solution (□). (Note that there were two decreases in interstimulus periods after Ca was added back. In each panel, the open square at the smallest [CaSR] value corresponds to the pair of triangles with the smallest [CaSR] values. Also note that there is a filled square and an open square in the cluster of low points for the results at −60 mV.) The squares are close to values obtained later (Figs. 3 and 5, •) or earlier (○) in the experiment when the values of [CaSR] were similar. The values of release permeability shown by the triangles are close to those shown by the upside-side down triangles, indicating that the effect of decreasing [CaSR] in this way was reversible. Similar maneuvers when [CaSR]R was between 100 and 350 μM were done in five other experiments when no Ca was present and in four other experiments after Ca had been reintroduced into the internal solution. In each case, results similar to those in Fig. 5 were obtained.
Summary of Results from All Experiments
Table I summarizes the release permeability versus [CaSR] data in Fig. 5 and similar data from the six other experiments. All of the experiments had an approximately constant release permeability when [CaSR] was varied from its greatest value (1,800–2,200 μM) down to ∼1,100 μM, at which point it started to increase. Column 2 gives this plateau level, which was obtained by averaging all of the values with [CaSR]R between 1,200 and 1,900 μM. Column 3 gives the maximum release permeability, which was obtained by a least-squares fit of a quadratic function to points spanning the largest value obtained when no Ca was present in the end pools. Column 4 gives the ratio of the maximum value to the plateau value. Column 5 gives the value of [CaSR] at the maximum. Column 6 gives the value of [CaSR] when the release permeability was midway between the maximum and the plateau level. Column 7 gives the value of [CaSR] when the release permeability had decreased to half of its maximum value. A main conclusion from the mean and SEM values in Table I is that the release permeability versus [CaSR] data had essentially the same shape at all three voltages (−60, −65, and −70 mV). The relevant features that were not significantly different at the three voltages were: (a) a maximum in release permeability when [CaSR] was ∼300 μM on average (column 5), which was about sevenfold greater on average (column 4) than the plateau level, (b) a half-maximal effect of decreasing release permeability with increasing [CaSR] when [CaSR] was ∼520 μM on average (column 6), and (c) a half maximal effect of increasing release permeability with increasing [CaSR] when [CaSR] was ∼110 μM on average (column 7).
Table I.
Parameters Associated with Release Permeability vs. [CaSR] Data
| (1) | (2) | (3) | (4) | (5) | (6) | (7) | ||||||
|---|---|---|---|---|---|---|---|---|---|---|---|---|
| Fiber | Release permeability | Maximum dividedby plateau |
[CaSR] at maximum | [CaSR] midway between maximum and plateau level | [CaSR] at halfmaximum |
|||||||
| Plateau level | Maximum value | |||||||||||
| %/ms | %/ms | μM | μM | μM | ||||||||
| Results at −60 mV | ||||||||||||
| 509971 | 0.00718 | 0.03757 | 5.2 | 302 | 576 | 132 | ||||||
| 510971 | 0.02386 | 0.12300 | 5.2 | 272 | 479 | 111 | ||||||
| 513971 | 0.00480 | 0.02458 | 5.1 | 345 | 614 | 120 | ||||||
| 514972 | 0.00325 | 0.01612 | 5.0 | 361 | 554 | 135 | ||||||
| 515971 | 0.00872 | 0.09895 | 11.3 | 255 | 432 | 82 | ||||||
| 516972 | 0.03529 | 0.34860 | 9.9 | 220 | 470 | 83 | ||||||
| 724972 | 0.00314 | 0.01562 | 5.0 | 348 | 629 | 102 | ||||||
| Mean | 0.01232 | 0.09492 | 6.7 | 300 | 536 | 109 | ||||||
| SEM | 0.00469 | 0.04522 | 1.0 | 20 | 29 | 8 | ||||||
| Results at −65 mV | ||||||||||||
| 509971 | 0.00152 | 0.00736 | 4.8 | 338 | 642 | 112 | ||||||
| 510971 | 0.00564 | 0.02824 | 5.0 | 285 | 470 | 120 | ||||||
| 513971 | 0.00065 | 0.00746 | 11.5 | 284 | 452 | — | ||||||
| 514972 | 0.00044 | 0.00289 | 6.6 | 271 | 504 | — | ||||||
| 515971 | 0.00155 | 0.01470 | 9.5 | 256 | 400 | 67 | ||||||
| 516972 | 0.00831 | 0.09241 | 11.1 | 324 | 553 | 116 | ||||||
| 724972 | 0.00075 | 0.00362 | 4.8 | 329 | 533 | — | ||||||
| Mean | 0.00269 | 0.02238 | 7.6 | 298 | 508 | 104 | ||||||
| SEM | 0.00115 | 0.01213 | 1.1 | 12 | 30 | 12 | ||||||
| Results at −70 mV | ||||||||||||
| 509971 | 0.00045 | 0.00198 | 4.4 | 314 | 618 | — | ||||||
| 510971 | 0.00138 | 0.00700 | 5.1 | 257 | 430 | 93 | ||||||
| 513971 | 0.00018 | — | — | — | — | — | ||||||
| 514972 | — | — | — | — | — | — | ||||||
| 515971 | 0.00023 | 0.00211 | 9.2 | 350 | 523 | — | ||||||
| 516972 | 0.00180 | 0.01715 | 9.5 | 347 | 580 | 127 | ||||||
| 724972 | — | — | — | — | — | — | ||||||
| Mean | 0.00081 | 0.00706 | 7.1 | 317 | 538 | 110 | ||||||
| SEM | 0.00033 | 0.00356 | 1.3 | 22 | 41 | 17 | ||||||
Column 1 gives the fiber references. Column 2 gives the plateau levels of the release permeability, which is the average of the values when [CaSR] was between 1,200 and 1,900 μM. ([CaSR] is the average value of [CaSR] for the points during the pulse used for the determination of the release permeability.) Column 3 and 5 give, respectively, the maximum and the [CaSR] value at the maximum of a quadratic function fit to points near the maximum of the release permeability vs. [CaSR] data. Column 4 gives the ratio of column 3 to 2. Column 6 gives the value of [CaSR] half way between the maximum and the plateau level; this value was estimated from a quadratic function fit to points on the falling phase of the right-hand side of the bell-shaped release permeability vs. [CaSR] curve. Column 7 gives the value of [CaSR] when the release permeability was half of the maximum value; this value was estimated from the line fit to points on the rising phase (left-hand side) of the curve. The three sections of the table correspond to results from the pulses to −60, −65, and −70 mV. All of the mean values in columns 2 and 3 are significantly different from both of the other two mean values in the same column. None of the mean values in columns 4–7 are significantly different from either of the other two mean values in the same column.
Test of the Reversibility of the Effect of Varying [CaSR] between 1,100 and 350 μM by Decreasing the Interstimulus Interval
As discussed above, the increase of release permeability with increasing [CaSR] from 100 to 350 μM was shown to be reversible by decreasing the interstimulus interval from 5 min to ∼1 min. Fig. 6 shows the effect of this maneuver carried out at greater values of [CaSR]. Fig. 6 A (top) shows the voltage pulses to −70, −65, and −60 mV, and the bottom three traces show 100 · ln{[CaSR]R ÷ ([CaSR]R − Δ[CaT])}. (Recall from Fig. 4 B that the slopes of these latter signals give the release permeabilities.) The value of [CaSR]R for Fig. 6 f was 1,087 μM. Fig. 6 g was measured 43 s later and had a [CaSR]R value of 384 μM. There was a clear increase in the release permeability from f to g. This increase was mostly reversed in h, which was obtained 5 min later and had a [CaSR]R value of 874 μM. (The smaller signal to noise ratio of the signals in Fig. 6 A compared with those in Fig. 4 B is attributable to a smaller release permeability in Fig. 6 A. The large variation between fibers of the release permeabilities at similar values of [CaSR] is discussed below.)
Figure 6.

Release permeability results from another experiment. (A, top) Voltage. The bottom traces show 100 · ln{[CaSR]R/ ([CaSR]R − Δ[CaT])} (see Fig. 4 B for more details). [CaSR]R values for traces f–h were, respectively, 1,087, 387, and 874 μM. (B) Values of release permeability are plotted vs. [CaSR] for pulses to −60 mV. Points f–h correspond to the similarly labeled traces in A. The vertical line segments mark points in which the chronological order of the first three pulses was −60, −65, −70 mV instead of the usual −70, −65, −60 mV. See Fig. 5 for more details about how the points were determined and the definitions of the symbols. Fiber reference 724972; sarcomere length, 3.9 μm; 14.5°C; interval of time between data points, 0.96 ms. Table II gives additional information about this experiment.
Fig. 6 B shows a plot of release permeability vs. [CaSR] at −60 mV from Fig. 6 A (f–h) and from other stimulations in the same experiment. g and h agree reasonably well with the relationship between release permeability and [CaSR] established by other points in the experiment. Results very similar to these were obtained in the one other experiment (fiber reference 514972) in which [CaSR] was reversibly decreased from ∼1,000 to ∼350 μM by decreasing the interstimulus interval. These results indicate that the increase in the release permeability when [CaSR] decreases from ∼1,000 to 300–400 μM is reversible.
During the course of an experiment when no Ca is present in the internal solution, Ca is gradually lost from the fiber due to diffusion out of the ends of the fibers and, as a result, the free Ca concentration decreases. The results with decreased interstimulus intervals rule out the possibility that the effects of decreasing [CaSR] on release permeability are due to a decrease in resting free [Ca]. Decreasing the interstimulus period from 5 to 1 min should increase the free [Ca] before the stimulation, since more Ca is present in the myoplasm compared with just before the first stimulation. Likewise, the free [Ca] should return to a smaller value before the stimulation 5 min later, since most of the released Ca should have been pumped back into the SR.
The above results also indicate that the apparent effects of [CaSR] on release permeability are not due to some other type of long-term change in the fiber or in the experimental apparatus, since the stimulations just before and after the shortened interstimulus period and the stimulation 5 min later are all done within 6 min. One type of long-term change of particular concern would be a drift in the electrodes. Because of the steep voltage dependence of Ca release, a change in error of even 1 mV in the measurement of V1 could produce a significant change in SR Ca release.
Reversibility after Ca Was Introduced into the Internal Solution
In all experiments, Ca was introduced into the internal solution at some point in the experiment after [CaSR]R had decreased to <100 μM. In all experiments, the release permeability increased with increasing [CaSR] after this point. In the experiment of Figs. 2–5 and Table I (fiber reference 510971) and one other experiment (fiber reference 516972), there was a significant, continual increase in holding current that started within four stimulations after introducing Ca into the end pools. In these experiments, the release permeability values were similar to, though somewhat less than, the values at corresponding [CaSR] values during the period with 0 Ca in the internal solution when [CaSR] was declining from 300 to <100 μM (compare open symbols and filled symbols with [CaSR] <400 μM in Fig. 5). In the other five experiments, the holding currents were relatively stable for longer periods. In all of these latter experiments, the release permeability values after introducing Ca were significantly greater than the values at corresponding [CaSR] values during the period with 0 Ca when [CaSR] was declining from 300 to <100 μM (compare open symbols and filled symbols in Fig. 6 B). In two of the experiments (fiber references 513971 and 514972), plots (not shown) of the release permeability at −60 mV vs. [CaSR] showed maximums; these maximums occurred at similar values of [CaSR] (near 300 μM), but were about two and three times greater, respectively, than the maximums observed with 0 Ca. In the other experiments, [CaSR] values were not increased beyond ∼250 μM before significant increases in the holding currents occurred. The important conclusion from this section is that all experiments showed a reversal of the decline in the release permeability with decreasing [CaSR] when Ca was introduced into the internal solutions and [CaSR] was allowed to increase.
Order of Pulses Changed to −60, −65, −70, −45, and −20 mV
One problem with these experiments is that the signal to noise ratio of the Ca signals in response to the pulses to −70 mV was often very low when the [CaSR] values were small. Because of this, the signals were too small in several experiments to obtain meaningful values for several parameters listed in Table I. As a result, some of the conclusions from the results in Table I depend mainly on the results at −65 and −60 mV. Since it is possible that the results at −60 mV (−65 mV) were influenced by the earlier pulses to −70 and −65 mV (earlier pulse to −70 mV), an experiment (fiber reference 724972) was carried out in which the order of the first three pulses was reversed in several stimulations during the experiment. Therefore, the pulse to −60 mV was first and was not preceded by any depolarization. This protocol was carried out at several points during the experiment marked by the vertical line segments in Fig. 6 B. As seen in Fig. 6 B, the release permeability at −60 mV for these points matched well the release permeability vs. [CaSR] relationship established by the other stimulations in which the pulse to −60 mV came after the pulses to −70 and −65 mV. This indicates that the results at −60 mV listed in Tables I and III are not due to some influence of the earlier pulses to −70 and −65 mV in the stimulation.
Table III.
Intramembranous Charge Movement and Voltage Steepness of Release
| (1) | (2) | (3) | (4) | (5) | (6) | (7) | (8) | |||||||
|---|---|---|---|---|---|---|---|---|---|---|---|---|---|---|
| Fiber | n | Average [CaSR] | Release permeability | −Q OFF(−45) mean (SEM) | −Q OFF(−20) mean (SEM) | Q OFF(−45) ÷ Q OFF(−20) mean (SEM) | Voltage-steepness factor mean (SEM) | |||||||
| μM | %/ms | nC/μF | nC/μF | mV | ||||||||||
| [CaSR] between 1,100 and 1,900 μM | ||||||||||||||
| 509971 | 5 | 1519 | 0.0072 | 19.8 (0.2) | 28.2 (0.3) | 0.705 (0.005) | 3.50 (0.14) | |||||||
| 510971 | 5 | 1412 | 0.0232 | 19.6 (0.7) | 27.9 (0.7) | 0.704 (0.032) | 3.47 (0.06) | |||||||
| 513971 | 3 | 1415 | 0.0048 | 20.0 (1.4) | 30.3 (1.6) | 0.659 (0.012) | 3.50 (0.27) | |||||||
| 514972 | 2 | 1563 | 0.0033 | 19.3 (0.5) | 29.8 (0.8) | 0.649 (0.0003) | 3.44 (0.04) | |||||||
| 515971 | 3 | 1491 | 0.0087 | 20.6 (0.2) | 29.3 (0.2) | 0.703 (0.002) | 2.90 (0.22) | |||||||
| 516972 | 3 | 1435 | 0.0395 | 25.4 (0.0) | 34.2 (0.1) | 0.742 (0.003) | 3.47 (0.08) | |||||||
| 724972 | 3 | 1526 | 0.0033 | 19.0 (0.4) | 29.5 (0.2) | 0.642 (0.008) | 3.74 (0.42) | |||||||
| Mean | 1480 | 0.0129 | 20.5 | 29.9 | 0.686 | 3.43 | ||||||||
| SEM | 0.8 | 0.8 | 0.014 | 0.10 | ||||||||||
| [CaSR] near peak of release permeability vs. [CaSR] curve | ||||||||||||||
| 509971 | 5 | 277 | 0.0350 | 19.6 (0.4) | 29.1 (0.6) | 0.675 (0.020) | 3.09 (0.09) | |||||||
| 510971 | 5 | 304 | 0.1114 | 19.8 (0.3) | 30.0 (0.9) | 0.664 (0.024) | 3.21 (0.09) | |||||||
| 513971 | 4 | 336 | 0.0268 | 19.6 (0.7) | 28.6 (0.2) | 0.684 (0.023) | 3.42 (0.31) | |||||||
| 514972 | 4 | 335 | 0.0145 | 20.3 (0.8) | 31.0 (0.7) | 0.656 (0.021) | 2.77 (0.10) | |||||||
| 515971 | 4 | 270 | 0.0861 | 22.2 (0.4) | 33.8 (1.2) | 0.658 (0.011) | 2.53 (0.14) | |||||||
| 516972 | 5 | 176 | 0.3094 | 24.5 (0.5) | 33.8 (0.2) | 0.726 (0.014) | 3.76 (0.20) | |||||||
| 724972 | 4 | 293 | 0.0149 | 17.2 (0.6) | 27.6 (0.4) | 0.603 (0.014) | 3.20 (0.18) | |||||||
| Mean | 284 | 0.0855 | 20.5 | 30.6 | 0.667 | 3.14 | ||||||||
| SEM | 0.9 | 0.9 | 0.014 | 0.15 | ||||||||||
| [CaSR] at smallest values obtained | ||||||||||||||
| 509971 | 4 | 96 | 0.0121 | 19.7 (0.4) | 30.6 (0.7) | 0.646 (0.026) | 3.62 (0.84) | |||||||
| 510971 | 4 | 71 | 0.0270 | 18.1 (0.8) | 28.4 (1.0) | 0.638 (0.025) | 3.80 (0.27) | |||||||
| 513971 | 3 | 78 | 0.0074 | 19.7 (0.2) | 31.9 (0.3) | 0.618 (0.006) | — | |||||||
| 514972 | 2 | 94 | 0.0074 | 20.8 (1.7) | 33.7 (0.8) | 0.616 (0.036) | — | |||||||
| 515971 | 4 | 38 | 0.0271 | 25.5 (1.3) | 42.7 (2.3) | 0.599 (0.013) | 3.61 (0.41) | |||||||
| 516972 | 4 | 59 | 0.0487 | 25.3 (0.6) | 34.6 (0.9) | 0.733 (0.030) | 3.22 (0.13) | |||||||
| 724972 | 7 | 77 | 0.0076 | 18.3 (0.4) | 28.8 (0.6) | 0.635 (0.010) | — | |||||||
| Mean | 73 | 0.0196 | 21.1 | 33.0 | 0.641 | 3.56 | ||||||||
| SEM | 1.2 | 1.8 | 0.017 | 0.12 | ||||||||||
The three sections of this table give results for points near the plateau level, the maximum, and the minimal levels of the release permeability vs. [CaSR] curves. Column 1 gives the fiber references. Column 2 gives the number of points used in the determinations of columns 3–8. Column 3 gives the average value of [CaSR]. Column 4 gives the average of the release permeability at −60 mV. Columns 5 and 6 give the means and SEMs of the −Q OFF values for the pulses to −45 and −20 mV, respectively (see Fig. 7). Column 7 gives the mean and SEM of the ratio of the OFF charges at −45 and −20 mV. Column 8 gives the mean and SEM of the e -fold voltage-steepness factor of the release permeability for the pulses between −70 and −60 mV as described for Fig. 8.
Variability in Release Permeability between Fibers
One curious finding is the large spread in release permeabilities between the different fibers in columns 2 and 3 in Table I; there was an ∼11-fold (0.03529/ 0.00325) difference between the largest and smallest plateau levels of release permeability values at −60 mV and a 22-fold difference for the maximum rates (0.34860/ 0.01562). Interestingly, a similar large spread was not observed for the corresponding release permeability values at −45 mV, which had a less than threefold difference between the largest and smallest values at both the plateau levels and maximum levels of the release permeability vs. [CaSR] data (data not shown). As will be seen in Table III, the large spread at the small voltages cannot be attributed to differences in intramembranous charge movement or to differences in the voltage steepness of SR Ca release. To assess whether there could be other explanations, various experimental parameters are summarized in Table II. As mentioned in earlier studies (e.g., Pape et al., 1995), phenol red concentration vs. time data can be well fitted by a solution of the one-dimensional diffusion equation with the assumption that the concentration of bound phenol red is linearly related to the concentration of free phenol red in the myoplasm. Column 2 gives the apparent diffusion constant of phenol red and column 3 gives the value of R + 1, where R is the ratio of bound to free phenol red. Column 4 gives the time after saponin treatment for the results tabulated in Table I and for columns 5–9 in Table II; there was no Ca in the internal solution during this period in all of the fibers. Columns 5–9 give the first and last values of the fiber diameter, concentration of phenol red, resting pH, holding current, and apparent capacitance of the fiber, respectively. There was no apparent correlation between any of the parameters listed in Table II and the release permeability values in columns 2 and 3 of Table I.
Table II.
Various Experimental Parameters
| (1) | (2) | (3) | (4) | (5) | (6) | (7) | (8) | (9) | ||||||||
|---|---|---|---|---|---|---|---|---|---|---|---|---|---|---|---|---|
| Fiber | Dapp (×107) | R+1 | Time after saponin | Fiber diameter | Concentration of phenol red | pHR | Holding current | Capp | ||||||||
| cm2 · s−1 | min | μm | mM | nA | μF | |||||||||||
| 509971 | 3.73 | 2.74 | 85–200 | 116–122 | 1.54–2.31 | 6.877–6.731 | −42 to −51 | 0.01612–0.01614 | ||||||||
| 510971 | 3.34 | 3.63 | 86–199 | 108–111 | 1.87–3.03 | 6.796–6.707 | −35 to −78 | 0.01659–0.01519 | ||||||||
| 513971 | 3.04 | 4.12 | 67–156 | 81–74 | 1.58–3.09 | 6.686–6.591 | −35 to −44 | 0.01161–0.01220 | ||||||||
| 514972 | 4.15 | 3.86 | 59–116 | 88–88 | 1.62–2.86 | 6.707–6.696 | −45 to −57 | 0.01267–0.01332 | ||||||||
| 515971 | 4.35 | 2.93 | 57–161 | 147–159 | 1.10–2.53 | 6.793–6.837 | −49 to −68 | 0.02423–0.02532 | ||||||||
| 516972 | 3.48 | 3.85 | 59–131 | 126–128 | 1.41–2.81 | 6.637–6.653 | −69 to −114 | 0.02194–0.02163 | ||||||||
| 724972 | 3.92 | 2.32 | 64–177 | 91–92 | 1.02–1.91 | 6.714–6.762 | −40 to −46 | 0.01026–0.00983 |
Summary of various experimental parameters. Column 1 gives the fiber references. Columns 2 and 3 give the apparent diffusion constant and linear binding constant obtained from the fit of the diffusion equation to the concentration of phenol red vs. time data. Column 4 gives the time after saponin treatment for the data in Table I and in columns 5–9 of this table. Columns 5–9 give the first and last values for the times in column 4 of the fiber diameter, concentration of phenol red, resting pH, holding current, and apparent fiber capacitance, respectively.
One possible explanation for the large spread in the release permeabilities is that the condition of the fibers differed somehow. The condition of the frogs was probably similar, however, since the first six fibers were studied during a 1-wk period and the frogs were all treated in the same way. Since the large spread in release permeability values was not observed at −45 mV, one possibility is that there is some fiber to fiber variability in some activation and/or inactivation process(es) that is more pronounced at small voltages than at more positive voltages. Alternatively, there could be some process(es), perhaps Ca-feedback mechanism(s), that tend to equalize the release process at −45 mV, but not at the smaller voltages. Whatever the explanation, the effects of [CaSR] on release permeability summarized in Table I were similar for all of the fibers.
Effect of [CaSR] on Intramembranous Charge Movement
Fig. 7 A (top) shows voltage and Fig. 7 A (bottom) shows intramembranous charge movement (Icm) signals for the stimulations a–e in Figs. 3–5. The Icm signals are similar to those observed previously under essentially the same experimental conditions with gluconate as the principal external anion. In particular, the complex time courses of the ON Icm signals at −45 mV are consistent with two effects of SR Ca release on the kinetics of Iγ. One effect is a speeding up of the kinetics of Iγ with increasing rates of Ca release that were half maximal at −45 mV when [CaSR]R was 172 μM on average (Table III in Jong et al., 1995b ). The other is a slowing down of Iγ with increasing rates of Ca release that were half-maximal when [CaSR]R was 500–1,000 μM (Pape et al., 1996). The early decrease of the ON Icm signals at −45 mV in Fig. 7, a and b, compared with c –e, is due to this latter effect. Another thing to note is that there is not a clear distinction between an early Iβ component followed by a delayed Iγ hump component as is usually observed with other external anions. This result is consistent with the findings of Hui and Chen (1991) and Huang (1994) who concluded the Q β component is suppressed when gluconate is the external anion.
Figure 7.

Icm during the course of an experiment. In A–C, the top trace shows voltage and the bottom five traces show Icm signals determined for the same stimulations used for a–e in Fig. 3 and Fig. 5, and similarly labeled traces in Fig. 4. Points a–e shown on the right side of C apply to the five Icm traces in all three panels. A shows Icm for the full stimulation protocol. B and C show the OFF Icm for the pulses to −45 and −20 mV, respectively, on an expanded time scale. D shows −Q OFF plotted against time after saponin treatment for pulses to −60 (asterisks), −45 (open symbols), and −20 (filled symbols) mV. The definitions of the symbols (circles, upside-down triangles, triangles, and squares) are given in Fig. 3.
Although it is possible that [CaSR] also influences the kinetics of Iγ at the small voltages (−70 to −60 mV), the release permeabilities were determined when most of the steady state charge is expected to have moved (points ranging from 100 to 300–400 ms after the start of the pulse; see Figs. 4 B and 6 A). The main purpose of the charge movement signal in this study, therefore, was to assess whether changes in the amount of steady state intramembranous charge occurred during the experiments. Results from one fiber given in Fig. 6 of Pape et al. (1996) showed that the amount of steady state charge that moves is essentially independent of [CaSR]R for voltage pulses ranging from −80 to −10 mV. Since the experiments in this study are long, it seemed important to confirm that the steady state charge also did not change during the course of these experiments.
As expected for an intramembranous charge movement signal, Huang (1994) confirmed that the amount of charge that moves during the ON pulse (Q ON) is essentially the same as the amount that moves during the OFF pulse (Q OFF) when gluconate is the principal external anion. Because the ON Icm signal is slower than the OFF signal leading to more uncertainty in the correction for the nonlinear ionic component, it is generally considered more reliable to estimate the amount of charge that moves from the integral of the OFF Icm signal. Fig. 7, B and C, shows the OFF Icm signals at −45 and −20 mV, respectively, on expanded time scales. The time courses of the OFF Icm signals are similar in both B and C. Fig. 7 D plots the −Q OFF values vs. time after saponin treatment for the pulses to −60 (asterisks), −45 (open symbols), and −20 mV (filled symbols). There is some scatter in the data, particularly for the results at −20 mV, which is probably due to uncertainty in the correction for ionic currents. Assuming this is the case, it appears that there was not a significant change in the amount of charge that moves during the experiment at any voltage.
Fig. 8 A shows a semi-logarithmic plot of the release permeability vs. voltage for stimulations a–e in Figs. 3–5 and 7. The lines show the least squares best fits of an exponential function to the data. Fig. 8 B shows the voltage-steepness factor of the exponential function for the fits in A and for the other stimulations in the experiment. The values are approximately constant except for noise in the data close to when Ca was reintroduced into the end pools and the presence of a local minimum between b and c. Such a minimum was not observed in other fibers, and overall there were no consistent trends in the different experiments to indicate that the voltage steepness of Ca release varied with [CaSR] or with time during the experiment.
Figure 8.

Voltage steepness of Ca release during the course of an experiment. (A) The release permeability plotted against voltage for the same stimulations used for a–e in Figs. 3–5, and 7. Points a–e correspond to points plotted, respectively, as +, ○, •, ▴, and □. Each line corresponds to the least-squares best fit to the points of an exponential function given by C · e(V/k). (B) Plot of the voltage-steepness factor (k) plotted vs. time after saponin treatment for all of the points during the experiment. The definition of the symbols is given in Fig. 3. Points a–e are from the best-fit functions shown in A.
Table III summarizes charge movement and voltage-steepness results shown in Figs. 7 and 8, respectively, and analogous results from the other six experiments. The three sections of the table correspond to the following [CaSR] levels: (a) when [CaSR] was 1,100–1,900 μM (release permeability was at a plateau level in this range of [CaSR] values in all experiments; see Figs. 5 and 6 B), (b) when the largest release permeabilities were obtained, and (c) when [CaSR] was near or below 100 μM. Columns 5–7 show −Q OFF at −45 mV, −20 mV, and the ratio of these values, respectively. Column 8 shows the e -fold voltage-steepness factor of Ca release between −70 and −60 mV. The mean of the e -fold factor when [CaSR] was between 1,100 and 1,900 μM was 3.43 mV. This value is not significantly different than the value of 3.48 mV (SEM, 0.16 mV; n = 4) given in Pape et al. (1995) and determined under similar conditions, except that 1.76 mM Ca was present in the internal solution in their experiments.
As mentioned previously, the purpose of monitoring Q OFF values at −45 and −20 mV and the voltage steepness of release was to assess in a rough manner whether there might have been a change in the overall Q vs. V curve during the course of an experiment. An increase in the maximal amount of charge that could move (Q max) would be expected to increase the Q OFF values at both voltages (columns 5 and 6 in Table III). A shift in the Q vs. V relationship along the voltage axis would be expected to change the ratio of the Q OFF values (column 7). A shift in the voltage steepness of charge movement would also be expected to show up as a shift in the voltage steepness of Ca release measured with small voltage steps (column 8). An asterisk in the second (third) section indicates an average value that is significantly different from the corresponding average for the same fiber in the first (second) section. There was not a significant change in most of the values for columns 5–8 from the first to the second section and from the second section to the third. In addition, there were no significant changes in the mean of the averages (given at the bottom of the sections) between any of the sections for columns 5–8. In contrast, all of the changes in the release permeability in column 4 were significant between the first and second and between the second and third sections.
The conclusion from these results is that significant changes in intramembranous charge movement responsible for SR Ca release in the voltage range of interest, −70 to −60 mV, probably did not occur during the course of most of these experiments. Therefore, the effects of [CaSR] on release permeability (Fig. 5, Table I, and column 4 of Table III) cannot be attributed to long-term changes in intramembranous charge movement (associated either with the time of the experiment or with the decrease in [CaSR]).
Time Course of Release Permeability at Different [CaSR]R Values
A potential problem is that the time course of voltage activation at the small voltages changed during the course of these experiments. For reasons stated earlier, the intramembranous charge movement signal is not useful for assessing possible changes in voltage activation at small voltages. The aim of this section is to evaluate whether changes in the time course of the release permeability signal occurred and, if so, whether they reflect changes in the time course of voltage activation or some other process.
Fig. 9 A (top) shows a voltage pulse to −60 mV; the bottom traces show, in chronological order from top to bottom, release permeability signals obtained at different [CaSR] values. In Fig. 9 A, a and b correspond to points in the plateau region, c to the peak, and d to a minimal (to the left of the peak) value of the release permeability vs. [CaSR] curve in Fig. 5 A. The trace between b and c corresponds to a point about midway down the falling phase (right of the peak) in Fig. 5 A, and the trace between c and d corresponds to a point about midway up the rising phase (left of the peak). The cursors show the points during the pulse used in the estimate of the release permeability and the line is the average of the points in these signals. a and b rise rapidly to their maximal levels, where they remain unchanged for the remainder of the pulse. (Note that the final cursor is smaller than the maximum, because of the additional 0.01 kHz Gaussian filter that was applied to these traces because of noise in the bottom two traces.) In contrast, Fig. 9 A, c, continues to rise after 100 ms from the start of the pulse (first cursor) and appears to approach a maximum near the end of the pulse. A similar slow-terminating increase after 100 ms was observed in signals near the peak of the release permeability vs. [CaSR] curves in four of the other six experiments. In the other two, the release permeability signal approached its maximum close to 100 ms after the start of the pulse, though there was still a slowing of the time course when [CaSR] decreased from >1,000 to ∼300 μM.
The second and third release permeability signals from the top in Fig. 9 A are shown in B superimposed with c. All of the signals are plotted at the same gain. These pairs of traces indicate that the initial rising phases of the signals are approximately the same but that the signals at the larger [CaSR] values terminate early, whereas c continues to increase. In all experiments, the change in the time course from a fast to a slower terminating rising phase appeared to correspond with the increase in release permeability as [CaSR] decreased from >1,000 to ∼300 μM. Although changes in the time course of voltage activation cannot be ruled out, it seems more likely that the time course of voltage activation is the same but that the onset of Ca inactivation somehow prevents the later increase in the release permeability signal.
As illustrated by the bottom three traces in Fig. 9 A, there was no detectable change in the time course of the release permeability when [CaSR] decreased from ∼300 to <100 μM. Similar results were obtained in all of the other experiments, though changes could not always be ruled out at the smaller values of [CaSR] due to noise in the signals. These results suggest that the decrease in release permeability when [CaSR] decreased from ∼300 to <100 μM is not attributable to a change in the time course of voltage activation.
discussion
Evidence of Ca-dependent Regulatory Processes Operating on Isolated Voltage-activated Ca Release Sites
This article describes the effect of [CaSR] on the release permeability (depletion-corrected rate of Ca release) at three voltages, −70, −65, and −60 mV. The following main findings were observed for all three voltages (illustrated in Figs. 5 and 6 B). (a) The release permeability did not vary much when [CaSR] decreased from the highest level (1,700–2,300 μM) down to ∼1,000 μM. (b) As [CaSR] decreased below 1,000 μM, the release permeability increased and reached a maximum that was 5–12× larger than the plateau level when [CaSR] was >1,000 μM; the maximum occurred when [CaSR] was near 300 μM (columns 4 and 5 in Table I). (c) The average [CaSR] value when the release permeability was midway between the plateau level and the maximum was ∼520 μM (column 6 in Table I). (d) There was a significant decrease in the release permeability when [CaSR] decreased below 300 μM; the release permeability was half of the maximum value when [CaSR] was ∼110 μM (column 7 in Table I).
There was little, if any, change in the amount of intramembranous charge moved at −45 or −20 mV or in the voltage steepness of Ca release (Figs. 7 and 8 and Table III). These results suggest indirectly that the effects of [CaSR] were not due to a change in the activating charge movement. Effects b and d above were shown to be reversible. Long term changes during the experiment, including changes in resting free Ca concentration or a drift in the electrodes, were also ruled out. It seems reasonable to conclude, therefore, that findings a–d above were due to effects of [CaSR] on the activation state of SR Ca release channels.
Tripathy and Meissner (1996) recently reported effects of lumenal [Ca2+] on the open probability (P o) of SR Ca release channels from mammalian muscle reconstituted into planar lipid bilayers. There was a significant increase in P o when lumenal [Ca2+] was increased from <0.1 to ∼250 μM, and a decrease in P o when lumenal [Ca2+] was increased to millimolar levels. By varying the Ca flux through the channel independently of lumenal [Ca2+], they concluded that the effects were due to the Ca flux rather than a direct effect of lumenal [Ca2+]. The effects of varying Ca flux on P o were mainly due to modulation of the mean open times of the channels, as opposed to the frequency of channel openings. Even though Ca flux was initiated by t-tubular depolarization in this study and by ATP in their study, it seems reasonable to suppose that the bimodal dependence of Ca release on lumenal Ca in this study may also have been due, at least in part, to modulation by Ca of the mean open time of the Ca release channels. If the single channel results apply to the intact system, then the additional conclusion of Tripathy and Meissner (1996) that the activation and inactivation Ca binding sites are on the myoplasmic side of the channels rather than the lumenal side should also apply to the effects described in this article.
As mentioned in the introduction, the principal aim of this study was to evaluate whether Ca feedback mechanisms act at the level of a single Ca release site activated by voltage. A Ca release site was defined to be a single SR Ca release channel activated via t-tubular depolarization or a cluster of Ca release channels composed of a single such voltage-activated release channel together with any immediately neighboring “slaved” channels activated via CICR or by some other mechanism. The results in this article are consistent with the regulation of a voltage-activated SR Ca release site by both Ca inactivation and by some type of CICR mechanism acting at Ca binding sites accessible to Ca released at the site.
It is not possible to determine from the results in this article whether these regulatory processes act at the level of a single SR Ca release channel or whether multiple channels are involved.
Possibility of Multiple Channel Openings at a Calcium Release Site
With confocal microscope imaging of muscle fibers containing a fluorescent Ca indicator, it has become possible in recent years to observe small release events termed calcium sparks. Klein et al. (1996) recently reported that calcium spark events were often larger when fibers were held at −70 mV compared with −90 mV. Assuming that the calcium sparks at −90 mV corresponded to the opening of a single Ca release channel, they showed that the larger calcium sparks at −70 mV could have been produced by multiple (two or three) channel openings within a single Ca spark. If this is in fact the explanation for the larger sparks, then multiple open channel events would also be expected to have occurred at individual calcium release sites at small voltages in the experiments in this article. Solutions of the diffusion equation indicate that the buffering action of 20 mM EGTA is not fast enough to produce a significant decrease in Δ[Ca2+] 30 nm from an open channel (Fig. 15 A in Pape et al., 1995; see also Neher, 1986; Stern, 1992). Therefore, the activation of neighboring channels via CICR, if it occurs, should not have been significantly affected by the presence of 20 mM EGTA in the experiments in this article.
One question (relevant to E-C coupling in both skeletal and cardiac muscles) is how would it be possible to activate neighboring channels via CICR without producing an all-or-none response. An all-or-none response would appear inevitable since Ca from a channel opened by CICR would then open its neighbor by CICR and so on. Stern et al. (1997) recently addressed this problem with a Monte-Carlo simulation of the Ca release process in skeletal muscle. Although several of the assumptions in their model are debatable, the results do suggest that the spread of release into an all-or-none response could be terminated by Ca inactivation of Ca release.
Based on the background in the last two paragraphs, the following scenario gives one possible explanation for the results at small voltages in this article. Under normal physiological conditions ([CaSR] > 1,000 μM), two to three channels open in about half of the Ca release sites and only one channel in the other sites (from Klein et al., 1996). When [CaSR] decreases to 300 μM, termination via Ca inactivation of Ca release is reduced so that there is an increased probability of multiple channel openings, perhaps with as many as 5–15 channels open at a site. When [CaSR] decreases further to below 100 μM, there is a decrease in multiple channel openings due to a decrease in the ability to activate neighboring channels via CICR.
To have acceptance of this scenario, it seems important to have additional evidence to support the conclusions of Klein et al. (1996) given above. One problem was that their conclusions were based on three of six fibers that happened to show a much greater frequency (by a factor of ∼45 in one fiber) of Ca sparks at −90 mV than expected from activation of the voltage sensors. Since the process responsible for the initiation of the Ca sparks was apparently different at −90 and −70 mV in those fibers, the termination of the sparks may also have occurred via different processes, thereby accounting for differences in the magnitude of the sparks. Even if the termination of the sparks was due to a return of the voltage sensor to a nonactivating state at both −90 and −70 mV, it is possible that the larger spark size at −70 mV was due to a slower transition rate between the activating and nonactivating state of the voltage sensor. Another problem is that there does not seem to be an easy explanation of why Ca from an open channel would be able to open neighboring channels via CICR at −70 but not −90 mV.
Possibility that Only a Single Channel Opens at a Calcium Release Site
It is not necessary to postulate multiple channel openings at a Ca release site to explain the results in this article. It is possible that Ca release channel opening in an intact muscle requires a direct connection with an activated t-tubular voltage sensor so that no channel can be opened by CICR alone. As with the single channel results of Tripathy and Meissner (1996), Ca bound to the activation site would somehow increase the mean open time of the Ca release channel while Ca bound to the inactivation site closes the channel. The channel would still be under voltage control, consistent with the observation that SR Ca release terminates when a fiber is repolarized to the holding potential. If this scenario is correct, it would explain how it is possible to have CICR without producing an all-or-none response.
This scenario would not be in agreement with the proposal of Ríos and Pizarro (1988) (also see Shirokova et al., 1996; Shirokova and Ríos, 1997) that half the Ca release channels are activated by voltage and the other half by CICR in frog muscle. This proposal was stimulated by the observation of Block et al. (1988) and Franzini-Armstrong and Kish (1995) that alternate foot proteins (SR Ca release channels) are not coupled to dihydropyridine receptors (voltage sensors). If multiple channel openings at Ca release sites did not occur, these uncoupled Ca release channels would have to have been silent; i.e., not opened by CICR.
Acknowledgments
We thank the staff of the Biomedical Instrumentation Laboratory of the Yale Department of Cellular and Molecular Physiology for the design and construction and W.K. Chandler for the design of the voltage-clamp electronics. We also thank the Atelier Central Electronique-Mécanique of the Université de Sherbrooke Faculté de Médecine for help with the design and construction of equipment. We thank Drs. S.M. Baylor, W.K. Chandler, and E. Rousseau for reading the manuscript and providing useful criticism.
This work was supported by Medical Research Council of Canada grant MT-12552 and a grant from Fonds de la Recherche en Santé du Québec.
Abbreviations used in this paper
- CICR
calcium-induced Ca release
- Q
overall charge
- SR
sarcoplasmic reticulum
- t-tubule
transverse tubule
- V
voltage
references
- Adrian RH, Peres A. Charge movement and membrane capacity in frog muscle. J Physiol (Camb) 1979;289:83–97. doi: 10.1113/jphysiol.1979.sp012726. [DOI] [PMC free article] [PubMed] [Google Scholar]
- Armstrong CM, Bezanilla F, Horowicz P. Twitches in the presence of ethylene glycol-bis(β-aminoethylether)-N,N′-tetraacetic acid. Biochim Biophys Acta. 1972;267:605–608. doi: 10.1016/0005-2728(72)90194-6. [DOI] [PubMed] [Google Scholar]
- Baylor SM, Chandler WK, Marshall MW. Arzenazo III signals in singly dissected frog twitch fibers. J Physiol (Camb) 1979;287:23–24. [PubMed] [Google Scholar]
- Baylor SM, Chandler WK, Marshall MW. Sarcoplasmic reticulum calcium release in frog skeletal muscle fibres estimated from arsenazo III calcium transients. J Physiol (Camb) 1983;334:625–666. doi: 10.1113/jphysiol.1983.sp014959. [DOI] [PMC free article] [PubMed] [Google Scholar]
- Baylor SM, Hollingworth S. Fura-2 calcium transients in frog skeletal muscle fibres. J Physiol (Camb) 1988;403:151–192. doi: 10.1113/jphysiol.1988.sp017244. [DOI] [PMC free article] [PubMed] [Google Scholar]
- Block BA, Imagawa T, Campbell KP, Franzini-Armstrong C. Structural evidence for direct interaction between the molecular components of the transverse tubule/sarcoplasmic reticulum junction in skeletal muscle. J Cell Biol. 1988;107:2587–2600. doi: 10.1083/jcb.107.6.2587. [DOI] [PMC free article] [PubMed] [Google Scholar]
- Chandler WK, Hui CS. Membrane capacitance in frog cut twitch fibers mounted in a double Vaseline-gap chamber. J Physiol (Camb) 1990;96:225–256. doi: 10.1085/jgp.96.2.225. [DOI] [PMC free article] [PubMed] [Google Scholar]
- Colquhoun, D., and F.J. Sigworth. 1983. Fitting and statistical analysis of single-channel records. In Single-Channel Recording. B. Sakmann and E. Neher, editors. Plenum Publishing Corp., New York. 191–263.
- Endo M, Tanaka M, Ebashi S. Release of calcium from sarcoplasmic reticulum in skinned fibers of the frog. Proc Intl Congr Physiol Sci. 1968;7:126. [Google Scholar]
- Fabiato A. Dependence of the Ca2+-induced release from the sarcoplasmic reticulum of skinned skeletal muscle fibers from the frog semitendinosus on the rate of change of free Ca2+concentration at the outer surface of the sarcoplasmic reticulum. J Physiol (Camb) 1984;353:56. [Google Scholar]
- Ford LE, Podolsky RJ. Force development and calcium movements in skinned muscle fibers. Fed Proc. 1968;27:375. [Google Scholar]
- Franzini-Armstrong C, Kish JW. Alternate disposition of tetrads in peripheral couplings of skeletal muscle. J Muscle Res Cell Motil. 1995;16:319–324. doi: 10.1007/BF00121140. [DOI] [PubMed] [Google Scholar]
- Hille B, Campbell DT. An improved Vaseline gap voltage clamp for skeletal muscle fibers. J Gen Physiol. 1976;67:265–293. doi: 10.1085/jgp.67.3.265. [DOI] [PMC free article] [PubMed] [Google Scholar]
- Hollingworth S, Harkins AB, Kurebayashi N, Konishi M, Baylor SM. Excitation-contraction coupling in intact frog skeletal muscle fibers injected with molar concentrations of fura-2. Biophys J. 1992;63:224–234. doi: 10.1016/S0006-3495(92)81599-0. [DOI] [PMC free article] [PubMed] [Google Scholar]
- Huang CL-H. Intramembrane charge movements in skeletal muscle. Physiol Rev. 1988;68:1197–1247. doi: 10.1152/physrev.1988.68.4.1197. [DOI] [PubMed] [Google Scholar]
- Huang CL-H. Charge conservation in intact frog skeletal muscle fibres in gluconate-containing solutions. J Physiol (Camb) 1994;474:161–171. doi: 10.1113/jphysiol.1994.sp020010. [DOI] [PMC free article] [PubMed] [Google Scholar]
- Hui CS, Chandler WK. Intramembranous charge movement in frog cut twitch fibers mounted in a double Vaseline-gap chamber. J Gen Physiol. 1990;96:257–297. doi: 10.1085/jgp.96.2.257. [DOI] [PMC free article] [PubMed] [Google Scholar]
- Hui CS, Chandler WK. Q β and Qγcomponents of intramembranous charge movement in frog cut twitch fibers. J Gen Physiol. 1991;98:429–464. doi: 10.1085/jgp.98.3.429. [DOI] [PMC free article] [PubMed] [Google Scholar]
- Hui CS, Chen W. Differential suppression of charge movement components by gluconate in cut twitch fibres of Rana temporaria. . J Physiol (Camb) 1991;489:511–517. doi: 10.1113/jphysiol.1995.sp021068. [DOI] [PMC free article] [PubMed] [Google Scholar]
- Irving M, Maylie J, Sizto NL, Chandler WK. Intrinsic optical and passive electrical properties of cut frog twitch fibers. J Gen Physiol. 1987;89:1–40. doi: 10.1085/jgp.89.1.1. [DOI] [PMC free article] [PubMed] [Google Scholar]
- Irving M, Maylie J, Sizto NL, Chandler WK. Simultaneous monitoring of changes in magnesium and calcium concentrations in frog cut twitch fibers containing antipyrylazo III. J Gen Physiol. 1989;93:585–608. doi: 10.1085/jgp.93.4.585. [DOI] [PMC free article] [PubMed] [Google Scholar]
- Jacquemond V, Csernoch L, Klein MG, Schneider MF. Voltage-gated and calcium-gated calcium release during depolarization of skeletal muscle fibers. Biophys J. 1991;60:867–873. doi: 10.1016/S0006-3495(91)82120-8. [DOI] [PMC free article] [PubMed] [Google Scholar]
- Jong D-S, Pape PC, Chandler WK. Calcium inactivation of calcium release in frog cut muscle fibers that contain millimolar EGTA or fura-2. J Gen Physiol. 1995a;106:337–388. doi: 10.1085/jgp.106.2.337. [DOI] [PMC free article] [PubMed] [Google Scholar]
- Jong D-S, Pape PC, Chandler WK. Effect of sarcoplasmic reticulum calcium depletion on intramembranous charge movement in frog cut muscle fibers. J Gen Physiol. 1995b;106:659–704. doi: 10.1085/jgp.106.4.659. [DOI] [PMC free article] [PubMed] [Google Scholar]
- Jong D-S, Pape PC, Chandler WK, Baylor SM. Reduction of calcium inactivation of sarcoplasmic reticulum calcium release by fura-2 in voltage-clamped cut twitch fibers from frog muscle. J Gen Physiol. 1993;102:333–370. doi: 10.1085/jgp.102.2.333. [DOI] [PMC free article] [PubMed] [Google Scholar]
- Kendrick NC. Purification of arsenazo III, a Ca2+-sensitive dye. Anal Biochem. 1976;76:487–501. doi: 10.1016/0003-2697(76)90342-0. [DOI] [PubMed] [Google Scholar]
- Klein MG, Cheng H, Santana LF, Jiang Y-H, Lederer WJ, Schneider MF. Two mechanisms of quantized calcium release in skeletal muscle. Nature. 1996;379:455–458. doi: 10.1038/379455a0. [DOI] [PubMed] [Google Scholar]
- Lamb GD, Stephenson DG. Effect of Mg2+ on the control of Ca2+release in skeletal muscle fibres of the toad. J Physiol (Camb) 1991;434:507–528. doi: 10.1113/jphysiol.1991.sp018483. [DOI] [PMC free article] [PubMed] [Google Scholar]
- Lisman JE, Strong JA. The initiation of excitation and light adaptation in Limulus ventral photoreceptors. J Gen Physiol. 1979;73:219–243. doi: 10.1085/jgp.73.2.219. [DOI] [PMC free article] [PubMed] [Google Scholar]
- MacLennan DH, Wong PTS. Isolation of a calcium-sequestering protein from sarcoplasmic reticulum. Proc Natl Acad Sci USA. 1971;68:1231–1235. doi: 10.1073/pnas.68.6.1231. [DOI] [PMC free article] [PubMed] [Google Scholar]
- Maylie J, Irving M, Sizto NL, Chandler WK. Comparison of arsenazo III optical signals in intact and cut frog twitch fibers. J Gen Physiol. 1987a;89:41–81. doi: 10.1085/jgp.89.1.41. [DOI] [PMC free article] [PubMed] [Google Scholar]
- Maylie J, Irving M, Sizto NL, Chandler WK. Calcium signals recorded from cut frog twitch fibers containing antipyrylazo III. J Gen Physiol. 1987b;89:83–143. doi: 10.1085/jgp.89.1.83. [DOI] [PMC free article] [PubMed] [Google Scholar]
- Meissner G. Adenine nucleotide stimulation of Ca2+-induced Ca2+release in sarcoplasmic reticulum. J Biol Chem. 1984;259:2365–2374. [PubMed] [Google Scholar]
- Miledi R, Nakajima S, Parker I, Takahashi T. Effects of membrane polarization on sarcoplasmic calcium release in skeletal muscle. Proc R Soc Ser B. 1981;213:1–13. doi: 10.1098/rspb.1981.0049. [DOI] [PubMed] [Google Scholar]
- Neher, E. 1986. Concentration profiles of intracellular calcium in the presence of a diffusible chelator. In Calcium Electrogenesis and Neuronal Functioning. U. Heinemann, M. Klee, E. Neher, and W. Singer, editors. Springer-Verlag, Heidelberg, Germany. 80–96.
- Pape PC, Jong D-S, Chandler WK. Calcium release and its voltage dependence in frog cut muscle fibers equilibrated with 20 mM EGTA. J Gen Physiol. 1995;106:259–336. doi: 10.1085/jgp.106.2.259. [DOI] [PMC free article] [PubMed] [Google Scholar]
- Pape PC, Jong D-S, Chandler WK. A slow component of intramembranous charge movement during sarcoplasmic reticulum calcium release in frog cut muscle fibers. J Gen Physiol. 1996;107:79–101. doi: 10.1085/jgp.107.1.79. [DOI] [PMC free article] [PubMed] [Google Scholar]
- Pape PC, Jong D-S, Chandler WK, Baylor SM. Effect of fura-2 on action-potential stimulated calcium release in cut twitch fibers from frog muscle. J Gen Physiol. 1993;102:295–332. doi: 10.1085/jgp.102.2.295. [DOI] [PMC free article] [PubMed] [Google Scholar]
- Prieto H, Donoso P, Rodriguez P, Hidalgo C. Intraluminal calcium affects markedly calcium release rates in triads from rabbit but not from frog. Biophys J. 1994;66:A339. [Google Scholar]
- Ríos E, Pizarro G. Voltage sensors and calcium channels of excitation–contraction coupling. News Physiol Sci. 1988;3:223–227. [Google Scholar]
- Ríos E, Pizarro G. Voltage sensor of excitation–contraction coupling in skeletal muscle. Am J Physiol. 1991;71:849–908. doi: 10.1152/physrev.1991.71.3.849. [DOI] [PubMed] [Google Scholar]
- Schneider MF. Control of calcium release in functioning skeletal muscle fibers. Annu Rev Physiol. 1994;56:463–484. doi: 10.1146/annurev.ph.56.030194.002335. [DOI] [PubMed] [Google Scholar]
- Schneider MF, Chandler WK. Voltage-dependent charge movement in skeletal muscle: a possible step in excitation–contraction coupling. Nature. 1973;242:244–246. doi: 10.1038/242244a0. [DOI] [PubMed] [Google Scholar]
- Schneider MF, Simon BJ. Inactivation of calcium release from the sarcoplasmic reticulum in frog skeletal muscle. J Physiol (Camb) 1988;405:727–745. doi: 10.1113/jphysiol.1988.sp017358. [DOI] [PMC free article] [PubMed] [Google Scholar]
- Shirokova N, Garcia J, Pizarro G, Ríos E. Ca2+release from sarcoplasmic reticulum compared in amphibian and mammalian skeletal muscle. J Gen Physiol. 1996;107:1–18. doi: 10.1085/jgp.107.1.1. [DOI] [PMC free article] [PubMed] [Google Scholar]
- Shirokova N, Ríos E. Small event Ca2+ release: a probable precursor of Ca2+sparks in frog skeletal muscle. J Physiol (Camb) 1997;502:3–11. doi: 10.1111/j.1469-7793.1997.003bl.x. [DOI] [PMC free article] [PubMed] [Google Scholar]
- Simon BJ, Klein MG, Schneider MF. Calcium dependence of inactivation of calcium release from the sarcoplasmic reticulum in skeletal muscle fibers. J Gen Physiol. 1991;97:437–471. doi: 10.1085/jgp.97.3.437. [DOI] [PMC free article] [PubMed] [Google Scholar]
- Simon BJ, Schneider MF, Szucs G. Inactivation of sarcoplasmic reticulum calcium release in frog skeletal muscle is mediated by calcium. J Gen Physiol. 1985;86:36a. [Google Scholar]
- Smith JS, Coronado R, Meissner G. Single channel measurements of the calcium release channel from skeletal muscle sarcoplasmic reticulum: activation of Ca2+, ATP, and modulation by Mg2+ . J Gen Physiol. 1986;88:573–588. doi: 10.1085/jgp.88.5.573. [DOI] [PMC free article] [PubMed] [Google Scholar]
- Stern MD. Buffering of calcium in the vicinity of a channel pore. Cell Calc. 1992;13:183–192. doi: 10.1016/0143-4160(92)90046-u. [DOI] [PubMed] [Google Scholar]
- Stern MD, Pizarro G, Ríos E. Local control model of excitation-contraction coupling in skeletal muscle. J Gen Physiol. 1997;110:415–440. doi: 10.1085/jgp.110.4.415. [DOI] [PMC free article] [PubMed] [Google Scholar]
- Tripathy A, Meissner G. Sarcoplasmic reticulum lumenal Ca2+ has access to cytosolic activation and inactivation sites of skeletal muscle Ca2+release channel. Biophys J. 1996;70:2600–2615. doi: 10.1016/S0006-3495(96)79831-4. [DOI] [PMC free article] [PubMed] [Google Scholar]