

Abstract
Ionic (Ii) and gating currents (Ig) from noninactivating Shaker H4 K+ channels were recorded with the cut-open oocyte voltage clamp and macropatch techniques. Steady state and kinetic properties were studied in the temperature range 2–22°C. The time course of Ii elicited by large depolarizations consists of an initial delay followed by an exponential rise with two kinetic components. The main Ii component is highly temperature dependent (Q10 > 4) and mildly voltage dependent, having a valence times the fraction of electric field (z) of 0.2–0.3 eo. The Ig On response obtained between −60 and 20 mV consists of a rising phase followed by a decay with fast and slow kinetic components. The main Ig component of decay is highly temperature dependent (Q10 > 4) and has a z between 1.6 and 2.8 eo in the voltage range from −60 to −10 mV, and ∼0.45 eo at more depolarized potentials. After a pulse to 0 mV, a variable recovery period at −50 mV reactivates the gating charge with a high temperature dependence (Q10 > 4). In contrast, the reactivation occurring between −90 and −50 mV has a Q10 = 1.2. Fluctuation analysis of ionic currents reveals that the open probability decreases 20% between 18 and 8°C and the unitary conductance has a low temperature dependence with a Q10 of 1.44. Plots of conductance and gating charge displacement are displaced to the left along the voltage axis when the temperature is decreased. The temperature data suggests that activation consists of a series of early steps with low enthalpic and negative entropic changes, followed by at least one step with high enthalpic and positive entropic changes, leading to final transition to the open state, which has a negative entropic change.
Keywords: Shaker K+ channel, gating and ionic current kinetics, charge movement, voltage-activation process, enthalpic and entropic changes
introduction
Voltage-dependent ionic channels play a crucial role in the generation and propagation of the action potential (Hodgkin and Huxley, 1952). Significant progress in our understanding of the operation of these channels has been made possible by the manipulation of the gene encoding the channel and its subsequent study in an expression system. One classical example of a voltage-gated channel is the Shaker K+ channel, which has been studied in extensive detail, and for which a number of kinetic models have been proposed to explain its voltage sensing properties (Perozo et al., 1992; Bezanilla et al., 1994; Zagotta et al., 1994), though none have been successful in determining its temperature dependence.
Temperature is known to have important effects on the kinetics of activation of the channels (Hodgkin and Huxley, 1952; Keynes and Rojas, 1974; Kimura and Meves, 1977, 1979; Meves and Vogel, 1977; Bezanilla and Taylor, 1978a , 1978b ; Jonas, 1989; Correa et al., 1992; Bendorf and Koopmann, 1993; Rodríguez and Bezanilla, 1996). Temperature affects reaction rates depending on the activation energy involved in a particular reaction that contains an energetic component, or more precisely the enthalpic component, and an order-disorder or entropic component. As their name implies, these two components have very different interpretations with regard to the operation of the protein as it progresses through the activation steps that finally gate the channel open. By just measuring the rates in the activation, one gets the total free energy involved and it is not possible to separate the two components, while by using different temperatures, the order/disorder component can be dissociated from the energetic component. The aim of this work was to characterize the effects of temperature on activation kinetics, in an attempt to resolve the enthalpic and entropic contributions of the more readily visible components of the gating and ionic currents, and thus obtain more insight on the type of conformational changes the channel undergoes during activation. To gain further insight on the details of the process, we then fit a kinetic model of Shaker activation to the temperature data set in the temperature range 10–20°C.
The main conclusion of this study is: steps far from the open state have low temperature dependence while steps near the transition to the open state have higher temperature dependence, not including the last closed to open step, which has a low temperature dependence (Rodríguez and Bezanilla, 1996).
materials and methods
RNA Synthesis and Oocyte Injection
cDNA encoding Shaker H4 K+ channel and Shaker H4 K+ channel with the W434F mutation, which have just a few silent amino acid differences with the ShakerB clone (Hoshi et al., 1990; Murrel- Lagnado and Aldrich, 1993) in an optimized vector (Starace et al., 1997) were used. All the experiments shown here were done in clones with the fast inactivation removed, shH4ir (Hoshi et al., 1990; Stefani et al., 1994). cRNA was injected and expressed in Xenopus laevis oocytes and tested for expression with the cut-open oocyte voltage clamp technique (Stefani et al., 1994), 2–4 d after injection.
cRNA was prepared using the same procedure described in Rodríguez and Bezanilla (1996). 50 nl cRNA solution (∼2–3 μg/ μl) was microinjected per oocyte. Xenopus laevis oocytes (stage V–VI) collagenase defolliculated were used.
To perform cell-attached macropatches, the vitelline membrane of the oocyte was removed using forceps after incubation in a hyper-osmotic solution (200 mM NaCl, 2 mM KCl, 1 mM MgCl2, 5 mM HEPES, pH 7.5 with 1 M NaOH).
Solutions
Solutions were made by mixing stock isotonic solutions (245 mOsm) of the principal cation containing 10 mM HEPES at pH 7.2.
In most of the experiments, gating currents were obtained with the external solution (0 K+) containing: 120 mM Na-methanosulphonate (MES),1 1.8 mM CaCl2. The internal solution contained: 120 mM K-MES, 1 mM EGTA-N-methyl-glucamine (NMG). Some of the experiments were done in 0 K+/0 Na+ solutions, using stock isotonic solutions (235 mOsm) of NMG as the main cation. In these cases, the external solution contained: 110 mM NMG-MES, 1.8 mM CaCl2. The internal solution contained: 110 mM NMG-MES, 2 mM NMG-EGTA.
Ionic current was obtained mostly with the external solution (60 K+), containing (mM): 60 Na-methanosulphonate, 60 K-methanosulphonate, 1.8 CaCl2. In some cases, external solutions were used with 0, 10, or 120 mM K+ as required. The internal solution contained 120 mM K-methanosulphonate, 1 mM EGTA-N-methyl glutamine.
Cut-Open Oocyte Voltage Clamp Technique
Before recording, the oocyte was permeabilized with 0.3% saponine in 0 K+ external solution. For details of the cut-open oocyte voltage clamp technique (COVC), see Stefani et al. (1994). The intracellular microelectrode was filled with 3 M KCl. Capacitive cancellation and series resistance compensation (Rs) were used. Series resistance compensation was important for the low temperature experiments because we found that between 22 and 4°C the Rs can increase 1.7×. In the experiments shown here, typical values for Rs were <0.4 kΩ. The capacitive transient was measured to check the voltage clamp speed. Typically, the capacitive transient decayed in <50 μs (between 17 and 22°C) and <80 μs at low temperatures. In some cases, linear leak and capacitive currents were subtracted using the P/−4 or P/4 subtraction protocols (Armstrong and Bezanilla, 1977) with a subtracting holding potential of −100 mV for ionic currents or −120 mV for gating currents. Unsubtracted gating currents records were obtained also in some experiments, by adjusting the capacity cancellation with a holding potential of 0 mV, and returning to the usual holding potential of −90 mV during the recording. Linear leak compensation was used also, as required.
Macropatch Technique
Cell-attached patch configuration with pipettes with external diameters of 5 μm (tip resistance <1.6 MΩ) and Sylgard coated were used. Typical seal resistances were 1–20 GΩ. Experiments with stretch channel contamination were discarded.
Ionic current fluctuations are mostly due to the opening and closing of ion channels (Silberberg and Magleby, 1993). The principal assumption in noise analysis experiments of a particular channel is that the fluctuations in membrane current are recorded from a homogeneous population of channels (in this case, the ShH4ir) under conditions where the background noise due to intrinsic currents is minimal and there is a single conduction state. Ionic current noise of ShH4ir was analyzed with the mean and variance of the currents from >100 traces per voltage, obtained at different voltages (between −50 and 80 mV) to estimate the number of channels, unitary conductance, and open probability. At each temperature tested (usually 18, 7–8, and 4°C) at least two different voltages were analyzed. Error due to long-term drift was minimized by performing pairwise analysis in calculating the variance.
Assuming n independent channels with a single conducting level, values of the total number of channels (n), the open probability (P o) and the single-channel current (i) can be estimated by fitting the variance (σ2(t), current fluctuation) vs. the mean current (I(t)) curve (Sigworth, 1980; Silberberg and Magleby, 1993; and one example is shown in the inset of Fig. 6) with:
 |
Figure 6.
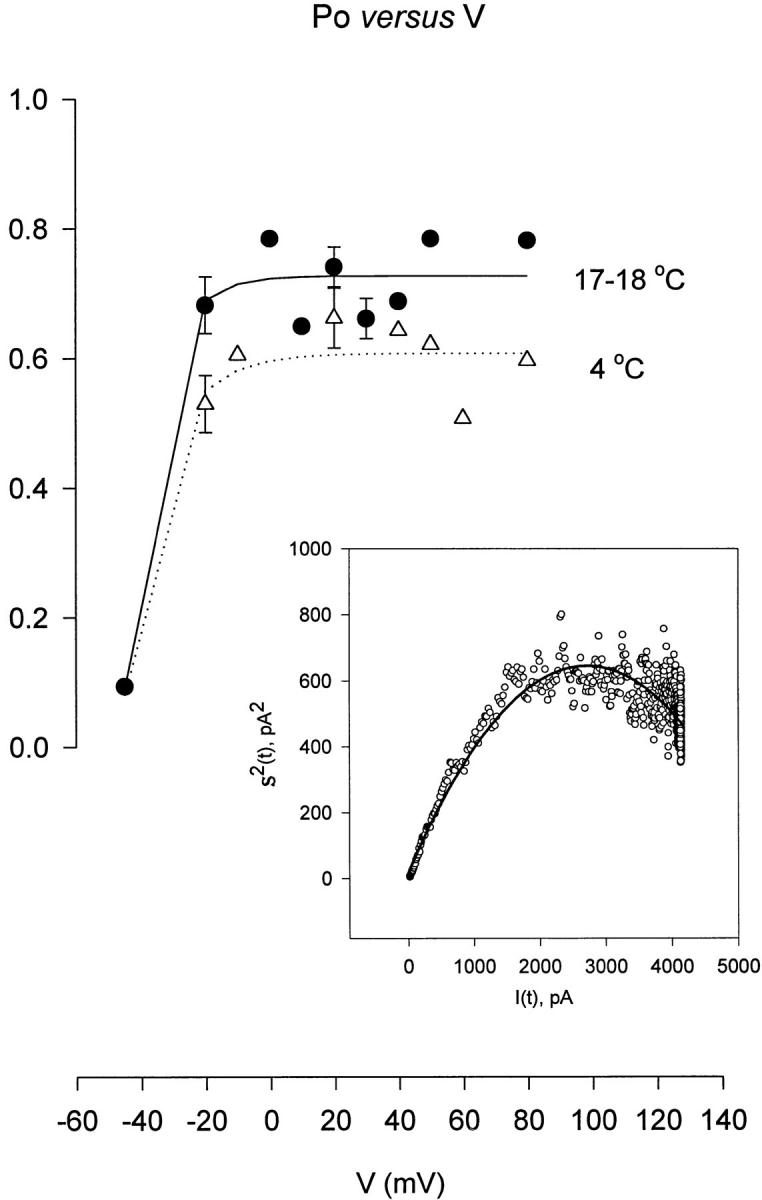
Probability of being open (P o) as a function of voltage (V). The P o values were calculated from ionic fluctuation studies at different temperatures and voltages with the macropatch technique. Inset shows an example of a plot of the variance σ2(t) versus mean current, I(t) used to determine P o, the unitary conductance (γ), and the number of channels (n). ○, data obtained from 257 ionic current traces obtained at 17°C and using a test pulse of −20 mV. A 120-mM K+ internal solution and 10-mM K+ external solution were used. Solid line shows the fit with Eq. (1). Parameters fitted: i, unitary current = 0.46 pA; n = 11,800; γ = 13.8 pS; P o = 0.7551. At 17–18°C, P omax was 0.71 ± 0.02 (n = 17), at 8°C was 0.63 ± 0.03* (n = 11) and at 4°C was 0.60 ± 0.02‡ (n = 10). Data obtained at temperatures below 8°C were significantly different from data obtained at 17–18°C (*P < 0.002 and ‡ P < 0.0008).
where
 |
and the P o was calculated from the value of the mean current at steady state (Iss):
 |
The unitary conductance (γ) was calculated from:
 |
where VK is the reversal potential and V is the test pulse.
To estimate the elementary gating charge q, fluctuation analysis was performed on gating current ensembles using >100 traces per experiment. This was repeated for several voltages in the saturated portion of the charge versus voltage curve (Q-V curve). We used the same procedure reported by Sigg et al. (1994). Mean-variance plots of the decay of On and Off responses were fitted to:
 |
where B is the effective bandwidth (equal to 1.064 fc, where fc is the corner frequency of a gaussian filter), Ig is the mean gating current, q is the elementary gating charge movement, and c is a constant.
Even as it is known that this simple experiment does not reflect the nuances of the entire activation process, it is a useful tool in estimating the largest carrying charge transition. The value of the elementary charge movement is consistent with the value obtained from simulated data from a multistate model (Sigg et al., 1994).
Data Acquisition
IBM-clone personal computers with hardware and software previously described (Stimers et al., 1985) were used for data acquisition. Analogue signals were filtered at 1/4 or 1/5 of sampling frequency using an eight-pole Bessel filter. The temperature was controlled by a peltier device with negative feedback using a thermistor as a temperature sensor.
Fitting and Simulation
The gating current traces were fit with a sum of three exponential functions. Q-V curves were fit using a two-step sequential Boltzmann equation (see Eq. 6). Fits were done with the NFIT (The University of Texas Medical Branch at Galveston, Texas) program using the chi-squared criterion for the goodness of fit.
A multistate sequential kinetic model (see Fig. 16 and Table III) describing the activation pathway was evaluated using ScoP (Simulation Resources, Barrien Springs, MI) and the fit of the parameters was done directly with the experimental records using ScoPfit. To apply enough constraints to the model, a set of 10 unsubtracted gating current traces elicited as a response of a variable test pulse between −120 and 0 mV from the holding potential (at −90 mV) obtained at two different temperatures (21 and 11°C), were used to fit the parameters of the kinetic model.
Figure 16.
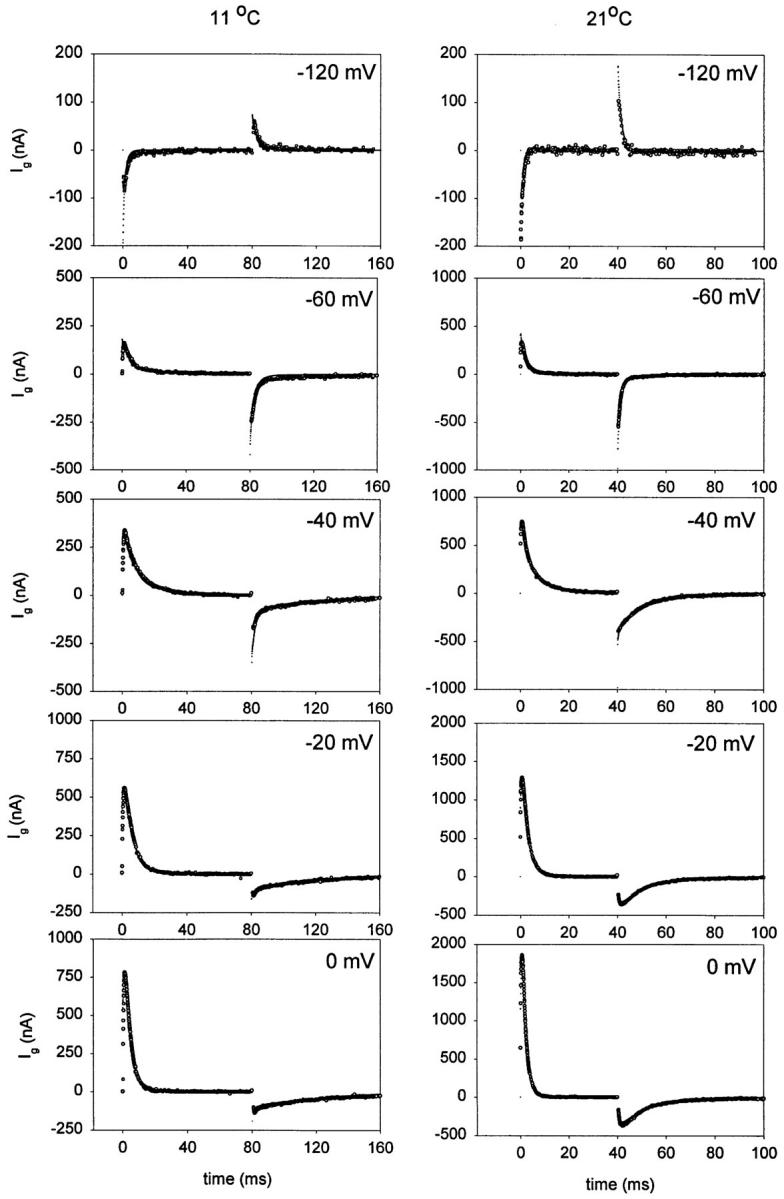
Data and model prediction. Family of gating current traces (○) obtained at two different temperatures (21 and 11°C) fitted with an 11-state sequential model (dots) with parameters shown in Table III. Unsubtracted gating currents elicited in response to variable test pulses from −120 to 0 mV. Holding potential was −90 mV. The test pulses were 40- and 80-ms long at 21 and 11°C, respectively. Data obtained at 21°C was filtered at 5 kHz and digitized every 50 μs. Data obtained at 11°C was filtered at 2.5 kHz and digitized every 80 μs.
Table III.
The Kinetic Model and the Values of the Fitted Parameters

|
||||||||||||||||
|---|---|---|---|---|---|---|---|---|---|---|---|---|---|---|---|---|
| i | αio | βio | zf | zb | ΔHf | ΔHb | ΔHss | TΔSss | ||||||||
| 1/ms | 1/ms | e0 | e0 | kcal/mol | kcal/mol | kcal/mol | kcal/mol | |||||||||
| 0 | 4.8 × 10¹¹ | 6.9 × 10¹¹ | 0.21 | 0.39 | 14.2 | 15.3 | −1.1 | −0.2 | ||||||||
| 1 | 1.4 × 10⁴ | 9.0 × 10¹⁶ | 0.45 | 2.02 | 4.1 | 22.7 | −18.6 | −17.2 | ||||||||
| 2 | 5.7 × 10¹⁶ | 7.5 × 10⁻²⁰ | 0.05 | 0.4 | 21.6 | −24.9 | 46.5 | 48.1 | ||||||||
| 3 | 1.06 | 2.6 × 10¹⁶ | 0 | 0.5 | 0 | 23.6 | −23.6 | −22.0 | ||||||||
| 4 | 0.6 | 3.8 | 0 | 0.1 | 0 | 0 | 0 | −1.1 | ||||||||
results
Effects of Temperature on Ionic Currents
Raising the temperature speeds the kinetics of ionic currents dramatically, as shown in Fig. 1. It is not possible to account for all the changes by assuming a common temperature coefficient for all the exponential components of the current, and it was found that the temperature dependence of a single component could change with voltage. This is not surprising, as the individual transitions are expected to have different entropic and enthalpic components, the eigenvalues of the system will vary their temperature sensitivity according to the predominance of the rate constants that make them up. This poses a challenge to the study of how temperature is really affecting the elementary rate constants that compose the operation of the channel. The approach we have followed is to extract the most obvious eigenvalues from the ionic currents under different initial conditions or pulse protocols and describe their temperature dependence. By performing these experiments at limiting values of voltage, we tried to infer the behavior of some of the more important elementary transitions of the multistep process. Notice that by using this procedure we may not get the real eigenvalues of the system because frequently there are a multitude of eigenvalues of similar values that are not experimentally separable and for this reason we will refer to them as observed eigenvalues.
Figure 1.

Macroscopic ionic currents from ShH4ir at 15.1°C and 8.5°C. Currents were elicited in response to test pulses from −80 to +80 mV in 10-mV increments from and returning to a holding potential of −90 mV. The test-pulse duration was 40 ms at 15.1°C and 180 ms at 8.5°C. Data obtained at 15.1°C was filtered at 5 kHz and digitized every 50 μs. Data obtained at 8.5°C was filtered at 1 kHz and digitized every 180 μs. Internal solution 120 K+-MES and external solution 60 K+-MES. A P/−4 subtraction protocol was used.
The Kinetic Components at Depolarized Potentials
In a previous study (Rodríguez and Bezanilla, 1996), a double pulse protocol was used in an attempt at extracting the temperature dependence of the transition leading to the open state. An extension of this study is the description of the temperature dependence of the main observed eigenvalues of the On ionic currents.
Fig. 2 displays the extracted rate constants from such an experiment. Ionic currents exhibit a lag before they rise in a quasi-exponential time course to their final value. By fitting a sum of two exponential functions to the late part of the current trace, after the initial lag, we obtain an empirical description of two main observed eigenvalues in the process: one fast component with a time constant between 1.31 and 0.68 ms, and a slow component, with a time constant between 6.43 and 3.12 ms, at 17–22°C, 20 and 80 mV, respectively. This fitting process is especially successful at large depolarization when the approach to the steady state current may be very well described with only two exponential functions, and for this reason we restricted our analysis to depolarizations to ∼+50 mV. Fig. 2 A shows that the proportion of the two exponential components definitely favors a predominant fast component for both 19 and 5°C and both components are affected by temperature as shown in Fig. 2 C. We studied the fast component in more detail because, as it is larger (∼70–80% of all kinetic components), it can be characterized more accurately. The second component corresponds to <30% of all kinetic components and may reflect some of the transitions near the open state (Bezanilla et al., 1994; Rodríguez and Bezanilla, 1996). The voltage dependence of the fast component at different temperatures is shown in the range of 20–80 mV. It demonstrates a mild voltage dependence that can be described by a valence times the fraction of the field (z) of 0.25 ± 0.02 eo (n = 4, mean ± SEM, between 19.2 and 5.1°C). At temperatures below 2°C, the slope of the plot is not statistically different from zero (z = 0 eo). Rodríguez and Bezanilla (1996) demonstrated with the double pulse protocol that the forward rate of the last transition close to open step is voltage independent (no charge movement is involved during the last step of the activation process). Neither is it temperature dependent. With test pulses >20 mV and at very low temperatures, we were able to isolate this transition from the other transitions near the open state.
Figure 2.

Kinetics of ionic current activation in response to depolarized potentials (>20 mV). Ionic currents were fit to a sum of two exponential functions: I(t) = a + bexp(−t/τ1) + c exp(−t/τ2), where I(t) is the macroscopic ionic current as a function of time, t. The ionic current trace was fitted after the initial delay. (A) Proportion of kinetic components of ionic currents obtained at depolarized potentials as a function of voltage at two different temperatures 19.2°C (•, ▪) and 5.1°C (○, □). (B) Reciprocal of the time constant of the fast kinetic component (1/τfast) as a function of voltage (V). Estimation of the valence times the fraction of electric field (z) from the slope = zF/RT. The value of z obtained at each temperature tested (between 19.2 and 5.1°C) is between 0.2 and 0.28 eo. (C) Proportion of kinetic components of ionic currents obtained at depolarized potentials as a function of temperature from ionic currents obtained at two different test pulses: 40 mV (○, □) and 80 mV (•, ▪). (D) Arrhenius plot for the fast kinetic component from ionic currents elicited by a test pulse to 50 mV. The energy of activation (Ea) obtained from the slope = −Ea/R. Results shown in A–D as the mean ± SEM from several experiments.
The fast component has a strong temperature dependence, and an Arrhenius plot using the time constant obtained at 50 mV gives a straight line with a Q10 of ∼4 (Fig. 2 D), corresponding to an Ea of 23–25 kcal/mol. This main observed eigenvalue is clearly different from the observed eigenvalue obtained with the double pulse experiment, which is much larger and independent of voltage and temperature. This indicates that the time course of the ionic current is rate limited by one or several steps that precede the opening transition.
The Temperature Dependence of Early Transitions
The initial lag of the ionic current reflects the early transitions of the activation pathway, which can be studied with the Cole-Moore pulse protocol (Cole and Moore, 1960). A large negative conditioning pulse will populate most of the channels in closed states further removed from the open state, which is reflected in a longer lag in the activation of the ionic current.
Fig. 3 A shows superimposed ionic currents for a pulse to 40 mV for different conditioning pre-pulses ranging from −150 to −50 mV with the longest lag observed for the −150 mV conditioning pulse. The current lag was measured by shifting one trace with respect to the other until their time courses coincide. This procedure is shown in Fig. 3 B for two sets of conditioning pulses. If the prepulse is varied between −150 and −90 mV (Fig. 3 B, top left), the superposition is very good after a shift of 0.2 ms (Fig. 3 B, bottom left). However, a shift of 0.47 ms for currents obtained for prepulses of −150 and −50 mV failed to superimpose the traces at long times. A different amount of shift can superimpose the traces at long times but not at short times, showing that the time courses of the current traces differ. This result is expected if the conditioning pulse approaches a voltage in which the probability of reaching the open state is relatively high, which is the case for the −50 mV prepulse.
Figure 3.

Kinetics of early transitions of the activation pathway using the Cole-Moore protocol. (A) Family of macroscopic ionic currents from ShH4ir obtained at 15.1°C elicited in response to variable hyperpolarized prepulses (between −150 and −50 mV), followed by a 40-mV test pulse and a postpulse of −120 mV (Cole-Moore protocol). The holding potential was −90 mV. A P/−4 subtraction protocol was used. Data was filtered at 5 kHz and digitized every 60 μs. Internal solution: 120 K+-MES, and external solution, 60 K+-MES. (B) Superposition of the ionic current traces obtained with the Cole-Moore protocol at 18.7°C. Holding potential was −90 mV. P/−4 subtraction protocol was used. Data was filtered at 5 kHz and digitized every 50 μs. Internal solution 120 K+-MES and external solution 60 K+-MES. Shown are the ionic current superposition after shifting in time (shift-t), using as a reference the current obtained with a −150 mV prepulse. Notice the excellent superposition between the traces obtained with prepulses of −90 and −150 mV, and the poor superposition of the −50 and −150 mV pre-pulses.
The plot of the shift as a function of the conditioning pulse is shown Fig. 4 A for three different temperatures. Notice that the shift increases significantly as the prepulse is made more positive and that the temperature has little effect for very negative conditioning pulses. This indicates that the rate constants of transitions far removed from the open state have a smaller temperature coefficient than the rate constants that are closer to the open state. An Arrhenius plot of the reciprocal value of the shift for five different conditioning voltages is shown in Fig. 4 B and the inset shows that the Q10 values obtained become larger as the conditioning pulse is made more positive. When the Q10 was computed for conditioning pulses in which the time course of the currents coincided after shifting, the value was 1.69 ± 0.09 (n = 11) between 8 and 19°C. In contrast, from 13 experiments, the Cole-Moore shift obtained from current traces that did not superimpose completely gave a Q10 that varied from 2 to 5. These results are consistent with the idea that the energy barriers of the transitions between closed states that are far removed from the open state have small enthalpic changes, and that when the Q10 of the shift increases, it is because temperature-dependent transitions closer to the open state are being sampled.
Figure 4.

Temperature dependence of the Cole-Moore shift (shift-t). (A) Delay or time shift (shift-t, in milliseconds) due to the hyperpolarized prepulses at different temperatures. Lines show fit to a single exponential function of the voltage dependence of the Cole-Moore shift at each temperature tested. (B) Arrhenius plot of the Cole-Moore shift. 1/shift-t as a function of temperature at different voltages of prepulses.
Temperature Effects on the Steady State Properties of the Open Probability
The effects of temperature on the functional relationship between the relative open probability and voltage (P or-V) in the steady state gives information about the thermodynamics of channel activation. In the simple case of a two- state channel, the assignment of the equilibrium constant is unique when either the Q-V or P or-V is measured. This is not the case for the activation of the Shaker K+ channel because there are multiple transitions and the P or-V curve will contain a combination of equilibrium constants. For such channels, modeling is required to assign the thermodynamic parameters to each of the equilibrium constants. A further complication is that, due to fast blocking of the channel in the open state, the experimentally derived P or-V curve is dependent on the method used to compute it. Although we tried several procedures to estimate P or-V, we will only present one here (called Delta-V protocol) that was found to maintain the shape of the G-V curve at different temperatures.
The method estimates the voltage dependence of the conductance as shown in Fig. 5. After the pulse to the potential V, the membrane is only partially repolarized to a new potential V1 that differs from V by a magnitude ΔV. The difference of the current at the end of the pulse and the beginning of the V1 pulse is used to compute the conductance for the ΔV as a function of voltage (see Fig. 5). The conductance thus calculated includes the open probability, the number of channels, and the single channel conductance. The low temperature G-V distribution shows a shift to the left in the voltage axis with respect to the G-V curve at high temperature, which is consistent with the result obtained with the double pulse that revealed temperature dependence only in the backward rate of the transition to the open state (Rodríguez and Bezanilla, 1996).
Figure 5.

Conductance (G) versus voltage (V) curve. (A) G-V curves obtained at two different temperatures, 19.2 (•) and 10.05 (○) °C. (B) Normalized delta family G-V curves for the same data shown in A. Notice the shift to the left when the temperature decreases, (∼−5 mV), corresponding to an entropic change (TΔS at 20°C) of ∼−7 kcal/mol. (C) Macroscopic ionic currents elicited with the Delta-V protocol at 19.2°C. Data obtained was filtered at 7.5 kHz and digitized every 30 μs. Test pulses (V) from −80 to 30 mV in 10-mV increments, keeping constant the difference with respect to the postpulse potential (V2) (V − V2 = 20 mV). Holding potential = −90 mV. VK, reversal potential; IR, current measured at the end of the test pulse; Itails, current measured at the onset of the postpulse; G, macroscopic conductance = nγ(V) P o, where n is the number of channels, γ(V) is the unitary conductance, and P o is open probability. Internal solution 120 K+-MES and external solution 20 K+-MES. The P/−4 subtraction protocol was used.
Temperature Dependence of Channel Number, Open Probability, and Unitary Conductance
The conductance measurements just presented cannot determine whether temperature is changing the open probability, the number of active channels, or the unitary conductance. We approached this question using nonstationary noise analysis to estimate the number of channels and the open probability (Sigworth, 1980). The results are presented in Fig. 6. The inset shows a typical plot of mean and variance that was used to estimate the single channel current, the number of channels, and the open probability. Experiments were done with macropatches in the range of 18–4°C and, although the plot shows considerable scatter, grouping the measurements at all positive potentials shows a significant difference in the open probability with temperature. The P o decreases by 20% between 18 and 4°C (P = 0.0008, t test). At temperatures below 8°C, there is no detectable further decrease in the open probability.
A valid question is whether the number of active channels n remain constant when lowering the temperature. To improve the accuracy of the estimation of n, measurements were done at several voltages at the same temperature and the mean number of channels estimated from these was compared with the equivalent estimate at another temperature. In four reversible experiments (i.e., the ionic current was unchanged before and after experimental runs at different temperatures), the differences in the mean values of n among the different temperature groups were not statistically significant (P = 0.48, Kruskal-Wallis one way analysis of variance on ranks test). This result, however, should be taken with caution due to the variability of the measurements.
The noise analysis experiments also allowed the estimation of the single channel conductance, γ at different temperatures. The estimation was done for potentials ranging from 0 to 80 mV, voltage range where the unitary conductance seems to be voltage independent. From several macropatches at 17–18°C, the mean value of γ was 10 pS, at 8°C the mean value was 7.4 pS, and at 4°C the mean value decreased to 5.6. The results are summarized in Table I and the calculated Q10 for conduction is 1.44, as expected from a process with a low energy barrier and in agreement with previous estimates of the conductance in other channels using single channel measurements (i.e., Correa et al., 1992).
Table I.
Temperature Dependence of Unitary Conductance (γ)
| γ (pS) | 17–18°C | 8°C | 4°C | |||
|---|---|---|---|---|---|---|
| n | 12 | 8 | 7 | |||
| Mean | 10.0 | 7.4 | 5.6 (* P <0.001) | |||
| (* P = 0.0032) | (‡ P = 0.039) | |||||
| SEM | 0.53 | 0.48 | 0.66 |
Significance with respect to the value obtained at 17–18°C.
Significance with respect to the value obtained at 8°C (Student's t test).
Effect of Temperature on Gating Currents
Gating currents show the movement of charge between states; therefore, it gives kinetic information about transitions that may be far removed from the open state, which may be difficult to identify by measuring ionic currents. We have performed a systematic study of the effects of temperature on the kinetics of gating currents and steady state properties of the charge movement.
Temperature Effects on the Time Course of Charge Movement
Fig. 7 shows a family of gating currents recorded at 21 and 5°C. At low temperatures, the overall kinetics slow down. It is noticeable that the largest effect is on the Off response, particularly at high depolarizations, indicating that transitions near the open state are more temperature dependent than earlier transitions of the activation pathway, in agreement with the analysis of temperature effects on ionic currents.
Figure 7.

Temperature effects on the time course of gating currents. Unsubtracted family of gating currents from shH4ir-W434F obtained at 21 and 5°C elicited in responses to variable test pulses (V). Holding potential was −90 mV. The test pulses were 40- and 80-ms long at 21 and 5°C, respectively. Postpulses were 40- and 240-ms long at 21 and 5°C, respectively. Data obtained at 21°C was filtered at 2 kHz and digitized every 70 μs. Data obtained at 5°C was filtered at 2.5 kHz and digitized every 190 μs. Notice the large effect of temperature in the kinetics of the Off response of gating currents, particularly at depolarized potentials.
A simple way to measure the effects of temperature on the time course of the gating currents is to use expansion and superposition between two records at two different temperatures. For example, we selected the On response recorded at −50 mV obtained at two different temperatures (21.1 and 11°C, see Fig. 8). The currents were first vertically scaled to match the peak amplitudes (Fig. 8 A), and then the high temperature record time course was scaled until the two traces could be superimposed (Fig. 8, B and C). The On responses could not be completely superimposed, indicating the presence of more than one component with different temperature coefficients. Using two different expansion factors, it was possible to superimpose the early part of the records with a factor 1.98 and the late part with a factor of 2.8. Thus, at −50 mV, there is a fast component with a Q10 of ∼2 and a slower component with a larger Q10 of ∼2.8.
Figure 8.
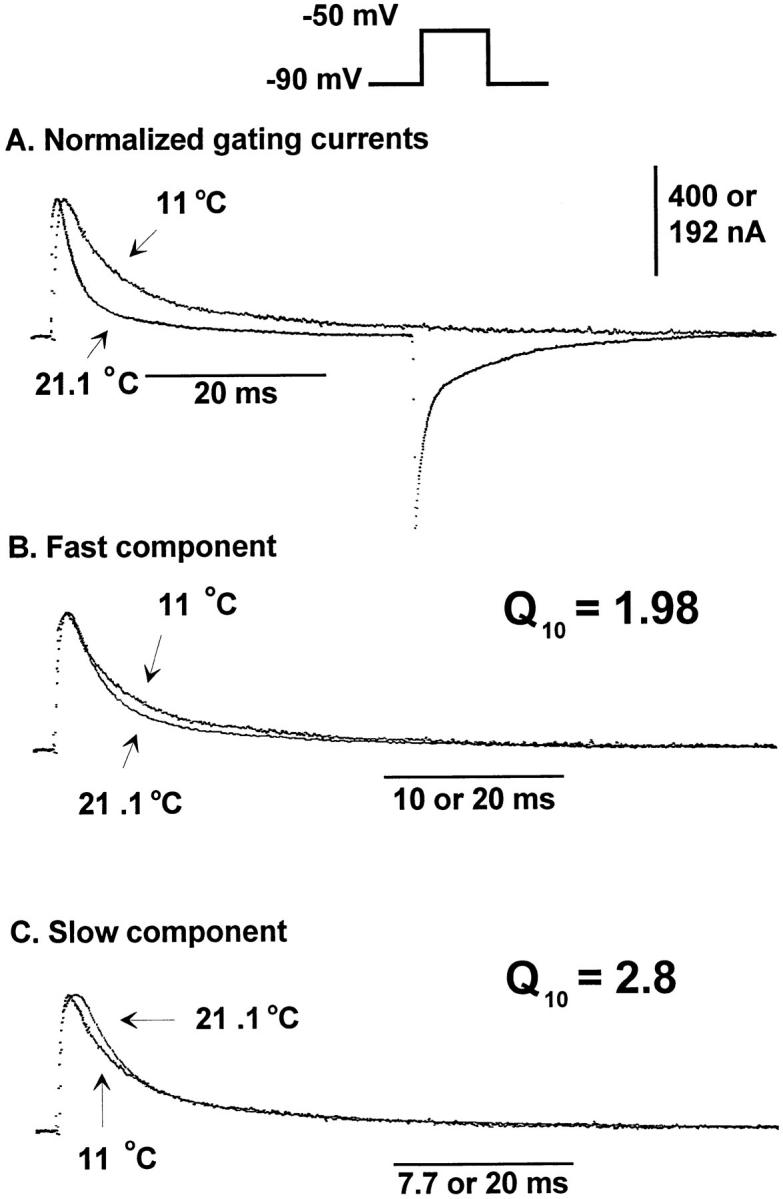
Kinetic behavior for the On response of gating currents obtained at −50 mV. Unsubtracted traces elicited in responses to a test pulse of −50 mV at 21.1 and 11°C. The holding potential was −90 mV. The test pulses were 40- and 80-ms long at 21.1 and 11°C, respectively. Postpulses were 160-ms long. Data obtained at 21.1°C was originally filtered at 5 kHz and digitized every 50 μs. The trace shown in the figure was digitally filtered at 2 kHz to compare with data obtained at 11°C. Data obtained at 11°C was filtered at 2 kHz and digitized every 80 μs. (A) Normalized gating currents. Traces obtained at 21.1 and 11°C normalized for the size of the peak of the On response of the gating current (multiplying by 2.08) and superimposed. (B) Fast component. Gating current trace obtained at 21.1°C multiplied by a time-expansion factor (2×) to superimpose with the first part of the gating current trace obtained at 11°C. (C) Slow component. Gating current trace obtained at 21.1°C multiplied by a time-expansion factor (2.6×) to superimpose with the second part of the gating current trace obtained at 11°C. 0 K+/0 Na+ internal and external solutions.
The Off response exhibits more complex behavior. Fig. 9 shows the Off response of the gating currents obtained at 20.9 and 10.7°C upon return to −90 mV from a pulse of 20 mV. The prominent rising phase observed at high temperatures is replaced by a faster component preceding the very slow decay of the current to baseline. It is quite clear that these traces are so different that time expansion of the low temperature record will not superimpose onto the high temperature record.
Figure 9.

Time course of the Off response of gating current obtained at depolarized potentials at different temperatures. Unsubtracted Off responses traces elicited after a test pulse of 20 mV returning to −90 mV (holding potential). Traces obtained at 20.9 and 10.7°C. Gating current trace obtained at 20.9°C was originally filtered at 5 kHz and digitized every 50 μs. Trace shown in the figure was digitally filtered to 2 kHz. Gating current trace obtained at 10.7°C was filtered at 2 kHz and digitized every 80 μs. Notice that at low temperature the rising phase is lost and a faster decaying component appears.
Temperature Dependence of the Kinetic Components of Gating Currents
The time course of the On and Off responses of the gating current may be described by a sum of three exponentials: a rising phase followed by a fast and a slow decaying component. A simple interpretation of this kinetics is that the rising phase and the first decaying component of the On response represent transitions distant from the open state, while the slow component corresponds to transitions near to the open state. We deduce this from the fact that the fast component is predominant at small depolarizations that favor closed states, and the slow component becomes more prominent at higher depolarizations that favor the open state. Guided by this simple interpretation, we selected two potentials to analyze the effect of temperature on the kinetic components of the charge movement: −60 mV where the open probability of the channel is quite low (backward rates are predominant) and −10 mV where the channel is open or near to the open state (forward rates are predominant).
At negative potentials (−60 mV, Fig. 10), a linear Arrhenius plot can describe the temperature dependence of the fast component and the rising phase in On and Off responses. The Q10 for the activation and deactivation process at this voltage is between 2.5 and 3.2. For the slow component, two lines were required to fit the Arrhenius plot.
Figure 10.

Arrhenius plots of the decaying kinetic components of the gating currents elicited as a response to a test pulse of −60 mV. The On and the Off responses of the experimental traces were fitted with a three- exponential function: a rising phase followed by two decaying components. (A) Arrhenius plots for the On response decaying kinetic components at −60 mV. (B) Arrhenius plot for the Off response decaying components. Energy of activation, E a, obtained from the slope of the Arrhenius plot (slope = −E a/R).
At potentials when the channel is open or near to the open state (−10 mV, Fig. 11), the temperature dependence becomes more complex. The Arrhenius plot for the fast decaying component of the On response is linear with a Q10 = 2.6, similar to the one obtained at −60 mV, but for the rising phase and slow component two lines were required to fit the Arrhenius plot. This result is consistent with the idea that transitions near the open state involve high energy barriers with large enthalpic changes. For the Off response (Fig. 11 B), the Arrhenius plot of the rising phase and decay is linear with a Q10 > 3.5.
Figure 11.
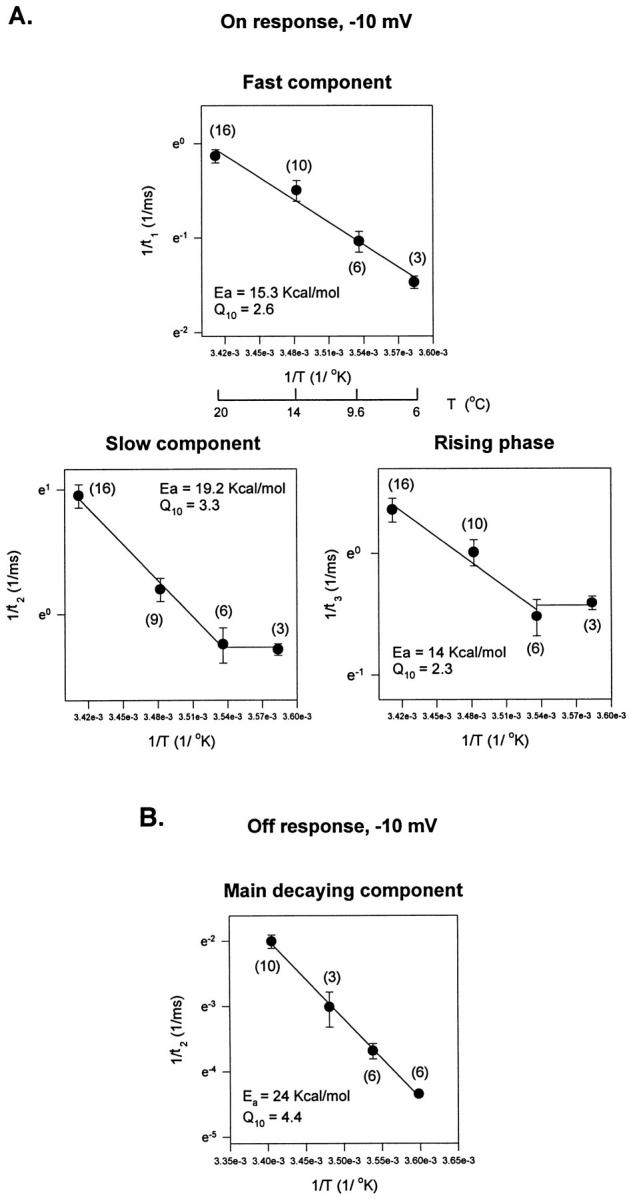
Arrhenius plots of kinetic components describing the gating currents elicited as a response to a test pulse of −10 mV. (A) Arrhenius plots for the On response kinetic components: fast component, slow component, and rising phase. (B) Arrhenius plot for the main decaying component of the Off response. The Arrhenius plot for the time constant of the faster decaying component that appears at low temperatures was not included (see Fig. 9).
Voltage Dependence of the Kinetic Components of Gating Currents
The plots of time constants measured from the two decaying components of the On response as a function of voltage are shown in Fig. 12. It is apparent that the fast decay (τ1, closed symbols) is less voltage dependent than the slow decay (τ2, open symbols), in agreement with the idea that the first closed transitions carry less charge than the transitions near the open state (Sigg et al., 1994). At potentials more positive than 20 mV, a single exponential decay fit provides an adequate fit of the current, making it difficult to determine whether the remaining kinetic component belongs to the functional relation of the fast or slow component as a function of voltage. For these potentials, the symbols (Fig. 12) have been filled gray.
Figure 12.
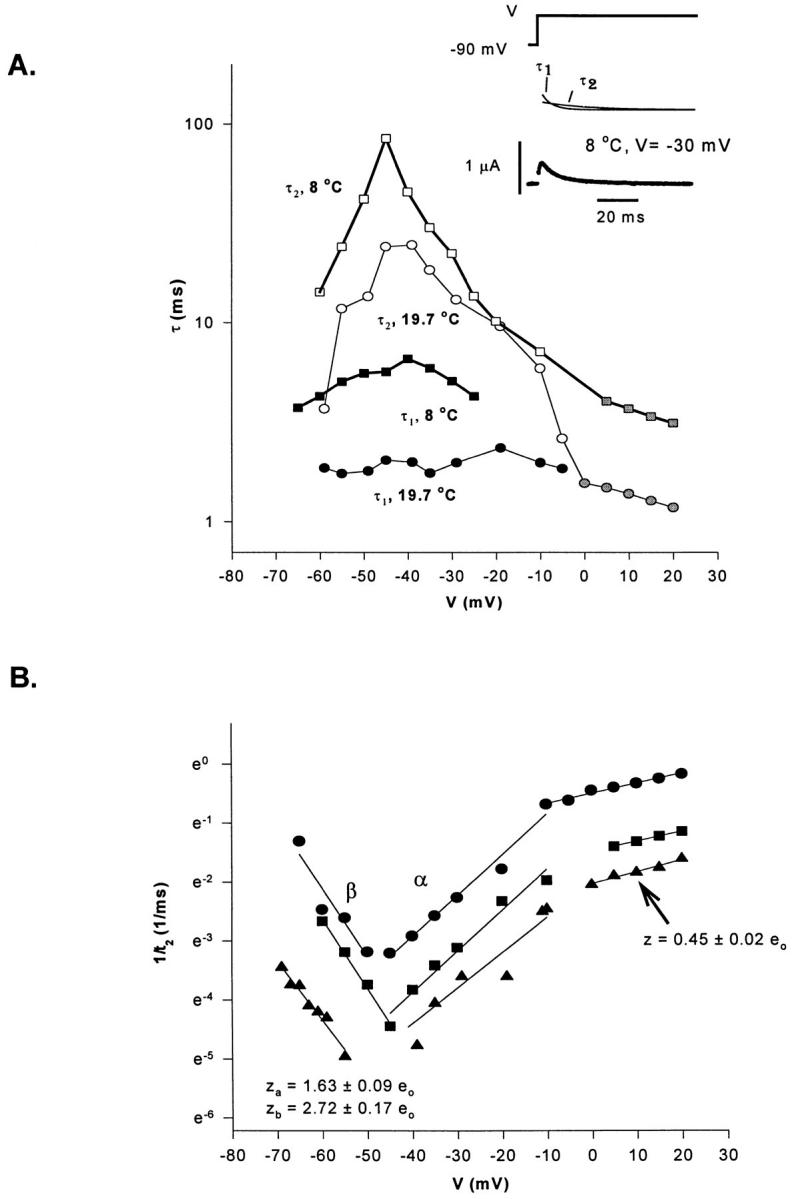
Time constants (τ) of the decaying components of the On response of gating currents as a function of voltage (V). (A) Voltage and temperature dependence for each kinetic component for three different experiments. Open symbols represent the slow decaying component: ○ at 19.7°C, □ at 8°C. Closed symbols represent the fast decaying component: • at 19.7°C, ▪ at 8°C. Gray symbols indicate the voltage region where the On response was fitted with one exponential function. (B) Time constant of the slow decaying component (1/τ2, 1/ms) as a function of voltage (V). Determination of the valence times the fraction of the electric field (z). Data obtained from the same experiment shown in A at three different temperatures: 19.2°C, •; 8°C, ▪; 4.5°C, ▴. Lines represent the linear regression used to estimate z from the slope of each curve (slope = z.F/ RT) at each voltage region. Notice the change in the slope for the data obtained at depolarized potentials (>−10 mV), corresponding to z = 0.45 ± 0.02 eo (n = 3). Between −65 and −45 mV, backward rates predominate, z = 2.72 ± 0.17 eo (n = 3). Between −45 and −10 mV, forward rates predominate: z = 1.63 ± 0.09 eo (n = 3).
To characterize the slow component of the gating current in more detail, the reciprocal value of the larger time constant was plotted as a function of voltage for three temperatures, as shown in Fig. 12 B. This plot allows the estimation of the voltage dependence of the slower observed eigenvalue by computing the slope of ln(1/τ2) versus voltage for all temperatures. The estimated lines are reasonably similar to each other for the three temperatures tested. It is possible to distinguish three regions in this plot. For potentials more negative than −50 mV, the observed eigenvalue increases with hyperpolarization with an apparent valence times fraction of the field z β = 2.7 eo. At potentials in the range of −50 and −10 mV, the apparent valence is z α = 1.6 eo and, at potentials more positive than −10 mV, the apparent valence is 0.45 eo. From four different experiments (8–10 plots at each voltage range), z β of the backward rate was −2.6 ± 0.2 eo (n = 8), and z α of the forward rate was 1.9 ± 0.2 eo (n = 10). These values are similar to the value of the elementary charge movement measured by gating fluctuation analysis (∼2.4 eo, see below and Sigg et al., 1994), suggesting that the slow decaying component could be dominated by a single transition whose backward and forward rates are measurable with the method just described.
Reactivation Experiments: The Rates of the Early and Late Transitions
A three-exponential function fit of the gating current is unlikely to isolate the kinetic components contributed by early transitions of the activation pathway. This is because these transitions carry a small charge, and it is expected that the rising phase and first decaying components are contaminated by charge movement from late transitions. In fact, the temperature coefficients (Q10) of the fast component measured at small depolarizations is much larger than the Q10 estimated from the Cole-Moore shift experiments (see Figs. 3 and 4). In an attempt to isolate these early transitions, we measured the reactivation of the charge movement after a variable recovery period between −50 and −90 mV, a voltage range that detects mainly the early charge movement, or Q1. Fig. 13 shows the plot of the charge movement (Q) as a function of time (t) between −50 and −90 mV and between −50 and 0 mV. Data were fitted to a single exponential of the form Qon(t) = Qmax (1 − aexp−t/τ), where Qon(t) is the area under the On response of the gating current, Qmax is the total charge movement, a is the exponential coefficient, t is time, and τ is the time constant. The fitted function is the continuous line in Fig. 13. In this experiment, the temperature coefficient (Q10) of the charge movement as a function of time was 1.03 for a pulse to −50 mV, and 3.3 for a pulse to 0 mV.
Figure 13.

Reactivation of gating currents after a variable recovery interval showing the kinetic behavior for each component of the total charge movement. Normalized charge movement (Q/Qmax) as a function of the duration of the test-pulse (t, ms) at two different temperatures (20.5 and 9.1°C). Data obtained from the integration of the On response of the gating currents elicited using the double-pulse protocol (Oxford, 1981), between −90 and −50 mV (left), and between −50 and 0 mV (right).
In four different experiments, the energy of activation (E a) for charge moving between −90 and −50 mV was 2.6 ± 1.3 kcal/mol, corresponding to a Q10 = 1.2 ± 0.09, suggesting that this part of the process can be described using multiple steps with low energy barriers, in agreement with the results obtained from Cole-Moore protocol experiments. On the other hand, data from eight different experiments using a pulse to 0 mV, which should activate also the late gating charge-laden transitions that carry more charge, the Q10 was >4 (Q10 = 4.5 ± 0.3, n = 8, E a = 24.5 ± 1.2 kcal/mol). To study the late charge (Q2) in isolation, we studied the charge movement between −50 and 0 mV, which gave an E a = 20.5 ± 3.3 kcal/mol (n = 3) corresponding to a Q10 = 3.6 ± 0.7 (n = 3). This is in agreement with the idea that transitions that make up the second part of the total activation charge dominate the gating current record and contain high energy barriers.
The Effects of Temperature on the Steady State Charge Distribution
The mean charge movement from one membrane potential to another may be obtained from the time integral of gating currents. The results from a typical experiment that covered the 5–22°C temperature range is shown in Fig. 14 A. In experiments that showed reversibility in the total charge after changing temperature, such as the one shown in Fig. 14, the maximum charge did not change significantly by lowering the temperature from 20 to 10°C. However, in all reversible experiments, the total charge displacement invariably showed a tendency to decrease at lower temperatures, as illustrated in Fig. 14 A. In this experiment, the possible error produced by incomplete integration due to very slow kinetics was minimized by speeding the currents up with a pulse to −130 mV. Thus, the decrease at very low temperatures appears real but, as it is small and variable, it is difficult to describe or quantify accurately.
Figure 14.

Q-V distributions at different temperatures. (A) Nonnormalized data from the experiment (Qoff, charge movement during the Off response versus V, voltage). Data obtained from unsubtracted gating current traces elicited from variable test pulses (V). At 11.7 and 4.6°C (□, ▴) test-pulse duration was 300 ms. At 22°C (•, ⋄), test-pulse duration was 100 ms. (B) Normalized data obtained at 4.6°C (▴) and 22°C (•, ○) (Q/Qmax versus V curve). The continuous line corresponds to the fitting with a two-step sequential Boltzmann distribution (see Eq. 6). Parameters obtained from the fit: n = 4 × 10⁹ channels (average value for low and high temperature); z 1 = 1.70 ± 0.11 eo (n = 2); z 2 = 3.13 ± 0.29 eo (n = 2). At 22°C, V1 = −73.35 mV; V2 = −48.87 mV; Q1 = 0.34; Q2 = 0.64. At 4.6°C, V1 = −80.01 mV; V2 = −50.34 mV; Q1 = 0.35; Q2 = 0.62. At low temperature, the first component is shifted to the left by −7 mV, corresponding to a net decrease in entropy of ∼4 kcal/ mol at 20°C (see Table II).
The voltage dependence of the Q-V curve did not change much with temperature. The Q-V curves were fitted to a two-step sequential model of the form:
 |
6 |
where n is the total number of channels and z 1 and z 2 are the valence times fraction of the field of steps 1 and 2, respectively. By calling nz 1 = Q1 and nz 2 = Q2, we define the total charge moving in each transition and we found that the ratio of Q1/(Q1 + Q2) remained practically constant in the range of 3–22°C. This result indicates that a change in temperature leaves the two charge components intact. V1 and V2 are the potentials at which the forward and backward rates are equal in steps 1 and 2, respectively. The midpoint of the Q-V is shifted to more negative potentials when the temperature was lowered, as is shown in the normalized plots of Fig. 14 B. The effect is small, but it is found consistently that at low temperatures the charge is larger than at high temperatures at hyperpolarized potentials. This is reflected in the fit to Eq. 6 in four experiments (see Table II) that showed a shift in the V1 and essentially no shift in V2.
Table II.
Q-V Curves: Fitted Parameters of Two-Step Sequential Scheme and Entropic Change (TΔS) Calculated for First Step
| Experiment | T | V1 | z1 | V2 | z2 | TΔS at 20 | ||||||
|---|---|---|---|---|---|---|---|---|---|---|---|---|
| °C | mV | e0 | mV | e0 | kcal/mol | |||||||
| b1206284.dat | 21.5 | −51.8 | 2.3 | −46.3 | 4.2 | |||||||
| 9.6 | −53.1 | 2.3 | −47.7 | 3.5 | −1.8 | |||||||
| 5.7 | −57.4 | 2.7 | −43.0 | 3.4 | −5.9 | |||||||
| 2.9 | −60.4 | 2.5 | −46.0 | 3.4 | −7.7 | |||||||
| tap197b.dat | 22.3 | −73.4 | 1.8 | −48.9 | 3.4 | |||||||
| 4.6 | −80.0 | 1.6 | −50.3 | 2.8 | −4.3 | |||||||
| 21.5 | −70.8 | 1.7 | −47.9 | 3.2 | ||||||||
| Kse294at.dat | 19.6 | −54.4 | 2.3 | −41.2 | 5.2 | |||||||
| 9.6 | −57.2 | 2.4 | −41.7 | 4.3 | −4.5 | |||||||
| B0606284.dat | 19.6 | −51.6 | 2.3 | −42.6 | 5.7 | |||||||
| 5.3 | −57.7 | 4.5 | −40.5 | 5.8 | −9.8 |
As each exponential term in Eq. 6 represents the ratio of the backward to the forward transition, the preexponential factors of the rates cancel and do not appear in the equation. The argument of the exponentials are the total free energy difference ΔG according to
 |
7 |
where ΔH i and ΔS i are the enthalpic and entropic changes on transition i, where i is 1 or 2. Then Vi in Eq. 6 is given by
 |
8 |
By measuring Vi at temperatures T 1 and T 2, it is possible to compute the entropic change as (Correa et al., 1992)
 |
9 |
The last column of Table II shows the entropic change computed from the observed shifts of V1 expressed as TΔS in kilocalories per mole at 20°C. In all cases, the entropic change is negative. As the Q1 comprises the most negative region of the Q-V curve, this result indicates that, during activation, initial transitions reduce the number of degrees of freedom of the voltage sensor. There is no evidence of an entropic change for the Q2 component, but the results obtained with ionic current measurements using the double pulse procedure (Rodríguez and Bezanilla, 1996) indicate that the opening step also has a negative entropic change.
Effect of Temperature on the Elementary Charge Movement
The analysis of fluctuations of Shaker K+ channel gating currents reveals an elementary charge shot event of ∼2.4 eo (Sigg et al., 1994). Temperature may alter the energy landscape of the charge movement, which could have an effect on the size of the elementary event. To investigate this possibility, the measurement of gating current fluctuations were carried out in a range of voltages and temperatures and the results are shown in Fig. 15. The elementary event has a minimum value in the range of 0–30 mV. As the method to estimate the elementary charge requires the measurement of fluctuations produced exclusively by unidirectional transitions (Conti and Stühmer, 1989; Crouzy and Sigworth, 1993), the values at potentials more negative than 0 mV overestimate the elementary charge due to contamination by backward transitions. At potentials more positive than 40 mV, time resolution suffers due to merging of transitions brought about by increased rates, which leads to an overestimation of the elementary shot event. We thus confined our comparison to the 0–30 mV range and found that there is no significant difference in the size of the elementary event in the 7–18°C temperature range. Although the gross simplicity of the estimate of q with this technique does not allow us to distinguish small differences, it is noteworthy that in this large temperature range there is not a drastic change in the elementary charge. This indicates that the basic sequence of activation steps is not altered by temperature, at least in the region where the large charge transition occurs.
Figure 15.

Elementary gating charge movement. Temperature and voltage dependence. Measurement of the elementary charge movement (eo) estimates the value of the predominant charge transfer in the activation pathway. Gating current ensembles consisting of >100 traces at each voltage in the saturated region of the Q-V were obtained with the macropatch technique. The experiment was performed at three temperatures (18.2°C, •; 9.2°C, ▵; and 7.6°C, ♦).
discussion
Total Charge and Ion Conduction
The total amount of charge moved in the range of −120 to 30 mV remains constant between 20 and 10°C, but it tends to decrease at lower temperatures (Fig. 14). Excluding the possibility of incomplete integration, which was minimized by repolarizing to extreme negative potentials, this could be the result of a decrease of the total charge per channel or a reduction in the number of active channels. The noise analysis of ionic currents indicated that the number of channels remains constant, suggesting that there is a decrease of the activation charge when lowering the temperature. This point could be tested by measuring the charge per channel as a function of temperature using limiting slope (Sigg and Bezanilla, 1997) or by counting channels and measuring total charge (Schoppa et al., 1992; Aggarwal and MacKinnon, 1996; Seoh et al., 1996), but, as the reduction in total macroscopic charge is small, it may prove difficult to detect. Noise analysis experiments also provided information on the effects of temperature on the single channel conductance and the results are consistent with previous findings of a Q10 of the order of 1.5, as expected from a process encountering low energy barriers.
Temperature and the Transitions in the Activation Pathway
In principle, the power of studying kinetics and steady state properties in a voltage-dependent channel as a function of temperature is that it makes it possible to dissect the free energy changes into its enthalpic and entropic components. In practice, however, the interpretation of the results is hampered by the complexity of a multistate process and the difficulty of isolating the elementary rate constants. Thus, the observed changes of kinetics are in fact changes in the observed eigenvalues of the system and not in the elementary rate constants and only by the use of special pulse protocols that enhance one component in favor of the others can one attempt the assignment of the changes to individual transitions.
In the present study, we have studied the effects of temperature on both ionic and gating currents because, as the information obtained with each type of experiment has a different bias, they complement each other. There is enough variability from oocyte to oocyte to make quantitative consistent measurements of ionic and gating currents difficult. In addition, there may be differences between the conducting and nonconducting clones in some of the transitions, and for this reason we have not attempted a global description.
Despite all these caveats, the effects of temperature produce differential effects on the currents that make it possible to draw a few general conclusions. The main finding is that components of the gating current have different temperature dependencies. If the observed charge movement were a simple process or at least a rate-limited process, the entire time course of the gating current would be equally affected by temperature changes and the traces would be superimposable. The results indicate that this is not the case because to superimpose the traces at early times gives a Q10 < 2, and at long times the Q10 is ∼3. Thus, we can conclude that the recorded gating currents show the contribution of charge movements from several transitions that differ in their temperature dependence. The indication from these experiments is that early transitions are less affected by temperature than late transitions and this was verified by two different types of experiments. The analysis of the Cole-Moore shift on the ionic currents confirmed that the temperature coefficient is quite small when the voltage range is restricted to extreme negative potentials. At these potentials, the channel dwells in a set of closed states that are kinetically far from the open state, and by modifying the prepulse potential, the initial distribution is changed among those states. The conclusion is that those transitions are not very temperature dependent. In contrast, the main observed eigenvalue of the ionic currents, which reflect transitions closer to the open state, has a very large temperature dependence (Fig. 2). The other evidence comes from gating current reactivation experiments whereby the recovery at −90 mV of the charge moved after a pulse to −50 mV has almost no temperature dependence (Fig. 13, left). This is in contrast to the temperature dependence at −50 mV for a pulse to 0 mV, which has an important temperature dependence (Fig. 13, right). These results are in agreement with the notion that transitions between closed states, populated at very negative potentials, are less affected by temperature than transitions that occur closer to the open state of the channel.
The charge that moves at negative potentials (Q1) has been previously distinguished from the subsequent charge movement (Q2) on the basis of the steady state Q-V curve and kinetics of the gating currents (Bezanilla et al., 1994). Experimental confirmation that these two types of charge are different has come from fluorescence experiments that show that Q1 correlates better with conformational rearrangements near the S2 segment, while the Q2 correlates with changes near the S4 segment of the Shaker channel molecule (Cha and Bezanilla, 1997). It is thus tempting to speculate that the low temperature coefficient of the early transitions corresponding to Q1 originate from a different region of the channel molecule. The temperature dependence of the steady state properties of Q1 further indicates that those conformations experience a decrease in entropy (Fig. 14 and Table II). A possible interpretation of these results is that the initial steps in channel activation require an ordering of the channel molecule that may be required for the occurrence of the following transitions that carry most of the charge that leads to channel opening.
The separation of the exponential components of the gating current transient show that at −60 mV the fast and slow components have a smaller Q10 than the corresponding components recorded from a pulse at −10 mV (Figs. 10 and 11). The difference is not as large as one would expect when compared with the measurements done with Cole-Moore and channel opening. This may be the consequence of measuring observed eigenvalues that are a composite of different rates with low and high temperature coefficient. In this regard, it seems more appropriate to separate the components with the recovery experiments, as described above, because the weight of the exponential components is changed by the initial conditions.
The results of the double pulse experiments reported before (Rodríguez and Bezanilla, 1996) indicate that the opening step is not rate limiting and that it only has temperature dependence in the return from the open to the first closed state. The prediction from those results was that the steady state P or-V curve should be displaced to the left when the temperature is lowered and the G-V curve computed as indicated in Fig. 5, indeed shows this shift consistent with the double pulse experiment.
Kinetic Model
A kinetic model that is able to reproduce the features of the currents at all voltages and temperatures would allow the description of the enthalpic and entropic components of each of the elementary rate constants. Such models should be based on the results of ionic and gating currents recorded in a large range of potentials and covering a large range of temperatures. The recording of ionic and gating currents is normally done in different oocytes and, as there is a large variability in the kinetics of the Off currents among oocytes, a global fitting becomes difficult. The problem gets compounded by the fact that gating currents are best recorded in the W434F mutant, which may have subtle differences with the clone that has the intact pore region. For these reasons, we have settled for a fit of the gating currents traces only, while drawing information from ionic current data to constrain a few of the parameters of the fit.
We have tested two types of models. The first type consists of four subunits, each having three states (Zagotta et al., 1994). In this model, when all four subunits are in the last state the channel can progress to the open state through one more transition. The second type is a sequential model that has multiple transitions in a linear sequence (similar to the previously proposed model by Bezanilla et al., 1994). We have not seen a good fit to the data with the first type of model because they do not reproduce well the drastic change in kinetics observed in the Off gating currents when the temperature is lowered. As the sequential model does seem to fit the data better than the three-state-four-subunit model, we are presenting here the fit obtained with a data set of five different membrane potentials done at two temperatures.
The model is presented in Table III along with the rate equations and the fitted parameters. Fitted values for the enthalpic barriers for the forward ΔHf and backward rate ΔHb constants are presented for each one of the transitions, as well as the net enthalpic change ΔHss. The fitted values of αi0 and βi0 in Table III include the product of the preexponential factor times exp (ΔS/R) and we have not attempted to compute the entropic terms from these values because we do not have a value for the preexponential factor. However, by assuming the same preexponential factor for the forward and backward rate constants, we could compute the entropic change for each transition (ΔSss) that is indicated in the last column of Table III as TΔSss at 20°C. The values of the valence times fraction of the field are presented for the forward and backward rates in the third and fourth columns of Table III.
The gating current traces and the fitted traces are presented in Fig. 16. The rate constants and valence for the transition from the open to the blocked state were assumed to be independent of temperature and their values were extracted from Zagotta el al. (1994). The valence of the transition between the last closed state and the open state was obtained from Rodríguez and Bezanilla (1996), but the rate constants were obtained through fitting of the gating current data. The general features of the model roughly agree with the experimentally observed eigenvalues obtained from ionic and gating currents. The model consists of a long series of transitions (subindex 0) with low valence and low enthalpic changes, followed by two transitions with higher enthalpic changes in which the first one (subindex 1) has a very large valence and the second one (subindex 2) has a lower valence. These two transitions are followed by the last transition (subindex 3) that leads to the open state. In several attempts to reproduce the marked changes in kinetics of the gating current tail when lowering the temperature, it was found that one of the backward rates near the transition carrying most of the charge had a reverse temperature dependence. In the set of fitted parameters shown in Table III, that occurs in ΔHb2.
While the model seems to fit the gating current traces fairly well, there are a few results from the model that do not agree as well with the expectations based on the analysis of the gating currents. One of them is that the Q10 of the initial transitions seems higher than the low Q10 measured from the Cole-Moore shift and charge movement recovery. Also, the fitted parameters predict a total amount of charge per channel about half what has been measured experimentally (Schoppa et al., 1992; Aggarwal and MacKinnon, 1996; Seoh et al., 1996), suggesting perhaps that the measured gating current is the result of the concerted operation of two of the four subunits. Although the results of modeling should then be viewed with caution, the discrepancies of the models with this richer data set that includes temperature dependence may be considered an indicator that none of the proposed models are good representations of the Shaker channel operation.
Conclusion
The differential effects of temperature on the ionic and gating currents suggest that, during activation, the Shaker K+ channel first evolves through a series of closed state transitions with relatively low enthalpic barriers that decrease the degrees of freedom of the channel structure. It then undergoes large enthalpic and positive entropy changes during at least one transition that moves most of the charge, ultimately finishing with an opening transition that requires an ordering of the molecule.
Acknowledgments
We thank Dagoberto Grenet for oocyte preparation and Jin Yuguang for oocyte injections.
This work was supported by Public Health Service grant GM30376 and CONICIT S1-95000502 (Venezuela).
Abbreviations used in this paper
- G-V curve
conductance versus voltage curve
- MES
methanosulphonate
- NMG
N-methyl-glucamine
- Por-V curve
relative open probability versus voltage curve
- Q-V curve
charge versus voltage curve
Footnotes
Portions of this work were previously published in abstract form (Rodríguez, B.M., D. Sigg, and F. Bezanilla. 1995. Biophys. J. 68:A137. Rodríguez, B.M., D. Sigg, and F. Bezanilla. 1996. Biophys. J. 70:A143. Rodríguez, B.M., and F. Bezanilla. 1998. Biophys J. 74:A215).
references
- Aggarwal SK, MacKinnon R. Contribution of the S4 segment to gating charge in the Shaker K+channel. Neuron. 1996;16:1169–1177. doi: 10.1016/s0896-6273(00)80143-9. [DOI] [PubMed] [Google Scholar]
- Armstrong CM, Bezanilla F. Inactivation of the sodium channel. II. Gating current experiments. J Gen Physiol. 1977;70:567–590. doi: 10.1085/jgp.70.5.567. [DOI] [PMC free article] [PubMed] [Google Scholar]
- Bendorf K, Koopmann R. Thermodynamic entropy of two conformational transitions of single Na+channel molecules. Biophys J. 1993;65:1585–1589. doi: 10.1016/S0006-3495(93)81197-4. [DOI] [PMC free article] [PubMed] [Google Scholar]
- Bezanilla F, Perozo E, Stefani E. Gating of Shaker K+-channels: II. The components of gating currents and a model of channel activation. Biophys J. 1994;66:1011–1021. doi: 10.1016/S0006-3495(94)80882-3. [DOI] [PMC free article] [PubMed] [Google Scholar]
- Bezanilla F, Taylor RE. Effect of temperature on gating currents. Biophys J. 1978a;21:85a. doi: 10.1016/S0006-3495(78)85464-2. [DOI] [PMC free article] [PubMed] [Google Scholar]
- Bezanilla F, Taylor RE. Temperature effects on gating currents in the squid giant axon. Biophys J. 1978b;23:479–484. doi: 10.1016/S0006-3495(78)85464-2. [DOI] [PMC free article] [PubMed] [Google Scholar]
- Cha A, Bezanilla F. Characterizing voltage-dependent conformational changes in the Shaker K+channel with fluorescence. Neuron. 1997;19:1127–1140. doi: 10.1016/s0896-6273(00)80403-1. [DOI] [PubMed] [Google Scholar]
- Cole KS, Moore JW. Potassium ion current in the squid giant axon: dynamic characteristic. Biophys J. 1960;1:1–14. doi: 10.1016/s0006-3495(60)86871-3. [DOI] [PMC free article] [PubMed] [Google Scholar]
- Conti F, Stühmer W. Quantal charge redistributions accompanying the structural transitions of sodium channels. Eur Biophys J. 1989;17:53–59. doi: 10.1007/BF00257102. [DOI] [PubMed] [Google Scholar]
- Correa AM, Bezanilla F, Latorre R. Gating kinetics of batrachotoxin-modified Na+channels in the squid giant axon. Voltage and temperature effects. Biophys J. 1992;61:1332–1352. doi: 10.1016/S0006-3495(92)81941-0. [DOI] [PMC free article] [PubMed] [Google Scholar]
- Crouzy SC, Sigworth FJ. Fluctuations in ion channel gating currents. Analysis of nonstationary shot noise. Biophys J. 1993;64:68–76. doi: 10.1016/S0006-3495(93)81341-9. [DOI] [PMC free article] [PubMed] [Google Scholar]
- Hodgkin AL, Huxley AF. A quantitative description of membrane current and its application to conduction and excitation in nerve. J Physiol (Camb) 1952;117:500–544. doi: 10.1113/jphysiol.1952.sp004764. [DOI] [PMC free article] [PubMed] [Google Scholar]
- Hoshi T, Zagotta WN, Aldrich RW. Biophysical and molecular mechanisms of Shakerpotassium channel inactivation. Science. 1990;250:533–538. doi: 10.1126/science.2122519. [DOI] [PubMed] [Google Scholar]
- Jonas P. Temperature dependence of gating current in myelinated nerve fibers. J Membr Biol. 1989;112:277–289. doi: 10.1007/BF01870958. [DOI] [PubMed] [Google Scholar]
- Keynes RD, Rojas E. Kinetics and steady-state properties of the charged system controlling sodium conductance in the squid giant axon. J Physiol (Camb) 1974;239:393–434. doi: 10.1113/jphysiol.1974.sp010575. [DOI] [PMC free article] [PubMed] [Google Scholar]
- Kimura JE, Meves H. Effect of temperature on the asymmetrical charge movement in squid giant axons. J Physiol (Camb) 1977;271:14–15. [PubMed] [Google Scholar]
- Kimura JE, Meves H. The effect of temperature on the asymmetrical charge movement in squid giant axons. J Physiol (Camb) 1979;289:479–500. doi: 10.1113/jphysiol.1979.sp012748. [DOI] [PMC free article] [PubMed] [Google Scholar]
- Meves H, Vogel W. Slow recovery of sodium current and “gating current” from inactivation. J Physiol (Camb) 1977;267:395–410. doi: 10.1113/jphysiol.1977.sp011819. [DOI] [PMC free article] [PubMed] [Google Scholar]
- Murrel-Lagnado RD, Aldrich RW. Interactions of amino terminal domains of ShakerK channels with a pore blocking site studies with synthetic peptides. J Gen Physiol. 1993;102:949–975. doi: 10.1085/jgp.102.6.949. [DOI] [PMC free article] [PubMed] [Google Scholar]
- Oxford GS. Some kinetic and steady state properties of sodium channels after removal of inactivation. J Gen Physiol. 1981;77:1–22. doi: 10.1085/jgp.77.1.1. [DOI] [PMC free article] [PubMed] [Google Scholar]
- Perozo E, Papazian DM, Stefani E, Bezanilla F. Gating currents in Shaker K+-channels. Implications for activation and inactivation models. Biophys J. 1992;62:160–171. doi: 10.1016/S0006-3495(92)81802-7. [DOI] [PMC free article] [PubMed] [Google Scholar]
- Rodríguez BM, Bezanilla F. Transitions near the open state in Shaker-K+channel: probing with temperature. Neuropharmacology. 1996;35:775–785. doi: 10.1016/0028-3908(96)00111-6. [DOI] [PubMed] [Google Scholar]
- Schoppa NE, McCormack K, Tanouye MA, Sigworth FJ. The size of the gating charge in wild-type and mutant Shakerpotassium channels. Science. 1992;255:1712–1715. doi: 10.1126/science.1553560. [DOI] [PubMed] [Google Scholar]
- Seoh S-A, Sigg D, Papazian DM, Bezanilla F. Voltage-sensing residues in the S2 and S4 segments of the Shaker K+channel. Neuron. 1996;16:1159–1167. doi: 10.1016/s0896-6273(00)80142-7. [DOI] [PubMed] [Google Scholar]
- Sigg D, Bezanilla F. Total charge movement per channel: the relation between gating charge displacement and the voltage sensitivity of activation. J Gen Physiol. 1997;109:27–39. doi: 10.1085/jgp.109.1.27. [DOI] [PMC free article] [PubMed] [Google Scholar]
- Sigg D, Stefani E, Bezanilla F. Gating current noise produced by elementary transitions in Shakerpotassium channels. Science. 1994;264:578–582. doi: 10.1126/science.8160016. [DOI] [PubMed] [Google Scholar]
- Sigworth FJ. The variance of sodium current fluctuations at the node of Ranvier. J Physiol (Camb) 1980;307:97–129. doi: 10.1113/jphysiol.1980.sp013426. [DOI] [PMC free article] [PubMed] [Google Scholar]
- Silberberg SD, Magleby KL. Preventing errors when estimating single channels properties from the analysis of current fluctuations. Biophys J. 1993;65:1570–1584. doi: 10.1016/S0006-3495(93)81196-2. [DOI] [PMC free article] [PubMed] [Google Scholar]
- Starace DM, Stefani E, Bezanilla F. Voltage-dependent proton transport by the voltage sensor of the Shaker K+channel. Neuron. 1997;19:1319–1327. doi: 10.1016/s0896-6273(00)80422-5. [DOI] [PubMed] [Google Scholar]
- Stefani E, Perozo E, Toro L, Bezanilla F. Gating of Shaker K+-channels: I. Ionic and gating currents. Biophys J. 1994;66:996–1010. doi: 10.1016/S0006-3495(94)80881-1. [DOI] [PMC free article] [PubMed] [Google Scholar]
- Stimers JR, Bezanilla F, Taylor RE. Sodium channel activation in squid giant axon: steady state properties. J Gen Physiol. 1985;85:65–82. doi: 10.1085/jgp.85.1.65. [DOI] [PMC free article] [PubMed] [Google Scholar]
- Zagotta WN, Hoshi T, Dittman J, Aldrich R. Shakerpotassium channel gating III: evaluation of kinetic models for activation. J Gen Physiol. 1994;103:321–362. doi: 10.1085/jgp.103.2.321. [DOI] [PMC free article] [PubMed] [Google Scholar]