Abstract
The membrane topology of the human apical sodium-dependent bile acid transporter (hASBT) remains unresolved. Whereas N-glycosylation analysis favors a 7 transmembrane (TM) model, membrane insertion scanning supports a 9TM topology. In order to resolve this controversy, we used dual label epitope insertion to systematically examine the topological framework of hASBT. Two distinct epitopes, hemagglutinin (HA) and FLAG, were individually inserted by inverted PCR mutagenesis at strategic positions along the hASBT sequence. Cell surface biotinylation and immunoblotting with epitope-specific and anti-hASBT antibodies confirmed expression and trafficking of the mutants to the plasma membrane. Confocal microscopy confirmed membrane localization of epitope-tagged hASBT in saponin-treated (permeabilized) and non-permeabilized transfected COS-1 and MDCK cells. Tags at positions 116, 120, 186, 270 and 284 were accessible to the epitope antibodies in non-permeabilized cells, indicative of the extracellular localization of loops 1 (99-130), 2 (180-191), and 3 (253-287). The corresponding positions in the 9TM model were predicted to be intracellular or membrane bound. Epitope mutants at residues 56, 92, 156 and 221 were only detected after treatment with saponin, indicating the intracellular localizations of loops 1 (50-73), 2 (150-160), 3 (215-227) as predicted by a 7 TM model. Our results also confirm the exofacial and cytosolic localization of N- and C-terminal tails, respectively. With the exception of constructs inserted at position 120, epitope mutants displayed active, sodium-dependent taurocholate uptake. Consequently, our study strongly supports a 7 TM topology for hASBT and refutes the previously proposed 9 TM model.
Keywords: Substituted Cysteine Accessibility Method, bile acid, transporter, mutagenesis
The apical localization of SLC10A2, the sodium-dependent bile acid transporter (1-3), on the distal ileum and cholangiocytes contributes to the enterohepatic circulation of bile acids (4) and cholesterol homeostasis (5-7). Although its crystal structure has not yet been elucidated, critical structural and functional determinants have been evaluated by biochemical methods (8), site-directed mutagenesis (9-12) and photo affinity labeling (13). Based on these data, structure-activity models for hASBT have been generated (14, 15). Extending these studies to develop a three-dimensional representation of hASBT protein would require its essential domain structure and transmembrane (TM) topology (11).
Hydropathy analysis proposes between seven to nine putative TM domains (TMDs) with an extracellular glycosylated N-terminus and a cytoplasmic C-terminus (16). However, there is controversy regarding the exact membrane topology of ASBT. Whereas in vitro translational studies based on membrane-insertion-scanning mutagenesis suggested the possibility of a 9TM hASBT topology (17), there is a notable inconsistency within this model: two membrane-spanning regions (TMD3 and TMD4) comprise only 9-10 amino acids, representative of a β-sheet conformation; however, a mixture of α-helices and β-sheet TMDs is highly uncommon for polytopic membrane proteins. Recent data from our laboratory revealed the successful N-glycosylation of strategically introduced consensus sequences at hASBT residues 113-118 and 266-272 (11), suggesting an exofacial localization of the protein regions they associate with. These data intrinsically infer a 7TM model. Thus, data by Hallén and colleagues (17) support a 9TM model, whereas our recent data (11) indicate that a 7TM model may be preferred. This discrepancy could be explained by the occurrence of a re-entrant loop, a feature observed for a few membrane transporters (18-20), but this possibility needs further investigation. Interestingly, a recent study on the liver Na+-dependent bile acid transporter (NTCP, SLC10A1) a close homologue of ASBT, indicated that this protein adheres to a 7TM topology thereby indirectly suggesting that ASBT may display a similar topography profile (21).
To differentiate effectively and definitively between the proposed 7 and 9 TM hASBT models, we have used dual epitope tag insertion scanning as a complementary approach to unambiguously confirm its membrane topology. Epitope tags are incorporated along all possible extracellular and intracellular regions of the protein, whether predicted by the 7TM or 9TM models. As opposed to membrane insertion scanning techniques, the data obtained here are based purely on the analysis of a full-length, biologically active protein in mammalian cell lines, which provide a suitable environment for proper post-translational modifications. We used the FLAG and hemagglutinin (HA) epitope tags, which are distinctly different in both size and charge, thereby diminishing interpretation issues due to incomplete or deficient expression. The epitope insertion constructs were transfected into COS-1 cells and their accessibility to anti-FLAG and anti-HA antibodies evaluated under permeabilized (i.e. saponin treated) and native conditions to determine their orientation relative to the plasma membrane. Thus, we have exhaustively analyzed all predicted intracellular and extracellular structural determinants of hASBT and our data effectively refute the previously proposed 9TM model and further strengthens the predominance of a 7TM topology. This study permits the development of novel structural models for hASBT that may aid in the identification of amino acid residues critical for function and allow for simulation of potential ligand binding domains.
Experimental Procedures
Materials
3H-Taurocholic acid (50 Ci/mmol) was purchased from American Radiolabeled Chemicals, Inc, (St. Louis, MO). Taurocholic acid was from Sigma (St. Louis, MO). All other reagents and chemicals were of the highest purity available commercially. 5-phosphorylated oligonucleotides for Inverted PCR mutagenesis (INPCRM) studies were custom synthesized and purchased from Sigma Genosys (St. Louis, MO).
Cell Culture
The monkey kidney fibroblast cell line, COS-1 (CRL- 1650) and MDCK-II were obtained from ATCC (Manassas, VA). Cells were grown and maintained in Dulbecco's modified Eagle's Medium containing 10% fetal calf serum, 4.5g/L glucose, 100 units/ml penicillin and 100 μg/ ml streptomycin (Life Technologies, Inc, Rockville, MD) at 37 °C in a humidified atmosphere with 5% CO2.
For transient transfections, cells were seeded at a density of 6×10 4cells/ml on 24 well plates (Costar, Corning, NY) in antibiotic free medium. 48 to 72 hours post transfection the cells were used for subsequent studies (11, 12).
Site-directed Mutagenesis
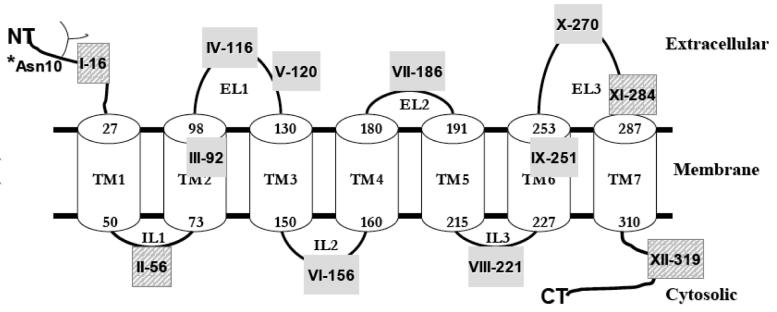
HA and FLAG epitopes were inserted at discrete locations in hASBT (Fig. 1) as 9 (YPYDVPDYA) and 8 (DYKDDDDK) amino acid peptides, respectively, by inverted PCR mutagenesis (INPCRM) as described previously (22). Briefly, a full-length cDNA for human ASBT cloned into pCMV5 vector (kindly provided by Dr. Paul Dawson, Wake Forest University, Wisconsin-Salem, NC) was used as the template for all mutagenesis reactions. All oligonucleotides were 5'-phosphorylated. The primers (Table 1, 2) were designed such that the first half of the epitope sequence was incorporated at the 5'-end of the upstream primer and the second half of the epitope sequence was incorporated into the 5'- end of the downstream primer. Amplification was confirmed by running an aliquot of the reaction mixture on a 1% agarose gel. The PCR product was purified using the Geneclean ® Turbo Kit (Qbiogene, Carlsbald, CA), resuspended in Tris-HCl, pH 8.5 and ligated using T4 DNA ligase (NEB, Beverly, MA) for 2 h at room temperature followed by heat inactivation of the ligase for 10 min at 65 °C. The ligated product was then incubated with DpnI for 4 hrs to eliminate template DNA. One Shot Top10 E. coli competent cells (Invitrogen, Carlsbald, CA) were transformed with the DpnI digested product, plated on Luria-Bertani (LB)–ampicillin (100 μg/ml) plates and incubated overnight at 37 °C. Several colonies were picked and expanded in LB broth. Plasmid minipreps were performed using the Qiagen Plasmid Miniprep Kit (Qiagen, Chatsworth, CA). Correct clones were selected after confirming the FLAG and HA insertion constructs by DNA sequencing.
Fig. 1.
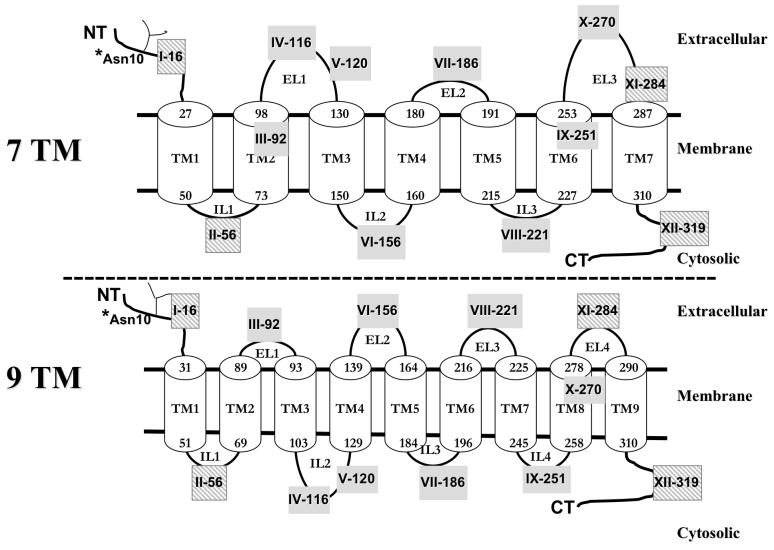
Comparison of the putative 7TM versus 9TM membrane topology model for hASBT. Strategically inserted FLAG and HA epitopes are illustrated by roman numerals followed by the amino acid position immediately preceding the epitope insert. Transmembrane helices are represented as cylinders and numbers indicate the amino acids at the interface of the TMD (transmembrane domain) and the extramembranous environment. *Asn10 represents the sole glycosylation site on hASBT. Hashed gray boxes indicate epitope sites that are conserved between both topologies. NT, N-terminus; CT, C-terminus.
TABLE 1.
PCR primers for hASBT mutant constructs with HA insertions
| HA constructa |
Insertion sites b |
Position (7TM/9TM) c |
Forward Primer d | Reverse Primer e |
|---|---|---|---|---|
| I | S15-G16 | NT/NT | 5' Xggtgcatcctgtgtgg3' | 5' Zagagcaaactgttgcattg3' |
| II | F56-L57 | IL1/IL1 | 5' Xggccacataaagcgg3' | 5' Ztagaaatttcttgatctccac3' |
| III | D91-I92 | TMD2/EL1 | 5' Xatcctcccgctccaggcc3' | 5' Zgtcaaaggccaccgacagg3' |
| IV | L115-A116 | EL1/IL2 | 5' Xgcctattgggtcgatggc3' | 5' Zcaagatattggaggcagttcc3' |
| V | D120-G121 | EL1/IL2 | 5' Xgatggcgacatggacctg3' | 5' Zgacccaataggccaag3' |
| VI | D155-S156 | IL2/EL2 | 5' Xtctgggagcatcgtaattc3' | 5' Zgtcgacccacattttggtatag3' |
| VII | K185-W186 | EL2/IL3 | 5' Xtggccccaaaaagcaaagatc3' | 5' Ztttgtgattaacaaacattcc3' |
| VIII | W220-IL221 | IL2/EL3 | 5' Xatcattgctcccaaactgtg3' | 5' Zccaggcgctttggtacaatatg3' |
| IX | L250-P251 | TMD6/IL4 | 5' Xccctggtacaggtgccgaac3' | 5' Ztagaccagcaattctagccag3' |
| X | L269-C270 | EL3/TMD8 | 5' Xtgttccaccatcgttcagc3' | 5' Ztagctgcgtgttctgcatccc3' |
| XI | L283-N284 | EL3/EL4 | 5' Xaatgtcgtattcaccttcccg3' | 5' Zgagctcctcaggagtgaaggag3' |
| XII | K319-A320 | CT/CT | 5' Xaaggcagaaattccag3' | 5' Zgttttttccatgacatttc3' |
hASBT-HA constructs I-XII as illustrated in Fig.1
Location of HA epitope insertion in hASBT primary sequence; NT, N-terminus; CT, C-terminus.
Localization of the construct relative to the putative 7TM or 9TM topology
Forward primer where ‘X’ is the second half of HA sequence-gtg cct gat tac gcc
Reverse primer where ‘Z’ is the first half of the HA epitope sequence – gtc gta agg gta
TABLE 2.
PCR primers for hASBT mutant constructs with FLAG insertions
| FLAG constructa |
Insertion sites b |
Position (7TM/9TM)c |
Forward Primer d | Reverse Primer e |
|---|---|---|---|---|
| I | S15-G16 | NT/NT | 5' Xggtgcatcctgtgtgg3' | 5' Zagagcaaactgttgcattg3' |
| II | F56-L57 | IL1/IL1 | 5' Xggccacataaagcgg3' | 5' Ztagaaatttcttgatctccac3' |
| III | D91-I92 | TMD2/EL1 | 5' Xatcctcccgctccaggcc3' | 5' Zgtcaaaggccaccgacagg3' |
| IV | L115-A116 | EL1/IL2 | 5' Xgcctattgggtcgatggc3' | 5' Zcaagatattggaggcagttcc3' |
| V | D120-G121 | EL1/IL2 | 5' Xgatggcgacatggacctg3' | 5' Zgacccaataggccaag3' |
| VI | D155-S156 | IL2/EL2 | 5' Xtctgggagcatcgtaattc3' | 5' Zgtcgacccacattttggtatag3' |
| VII | K185-W186 | EL2/IL3 | 5' Xtggccccaaaaagcaaagatc3' | 5' Ztttgtgattaacaaacattcc3' |
| VIII | W220-IL221 | IL2/EL3 | 5' Xatcattgctcccaaactgtg3' | 5' Zccaggcgctttggtacaatatg3' |
| IX | L250-P251 | TMD6/IL4 | 5' Xccctggtacaggtgccgaac3' | 5' Ztagaccagcaattctagccag3' |
| X | L269-C270 | EL3/TMD8 | 5' Xtgttccaccatcgttcagc3' | 5' Ztagctgcgtgttctgcatccc3' |
| XI | L283-N284 | EL3/EL4 | 5' Xaatgtcgtattcaccttcccg3' | 5' Zgagctcctcaggagtgaaggag3' |
| XII | K319-A320 | CT/CT | 5' Xaaggcagaaattccag3' | 5' Zgttttttccatgacatttc3' |
hASBT-FLAG constructs I-XII as illustrated in Fig.1
Location of HA epitope insertion in hASBT primary sequence; NT, N-terminus; CT, C-terminus.
Localization of the construct relative to the putative 7TM or 9TM topology
Forward primer where ‘X’ is the second half of FLAG sequence-gat gac gac aag
Reverse primer where ‘Z’ is the first half of the FLAG epitope sequence – gtc ctt gta gtc
Taurocholate Uptake Assay
Uptake experiments were performed as described previously (11). In brief, 72 hours post transfection of COS-1 cells with the FLAG and HA-tagged epitope mutants, the cells were incubated with uptake buffer (modified Hanks' Balanced Salt Solution (MHBSS, pH 7.4)) containing 5 μM 3H- taurocholic acid (TCA) (0.2Ci/mmol) for 12 min. Uptake was stopped by washing the cells four times in ice-cold DPBS, (pH 7.4) containing 0.2% fatty acid free bovine serum albumin (BSA) and 0.5mM TCA. Parallel uptake studies were carried out in the absence of sodium by substituting 137 mM choline chloride as an equimolar replacement for NaCl. Cell-associated radioactivity was measured using an LS6500 liquid scintillation counter (Beckmann Coulter, Inc., Fullerton, CA) and normalized to total protein content, determined using the Bradford assay (Bio-Rad, Hercules, CA).
Cell Surface Biotinylation and Western Blotting
Whole cell lysates were prepared using lysis buffer containing 1% Triton-X 100 and protease inhibitors. Equal amounts of total protein were separated on 12.5% Tris-HCl SDS-PAGE gels (Bio-Rad, Hercules, CA). To determine protein trafficking to the plasma membrane, COS-1 cells transfected with native hASBT and mutant constructs were subjected to cell surface biotinylation as described in (23) with slight modifications. Briefly, 72 hrs post-transfection the cells were washed with PBS and incubated with NHS-SS-biotin (1.5 mg/ml) (Pierce, Inc, Rockford, IL) for 30 mins at room temperature. The reaction was quenched by washing the cells twice with 100 mM glycine in ice-cold PBS. Biotinylated cells were disrupted in lysis buffer (300 mM NaCl, 25 mM Tris (pH 7.5), 1 mM CaCl2, 1% Triton X-100 and 1 mini tablet of protease inhibitor cocktail (Roche Biologicals, Indianapolis, IN) and lysis was enhanced by repeated aspiration through a 25-gauge needle followed by incubation on ice for 30 minutes. The samples were centrifuged at 10,000×g for 15 min and further eluted from supernatants with streptavidin-agarose beads (100 μl) (Pierce, Rockford, IL) overnight at 4 °C. The biotinylated proteins were eluted in SDS-PAGE Laemlli buffer, pH 6.8 (Sigma-Aldrich, St, Louis, MO) by heating the samples for 10 mins at 85 °C. One-fifth of each sample was separated on a 12.5 % SDS-PAGE gel, transferred to a PVDF membrane and processed for Western blotting. Total protein from whole cell lysate preparations were immunoblotted with a custom-made rabbit anti-hASBT antibody (1:1000), mouse anti-FLAG (Sigma) (1:500) and anti-HA antibodies (Roche Biologicals) (1:150). Biotinylated proteins were immunoblotted with anti-hASBT antibody and α-integrin (150 kDa) was used as a plasma membrane protein internal control. To determine the integrity of biotinylated protein processing, a sample of native hASBT whole cell lysate was run on the same gel. After immunoblotting for integrin and ASBT, the membrane was stripped (500 mM Tris (pH 6.7), 100 mM 2-mercaptoethanol, 2% SDS) for 45 mins at 50 °C, then washed repeatedly in PBS-T and incubated with blocking buffer (5% dry milk powder in PBS-T) for 2 hrs. The membrane was subsequently incubated with anti-calnexin primary antibody (90 kDa) and processed for immunodection using the ECL Plus Kit (Amersham Biosciences, Piscataway, NJ).
Immunofluoresence and Confocal Microscopy
COS-1 cells and MDCK-II cells were grown on collagen-treated 4 chamber slides (BD Falcon, Bedford, MA) at 6×10⁴ cells/well. 72 hours post transfection, the cells were washed twice with DPBS pH 7.4 and fixed with 4% paraformaldehyde at room temperature for 10 min. The optimal conditions for cell permeabilization were determined by incubating COS-1 cells for 4 min with different concentrations of saponin ranging from 0.01-0.2%. The lowest concentration of saponin that produced more than 90% staining with trypan blue was 0.04%, and this concentration was used in further experiments. Under permeabilized conditions, cells were simultaneously blocked and permeabilized with PBS containing 0.25% cold-water fish gelatin and 0.04% saponin at 4 °C, overnight (24, 25). For non-permeabilized conditions, cells were blocked similarly in the absence of saponin. Subsequently, cells were incubated with the primary antibodies, rabbit anti-hASBT, monoclonal mouse anti-FLAG (Sigma, St. Louis, MO) and the mouse monoclonal anti-HA antibody, 12CA5, (Roche Molecular Biochemicals, Indianapolis, IN) at 1:100, 1:250 and 1:150 respectively for 2 h at room temperature in the appropriate blocking buffers. The cells were washed three times and incubated with the fluorescently labeled secondary antibodies, i.e. Alexa fluor 546 anti-mouse IgG or Alexa fluor 405 anti-mouse IgG or Alexa fluor 546 anti-rabbit IgG (Molecular Probes, Eugene, OR) at 1:250 dilution in blocking buffer for 1h. The cells were washed thoroughly in PBS and stained with 300 nM DAPI for 10 mins. Cells were mounted in Gel Mount (Biomeda, Foster city, CA) and examined using the Nikon TE2000 C1 Inverted laser scanning confocal microscope coupled with 405, 488 and 543 nm lasers. Volocity, version 3.6 (Improvision, Lexington, MA) was used to deconvolve the z-stack images (Fig. 7).
Fig. 7.
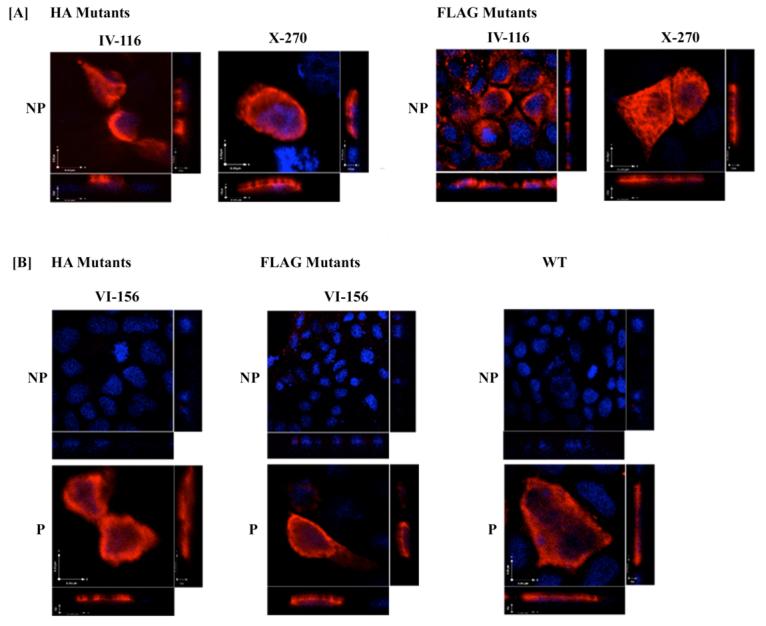
Cellular localization of epitope-tagged mutants in polarized MDCK-II cells. MDCK-II cells, grown on collagen-treated chambers slides, were transiently transfected with native hASBT (WT) and mutant hASBT constructs. 72 hours post transfection, cells were processed for immunofluoresence confocal laser scanning microscopy under permeabilizing (P) and nonpermeabilizing conditions (NP). Panel A displays cells expressing mutants that localize on the extracellular plasma surface, whereas panel B represents cells that express epitope constructs that can only be visualized after saponin treatment (P), indicative of intracellular localization. Native hASBT was used as a positive control to depict intracellular and apical localization. Images represent orthogonal 3-D profiles with the inset view defining the XY axis and the outer panels reveal the YZ (right side) and XZ (bottom side) focal planes. Epitope-tagged mutants and native hASBT exhibited apical localization (red fluorescent signal) relative to the DAPI-stained cell nucleus (blue signal). Fluorescence signal was absent at the basolateral side. All stacked images were acquired using 512×512 pixel resolution under a 60× oil objective. All images were subjected to iterative deconvolution set at 99% confidence using the calculated point spread function with the Volocity 3.6 software. Scale bar, 10 μm.
Data Analysis and Statistics
Functional experiments were run in triplicate, and data are represented as mean ± S.D. Statistical analyses using one-way ANOVA and Students's t-test were performed to compare native hASBT with epitope mutants. Statistical significance was considered at p ≤ 0.05.
Results
Construction of HA and FLAG Epitope-Tagged Mutants
The epitope insertion approach was chosen to a) comprehensively examine the membrane topology of hASBT, and b) assess the functional consequences of disrupting the selected insertion site. Two epitopes with distinctly different charge characteristics were used to determine the potential influence of charge on the orientation of protein segments at the insertion points. In order to map more precisely the intracellular (IL) and extracellular loops (EL) as well as the N- and the C- terminal regions, we strategically inserted the FLAG (DYKDDDDK) and HA (YPYDVPDYA) epitope tags in various predicted EL, IL, and TM domains and at the N- and C-termini using INPCRM (Fig. 1).
The topological orientation of constructs I-16, II-56, XI-284 and XII-319 is model-independent and insertion mutations at these positions served as controls to determine the effectiveness of the epitope scanning approach. For example, mutants I and XII were constructed to corroborate the previously reported exofacial and cytosolic orientation of the N- and the C- terminal tails, respectively (1, 3, 17). To effectively distinguish between the divergent topology models, mutants IV-VIII were designed to localize on opposite sides of the membrane according to either the 7TM or the 9TM model (Fig. 1). Design limitations allowed additional mutants (III-92, IX-251, and X-270) to be accessible extramembranously only according to one topology model and fall within the membrane according to the other. Hence, data obtained from these mutants may be more ambiguous. To determine if insertions close to the membrane would affect the orientation of the relatively long (>30 amino acids) EL1 and EL3 domains, two tags were inserted on each loop. All epitope mutants were successfully verified by sequencing; however, the insertion of the HA epitope at position 56 could not be determined and was omitted from further analysis.
Plasma Membrane Expression of Mutant Constructs
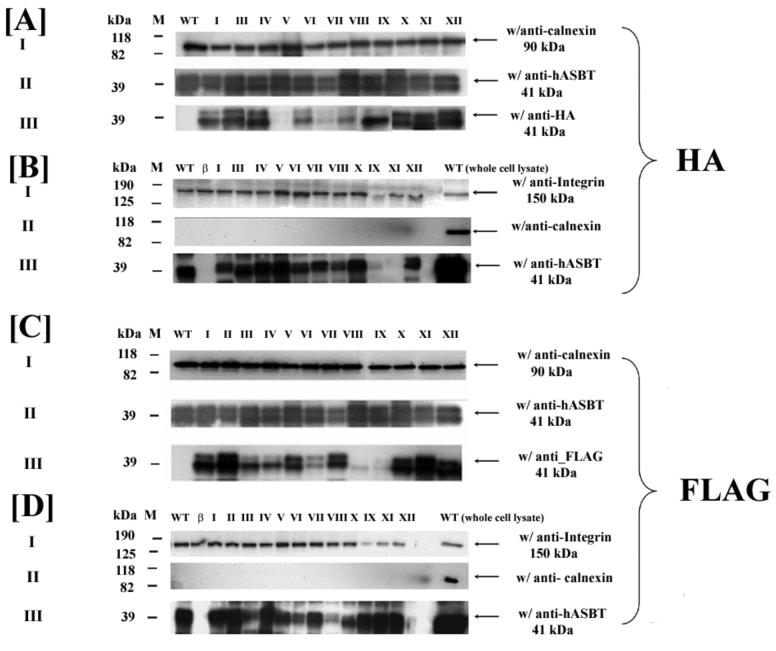
hASBT can be detected as a pair of unglycosylated (∼38 kDa) and glycosylated (∼41 kDa) immunoreactive bands (Fig. 2). Similar banding patterns were observed upon incubation with anti-HA or anti-FLAG epitope antibodies (Figs. 2A and C). All mutants were accessible to the anti-hASBT antibody, indicating successful expression, but detection by the anti-epitope antibodies varied according to antibody accessibility. For example, band intensity of HA mutants V and VII (Figs. 2A.III.) and FLAG mutants VIII and IX (Fig. 2C.III.) was much weaker compared to matching anti-hASBT control. This may indicate that the epitope tags at these specific sites did not fold correctly or were not adequately exposed to be recognized by their respective antibodies. The specificity of the HA and FLAG antibodies to their respective epitopes was evident through the absence of an immunoreactive band in the lanes loaded with native hASBT (Figs. 2 A.III & C.III.). The positive control for whole cell lysate, anti-calnexin, was abundantly expressed among all mutants with a distinct band at approximately 90 kDa (Figs. 2A.I. and C.I.).
Fig. 2.
Western blot analysis of whole cell lysate and cell surface biotinylation preparations of native hASBT and epitope constructs. COS-1 cells were transfected with native hASBT (WT) and the HA and FLAG–tagged epitope mutants. 48-72 hours post transfection, the cells were processed for immunoblotting. Blots of whole cell lysates were incubated with the anti-hASBT (A.II and C.II), the anti-HA (A.III) or the anti-FLAG (C.III) antibodies, respectively. Biotinylated proteins were prepared as described in Methods for both HA (B.III) and FLAG (D.III) constructs and these were similarly immunoblotted using anti-rabbit hASBT antibody. The positive controls calnexin (90 kDa) (A.I and C.I) and α-integrin (150 kDa) (B.I and D.I) were used for whole cell lysates and biotinylated fractions, respectively. The marker is shown in the left lane of the individual blots. Absence of calnexin in the biotinylated protein preparation is shown in B.II. and D.II for HA and FLAG constructs, respectively. Calnexin was detected for the WT whole cell lysate preparation that was run on the same gel and serves as a positive control. β, represents the empty vector pCMVβ and serves as a negative control.
Native hASBT protein and mutant constructs were consistently expressed at the cell surface (Figs. 2B.III and 2D.III), with the exceptions of HA mutants IX and XI. However, for HA mutant IX, the expression of its internal control is also appreciably reduced and thus the reduction in ASBT expression may be attributed to low cell count. These mutants were well detected upon immunofluorescence and confocal microscopy analysis, which further supports the strength of the techniques used here. Alpha-integrin, a 150 kDa plasma membrane protein was used as a positive control (Figs. 2B.I and 2.D.I). The accuracy of the biotinylated protein samples was further supported when calnexin could not be detected in these fractions (Figs. 2B.II and 2D.II), whereas this abundant protein was consistently expressed in whole cell lysate controls. Overall, epitope size and charge did not affect protein expression, as evidenced by the fact that all mutants were detected by the anti-ASBT antibody in whole cell lysates as well as biotinylated samples.
Functional Activity of Insertion Mutants
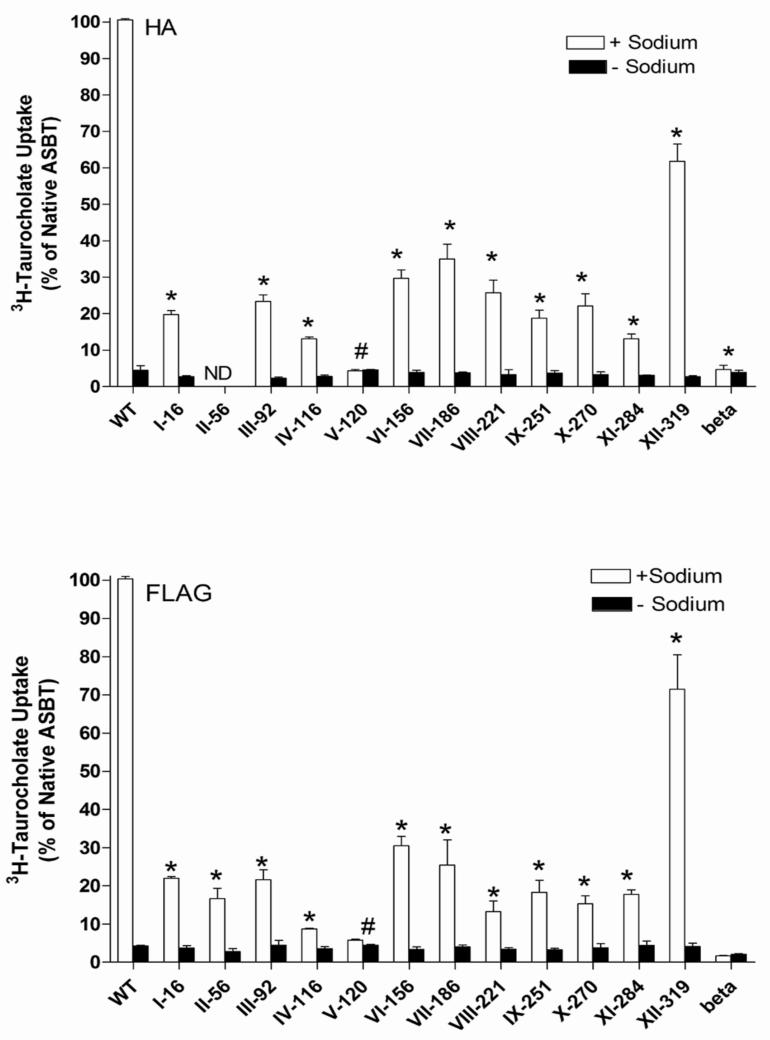
Even small sequence changes near membrane-spanning domains can alter membrane topology. The effect of epitope insertions on hASBT function was therefore tested by incubating COS-1 cells transfected with the various mutant constructs with 3H-TCA (5.0 μM). Since hASBT is a Na+-dependent co-transporter, control studies in the absence of sodium were performed to determine specificity (Figs. 3A and B). Although loss of activity does not necessarily imply a changed topology, an active transporter strongly indicates intact membrane topology. TCA uptake of HA and FLAG constructs V-120 was not significantly different from that of the empty vector pCMVβ, suggesting that incorporation of epitope tags at this position rendered the transporter inactive. All other epitope constructs were functionally active, although their ability to translocate 3H-TCA was reduced to approximately 10-50% of native hASBT. Importantly, control experiments in the absence of sodium ion indicate that all constructs, except V-120, displayed active transport (Figs. 3.A and 3.B). In general, the insertion of the FLAG epitope had a more adverse effect on hASBT function compared to the HA epitope and this could be attributed to the highly charged nature of the FLAG epitope in contrast to the more neutral HA tag. The insertion of the HA and FLAG epitopes at position 319 resulted only in a 20% decrease in uptake activity (Figs. 2A and B). This suggests that the C terminal domain of hASBT may not play a critical role in the substrate translocation process.
Fig. 3.
Relative rate of 3H-taurocholate uptake into COS-1 cells transiently transfected with native hASBT (WT), HA (Panel A) and FLAG (Panel B) epitope constructs. Taurocholate uptake was measured at a concentration of 5.0 μM (0.2 Ci/mmol) for 12 min at 37 °C in the presence (white bars) and absence (black bars) of 137 mM Na+. Beta represents 3H-TCA uptake in cells transfected with empty pCMVβ vector and serves as a negative control. Data are represented as a percentage of native hASBT uptake activity and each bar is the mean ± S.D. of three separate experiments. *significantly different from control (WT) at p<0.05; #loss of function mutant; ND: not determined.
Membrane Orientation of HA and FLAG Epitope Tags Correspond with a 7TM Model
The membrane polarity of the two epitope tags was determined by immunofluoresence and confocal laser scanning microscopy. An indirect immunofluoresence signal was acquired on cells transfected with the HA/FLAG epitopes under native (non-permeabilized) conditions to assess the extracellular orientation of the epitope tags, or permeabilized (saponin-treated) conditions to establish their potential intracellular localization (Figs. 4 and 5). No cell-associated fluorescence was detected in intact, nontransfected cells (control) or in cells expressing native hASBT protein (nontagged; data not shown).
Fig. 4.
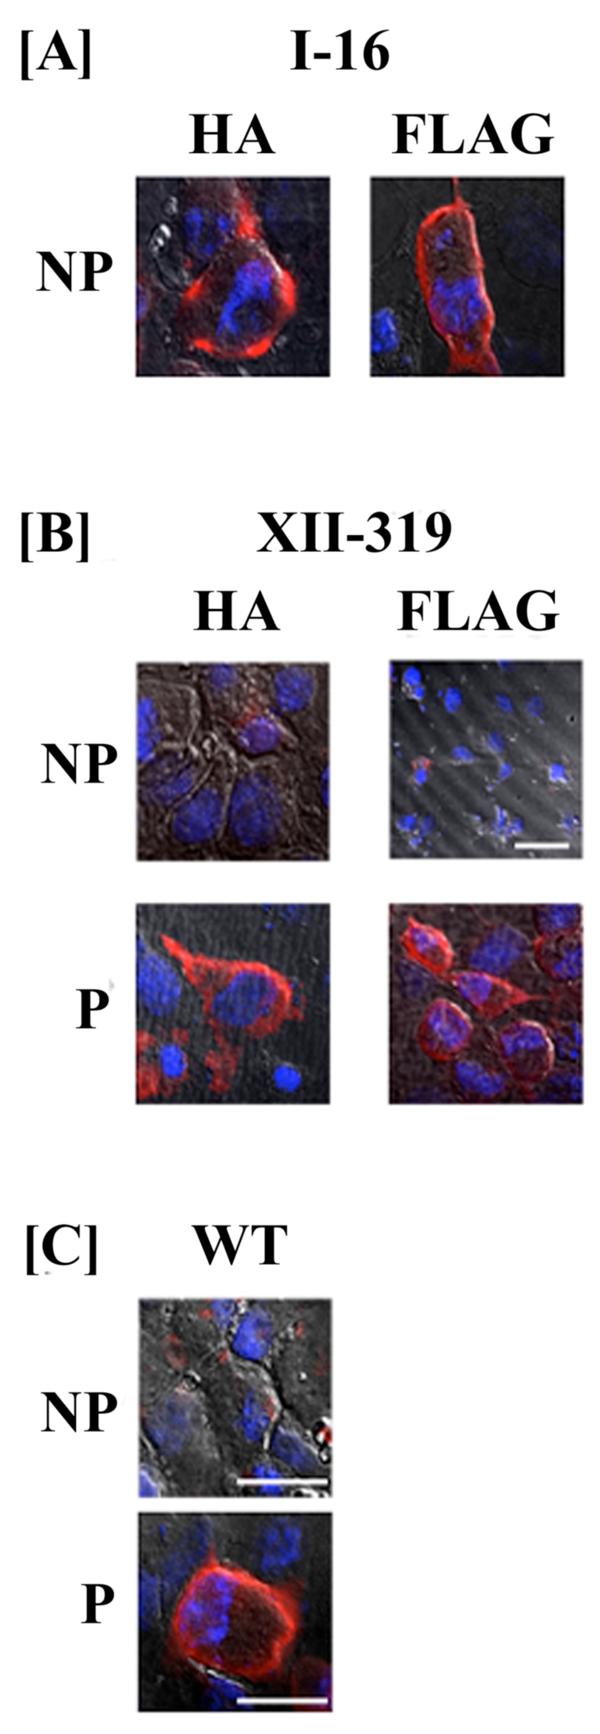
Orientation of the N- and C-terminal domains of hASBT determined by immunofluorescence and confocal microscopy. A. The orientation of the N-terminus was assessed in COS-1 cells transfected with HA and FLAG construct I-16 in native (nonpermeabilized) conditions. B. Localization of HA- and FLAG-tagged epitope construct XII-319 under permeabilizing (P) and nonpermeabilizing (NP) conditions. C. COS-1 cells were transfected with native hASBT (WT) and labeled with anti-hASBT antibody directed against the last 13 amino acids of hASBT (Ser335-Lys348) in the absence (NP) and presence (P) of saponin. Cells were processed as described in “Experimental Procedures”. The HA and the FLAG epitope tag orientation was assessed using the anti-HA 12CA5 mAb and anti-FLAG mAb, respectively. The secondary antibody was an Alexa Fluor 546 anti-mouse IgG for the FLAG and HA mutants and an Alexa Fluor 546 anti-rabbit IgG for native hASBT. Expression of native and mutant constructs is confirmed by a red fluorescent signal. All images were captured under a 60× oil objective with DAPI-stained nuclei (blue) and differential interference contrast (DIC) overlay at 512×512 and 1024×1024 pixel resolution. Bars represent 20 μm.
Fig. 5.
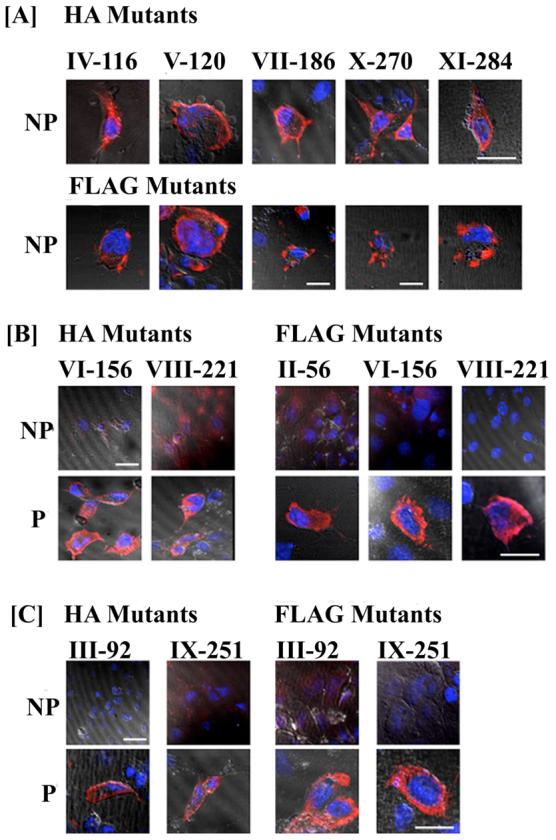
Detection of HA and FLAG tagged epitope mutants by immunofluorescence microscopy. COS-1 cells were transiently transfected with the HA and FLAG tagged mutants. 48-72 hours post transfection the cells were processed for immunofluorescence in nonpermeabilized (NP); and permeabilized (P) conditions. The tagged mutants have been categorized according to their apparent extracellular (A), intracellular (B) and transmembrane domain (C) localizations. The orientation of the epitope constructs was evaluated using mouse anti-HA and anti-FLAG specific antibodies. Expression of the mutant protein was detected by fluorescent signal (red) using the secondary antibody AlexaFluor 546 anti-mouse IgG. All images were captured under a 60× oil objective with DAPI-stained nuclei (blue) and DIC overlay at 512×512 and 1024×1024 pixel resolution. Bars represent 20 μm.
The reportedly cytosolic orientation of the C-terminal region (1, 3, 17), was confirmed by transfecting native hASBT into COS-1 cells and immunostaining with a custom anti-ASBT antibody directed against the final 13 amino acids (Ser335-Lys348) of hASBT. Only after treatment with saponin, a distinct red fluorescence was observed along the periphery of the cell (Fig. 4C). A similar staining pattern only in the presence of saponin was detected for FLAG and HA mutants XII-319, thus confirming the cytosolic location of the C-terminus (Fig. 4B). The exofacial localization of the N-terminus was further confirmed by a strong fluorescent signal detected by the anti-FLAG and anti-HA antibodies (Fig. 4A) in non-permeabilized cells transfected with mutant I-16.
The orientation of the various EL and IL domains (Fig. 1) was assessed by strategically inserting epitope tags in these regions. In cells expressing the HA and FLAG epitope mutants IV-116, V-120, VII-186, X-270 and XI-284, cell surface fluorescence was detected in the absence (Fig. 5A) and presence of saponin (data not shown), indicating their extracellular orientation. In cells transfected with constructs II-56, VI-156 and VIII-221, the epitope was accessible to the anti-HA and FLAG antibodies only upon saponin treatment, indicating their intracellular localization (Fig. 5B). These epitope orientations are consistent with the predicted 7 TM model for hASBT and rejects a 9 TM orientation for these loops.
To further differentiate between the 7 and 9TM models, two epitope tags were engineered within putative TM domains. According to a 7 TM topology, mutant III-92 localizes within TMD2 and mutant IX-251 in TMD6 (Fig. 1A). In contrast, a 9TM model, would predict position 92 to be located on EL1 and 251 on IL4 (Fig. 1B). Fluorescence signal was detected only under permeabilized conditions for both mutants and epitopes (Fig. 5C). Thus, the epitope tags for mutant III-92 are not localized on the cell surface, thereby further reducing the possibility of a 9 TM topology, which places III-92 on EL1. Mutant IX-251 was only detected in the presence of saponin; however, the exact localization of this site (i.e. TMD6 or IL3) cannot be determined definitively with this technique.
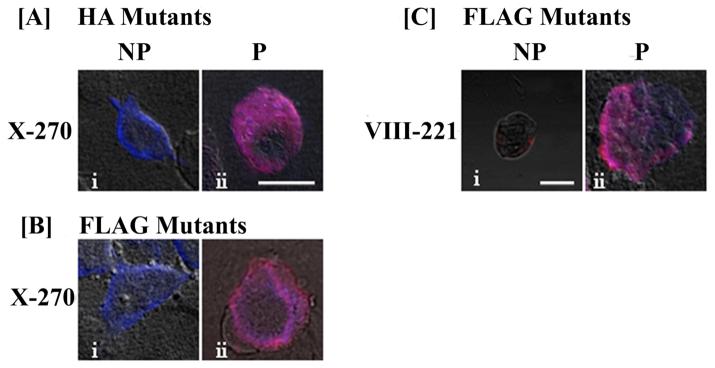
The capability to accurately discern membrane localization was assessed in COS-1 cells individually transfected with FLAG and HA mutant X-270. These cells were simultaneously labeled with the respective anti-epitope as well as the anti-hASBT antibody. As expected, under non-permeabilized conditions only the HA/FLAG mutant X-270 epitope was accessible to its antibody (blue fluorescence; Figs. 6 A-i & B-i). However, in permeabilized cells, both the epitopes and the C-terminus of hASBT were accessible to their respective antibodies as evidenced by distinct overlapping (pink) fluorescence (Fig. 6 A-ii, B-ii &C-ii). These results specifically validate the extracellular orientation of X-270. Similarly, the intracellular orientation of VIII-221 was evidenced by a lack of immunostaining in the absence of saponin and a pink fluorescence signal in the presence of saponin (Fig. 6.C). The extracellular orientation of X270 and the intracellular localization of VIII-221 further supports a 7TM topology.
Fig. 6.
Dual labeling of HA and FLAG tagged mutants in COS-1 cells. Cells transfected with mutant X-270 (A, B) and VIII-221 (C) were labeled with mouse anti-HA or anti-FLAG specific antibodies (panel i) under non-permeabilizing conditions and permeabilizing conditions (panel ii). The expression of the FLAG- or HA-epitope constructs was detected using a secondary anti-mouse antibody, AlexaFluor 405 (blue fluorescence) and the expression of hASBT was detected using the secondary anti-rabbit antibody, AlexaFluor 546 (red fluorescence). Under permeabilized conditions, when both signals were detected, a merged pink fluorescence can be observed. All images were acquired under a 60× oil objective with DIC overlay at 1024×1024 pixel resolution, except for C-I, which was imaged at 512×512 resolution. Bars represent 20 μm.
Epitope Mutants Express at the Apical Cell Surface of an Epithelial Cell Line, MDCK-II
As COS-1 cells are non-polarized fibroblast cells, we aimed to determine the effect of epitope insertion on protein trafficking and localization (apical vs. basolateral) to the plasma membrane in a polarized, epithelial MDCK-II cell line. Cells were transfected with representative FLAG and HA mutants for both intra- and extracellular sites and processed 48-72 hours post-transfection. A distinct peri-apical localization was observed for epitope tagged mutants IV-116 and X-270 under non-permeabilizing conditions (Fig. 7A), further confirming the exofacial orientation of these mutants. Similar apical localization was observed for native hASBT and mutant VI-156 only under permeabilizing conditions (Fig. 7B), providing additional evidence for the cytosolic localization of this epitope. Native hASBT as well as epitope-tagged hASBT mutants were sorted to the apical membrane surface, as evidenced by the absence of a basolateral signal. These data reveal that the insertion of epitope tags does not interfere with protein trafficking to the apical plasma membrane, at least for the mutants tested here.
Discussion
Hydropathy analysis has suggested several possible topologies for hASBT, with the location and number of transmembrane segments varying between 7 and 9 (11). Although computed hydrophobicity assignments can offer valuable insight, experimental data are essential to assign TMDs. In the case of hASBT, however, two opposing hypotheses have emerged based on empirical evidence; membrane insertion scanning technology has suggested a 9TM topology (17), whereas N-glycosylation analysis indicated 7 membrane-spanning regions (11). Since a single topology scanning technique rarely provides unequivocal results, the data presented here were designed to close the current controversy pertaining to the membrane topology of hASBT. Thus, we have used dual epitope tag insertion scanning mutagenesis to systematically examine the topology of hASBT. Our functional data together with immunofluorescence and confocal microscopy studies provide strong evidence in support of a 7TM model (Fig. 1).
The present data are in agreement with the reportedly (1, 3, 17) extracellular localization of the N-terminus and cytosolic presence of the C-terminal domain (Fig. 4). This essentially limits the possible topologies of hASBT to 7 or 9 TMDs. Hence, the primary regions of controversy are located between residues 69-120, which is suitably hydrophobic to encompass one or two TMDs, and the region between 255-280 that was speculated to constitute a TMD (11, 17). However, previous studies by Hallén and colleagues (17) demonstrate that these moderately hydrophobic segments do not readily integrate into the membrane and can only span the lipid bilayer with the aid of flanking topogenic regions. Consequently, a major emphasis was placed on an effective, yet impartial, comparison of the two divergent transmembrane topologies (Fig. 1) by strategically engineering epitope tags into discrete regions of hASBT.
Amino acid insertions generally bear the risk of changing the topogenic activity of neighboring membrane-spanning domains. Hence, two distinctly different epitope tags, HA and FLAG, were selected to determine if variations in charge and size could result in altered tag orientation within the protein sequence. In essence, the charged nature of the FLAG epitope could create false positive results when inserted into the hydrophobic milieu of TMDs by forcing the adjacent regions into a hydrophilic environment. Yet, mutually consistent data with both epitope tags indicated a negligible impact of tag characteristics. In fact, immunoblotting data (Fig. 2) and confocal microscopy results (Figs. 4 and 5) confirmed that protein stability and trafficking to the plasma membrane remained largely unaffected for both epitope constructs.
The modified proteins were expressed in mammalian cells so that any deleterious effect of epitope insertion on hASBT function could be monitored, and the accessibility of the epitopes to anti-HA and anti-FLAG were determined in intact and permeabilized cells to establish their intra- or extracellular localization. All constructs transported the taurocholate tracer via a sodium-dependent mechanism, albeit at a lower flux rate than native hASBT. This may be partially explained by the fact that large epitope insertions such as HA and FLAG may alter protein targeting and function. However, any gross distortion of membrane topology would presumably abrogate transporter function. Yet, most constructs display an active, sodium-dependent uptake mechanism. For example, epitope insertions at position V-120 abrogated transport activity (Fig. 3), despite its abundant membrane expression (Fig. 2). We speculate that this mutant lies in a highly charged pocket (i.e. D120, D122 and D124) that may play a critical role in sodium or substrate translocation. In fact, mutations D120A and D122A completely abrogate bile acid translocation (unpublished data).
According to a 7TM model, extracellular loops 1 and 3 are sufficiently large to form domains that can dynamically enter and exit the membrane, a feature that has been demonstrated previously for the glutamate transporter GLT-1 (18, 26, 27) and the Na+/Ca2+-exchanger NXC1 (28). Hence, both loops were tagged at multiple positions (EL1: IV, V; EL3: X, XI). Due to their charged nature, the segments containing these constructs may stochastically partition between the extracellular and intracellular milieu upon translation. Hence, one would expect a decrease in immunofluorescence signal in native cells due to limited availability of the epitope and this signal may be restored to its anticipated intensity upon treatment with saponin. The relatively comparable fluorescence intensity between native and permeabilized cells led us to speculate that hASBT does not exhibit re-entrant loop behavior at EL1 or EL3; however, observing such a dynamic motion may be beyond the scope of the current technique and future studies are warranted to investigate this possibility.
Dual labeling immunofluorescence studies on constructs VIII-221 and X-270 incubated with both anti-epitope and anti-hASBT antibodies provided additional evidence for the cytosolic and exofacial orientation of IL3 and EL3, respectively (Fig. 6). Combined, these data provide clear evidence that the moderately hydrophobic region between residues 255-280 is, in fact, part of an extramembranous protein domain of hASBT. These data are consistent with the absence of signal anchor and stop transfer properties that would allow membrane insertion of this sequence (17). Additionally, this explains the inability of this region, assigned TMD8 in the 9TM model (Fig. 1), to effectively span the membrane. Interestingly, a recent study on NTCP by Mareninova and co-workers (21) using a trypsin digestion technique found that TMD7 and TMD8 of the hepatic homologue were exposed on the exoplasmic surface of the protein. These data are in agreement with the findings presented here.
In conclusion, our study shows that hASBT predominantly conforms to a 7 TM topology (11, 29, 30) and refutes the previously proposed 9 TM model for this transport protein. This lends further support to the previously generated three-dimensional model for hASBT (11) that may now serve as a credible scaffold for designing site-directed mutagenesis experiments and aid in further mechanistic interpretation of hASBT function. In addition, the current epitope insertion approach may have identified functionally significant regions for future site-directed mutagenesis studies. Identification and verification of the putative extracellular and intracellular regions of this transporter will be essential in guiding future work aimed at elucidating and characterizing the translocation pathway for sodium and bile acids. Thus, the present work provides a topological framework towards understanding the structure and function of hASBT transport.
For Table of Contents Use Only
Acknowledgements
The authors would like to thank Amy B. Foraker for expert technical assistance with laser scanning confocal microscopy and image deconvolution.
This research was supported by a grant from the Department of Health & Human Services, National Institutes of Health, DK061425 (to P.W.S.)
Abbreviations
- EL
extracellular loop
- HA
Hemagglutinin
- hASBT
human Apical sodium-dependent Bile acid transporter
- IL
intracellular loop
- INPCRM
Inverted PCR mutagenesis
- NP
non-permeabilized
- P
permeabilized
- TCA
taurocholic acid
- TM
transmembrane
- TMD
transmembrane domain
References
- 1.Wong MH, Oelkers P, Craddock AL, Dawson PA. Expression cloning and characterization of the hamster ileal sodium-dependent bile acid transporter. J Biol Chem. 1994;269:1340–7. [PubMed] [Google Scholar]
- 2.Wong MH, Oelkers P, Dawson PA. Identification of a mutation in the ileal sodium-dependent bile acid transporter gene that abolishes transport activity. J Biol Chem. 1995;270:27228–34. doi: 10.1074/jbc.270.45.27228. [DOI] [PubMed] [Google Scholar]
- 3.Shneider BL, Dawson PA, Christie DM, Hardikar W, Wong MH, Suchy FJ. Cloning and molecular characterization of the ontogeny of a rat ileal sodium-dependent bile acid transporter. J Clin Invest. 1995;95:745–54. doi: 10.1172/JCI117722. [DOI] [PMC free article] [PubMed] [Google Scholar]
- 4.Shneider BL. Intestinal Bile Acid Transport: Biology, Physiology and Pathophysiology. J Pediatr Gastroenterol Nutr. 2001;32:407–417. doi: 10.1097/00005176-200104000-00002. [DOI] [PubMed] [Google Scholar]
- 5.Alrefai WA, Sarwar Z, Tyagi S, Saksena S, Dudeja PK, Gill RK. Cholesterol modulates human intestinal sodium-dependent bile acid transporter. Am J Physiol Gastrointest Liver Physiol. 2005;288:G978–85. doi: 10.1152/ajpgi.00379.2004. [DOI] [PubMed] [Google Scholar]
- 6.Li H, Xu G, Shang Q, Pan L, Shefer S, Batta AK, Bollineni J, Tint GS, Keller BT, Salen G. Inhibition of ileal bile acid transport lowers plasma cholesterol levels by inactivating hepatic farnesoid X receptor and stimulating cholesterol 7 alpha-hydroxylase. Metabolism. 2004;53:927–932. doi: 10.1016/j.metabol.2004.01.017. [DOI] [PubMed] [Google Scholar]
- 7.Huff MW, Telford DE, Edwards JY, Burnett JR, Barrett PH, Rapp SR, Napawan N, Keller BT. Inhibition of the apical sodium-dependent bile acid transporter reduces LDL cholesterol and apoB by enhanced plasma clearance of LDL apoB. Arterioscler Thromb Vasc Biol. 2002;22:1884–91. doi: 10.1161/01.atv.0000035390.87288.26. [DOI] [PubMed] [Google Scholar]
- 8.Kramer W, Nicol SB, Girbig F, Gutjahr U, Kowalewski S, Fasold H. Characterization and chemical modification of the Na(+)-dependent bile-acid transport system in brush-border membrane vesicles from rabbit ileum. Biochim Biophys Acta. 1992;1111:93–102. doi: 10.1016/0005-2736(92)90278-t. [DOI] [PubMed] [Google Scholar]
- 9.Sun AQ, Salkar R, Sachchidanand, Xu S, Zeng L, Zhou MM, Suchy FJ. A 14-amino acid sequence with a beta-turn structure is required for apical membrane sorting of the rat ileal bile acid transporter. J Biol Chem. 2003;278:4000–4009. doi: 10.1074/jbc.M207163200. [DOI] [PubMed] [Google Scholar]
- 10.Hallen S, Fryklund J, Sachs G. Inhibition of the Human Sodium/ Bile Acid Cotransporters by Side Specific Methanethiosulfonate Sulphydryl Reagents: Substrate Controlled Accessibility of Se of Activation. Biochemistry. 2000;39:6743–6570. doi: 10.1021/bi000577t. [DOI] [PubMed] [Google Scholar]
- 11.Zhang EY, Phelps MA, Banerjee A, Khantwal CM, Chang C, Helsper F, Swaan PW. Topology scanning and putative three-dimensional structure of the extracellular binding domains of the apical sodium-dependent bile acid transporter (SLC10A2) Biochemistry. 2004;43:11380–92. doi: 10.1021/bi049270a. [DOI] [PubMed] [Google Scholar]
- 12.Banerjee A, Ray A, Chang C, Swaan PW. Site-directed mutagenesis and use of bile acid-MTS conjugates to probe the role of cysteines in the human apical sodium-dependent bile acid transporter (SLC10A2) Biochemistry. 2005;44:8908–17. doi: 10.1021/bi050553s. [DOI] [PubMed] [Google Scholar]
- 13.Kramer W, Girbig F, Glombik H, Corsiero D, Stengelin S, Weyland C. Identification of a Ligand Binding Site in the Na+/Bile Acid Cotransporting Protein from Rabbit. J Biol Chem. 2001;276:36020–36027. doi: 10.1074/jbc.M104665200. [DOI] [PubMed] [Google Scholar]
- 14.Baringhaus KH, Matter H, Stengelin S, Kramer W. Substrate specificity of the ileal and the hepatic Na(+)/bile acid cotransporters of the rabbit. II. A reliable 3D QSAR pharmacophore model for the ileal Na(+)/bile acid cotransporter. J Lipid Res. 1999;40:2158–68. [PubMed] [Google Scholar]
- 15.Swaan PW, Koops BC, Moret EE, Tukker JJ. Mapping the binding site of the small intestinal peptide carrier (PepT1) using comparative molecular field analysis. Receptors Channels. 1998;6:189–200. [PubMed] [Google Scholar]
- 16.Hagenbuch B, Meier PJ. Molecular cloning, chromosomal localization, and functional characterization of a human liver Na+/bile acid cotransporter. J Clin Invest. 1994;93:1326–31. doi: 10.1172/JCI117091. [DOI] [PMC free article] [PubMed] [Google Scholar]
- 17.Hallen S, Branden M, Dawson PA, Sachs G. Membrane insertion scanning of the human ileal sodium/bile acid co-transporter. Biochemistry. 1999;38:11379–88. doi: 10.1021/bi990554i. [DOI] [PubMed] [Google Scholar]
- 18.Grunewald M, Menaker D, Kanner BI. Cysteine-scanning mutagenesis reveals a conformationally sensitive reentrant pore-loop in the glutamate transporter GLT-1. J Biol Chem. 2002;277:26074–80. doi: 10.1074/jbc.M202248200. [DOI] [PubMed] [Google Scholar]
- 19.Meuer H. Functional domains in the renal type IIa Na/P(i)-cotransporter. Kidney Int. 2002;62:375–382. doi: 10.1046/j.1523-1755.2002.00461.x. [DOI] [PubMed] [Google Scholar]
- 20.Ding PZ. Loop X/XI, the largest cytoplasmic loop in the membrane-bound melibiose carrier of Escherichia coli, is a functional re-entrant loop. Biochim Biophys Acta. 2004;1660:106–117. doi: 10.1016/j.bbamem.2003.11.005. [DOI] [PubMed] [Google Scholar]
- 21.Mareninova O, Shin JM, Vagin O, Turdikulova S, Hallen S, Sachs G. Topography of the membrane domain of the liver na(+)-dependent bile Acid transporter. Biochemistry. 2005;44:13702–12. doi: 10.1021/bi051291x. [DOI] [PubMed] [Google Scholar]
- 22.Gama L, Breitwieser GE. Genration of Epitope- Tagged Proteins by Inverse Polymerase Chain Reaction Mutagenesis. In Vitro Mutagenesis Protocols: Methods in Molecular Biology. 2001;182:77–83. doi: 10.1385/1-59259-194-9:077. [DOI] [PubMed] [Google Scholar]
- 23.Visiers I, Weinstein H, Rudnick G, Stephan MM. A second site rescue mutation partially restores functional expression to the serotonin transporter mutant V382P. Biochemistry. 2003;42:6784–93. doi: 10.1021/bi0273415. [DOI] [PubMed] [Google Scholar]
- 24.Covitz KM, Amidon GL, Sadee W. Membrane topology of the human dipeptide transporter, hPEPT1, determined by epitope insertions. Biochemistry. 1998;37:15214–21. doi: 10.1021/bi981128k. [DOI] [PubMed] [Google Scholar]
- 25.Vannier B, Zhu X, Brown D, Birnbaumer L. The Membrane topology of Human Transient Receptor Potential 3 as Inferred from Glycosylation-scanning Mutagenesis and Epitope Immunocytochemistry. J Biol Chem. 1998;273:8675–8679. doi: 10.1074/jbc.273.15.8675. [DOI] [PubMed] [Google Scholar]
- 26.Brocke L, Bendahan A, Grunewald M, Kanner BI. Proximity of two oppositely oriented reentrant loops in the glutamate transporter GLT-1 identified by paired cysteine mutagenesis. J Biol Chem. 2002;277:3985–92. doi: 10.1074/jbc.M107735200. [DOI] [PubMed] [Google Scholar]
- 27.Grunewald M, Kanner BI. The accessibility of a novel reentrant loop of the glutamate transporter GLT-1 is restricted by its substrate. J Biol Chem. 2000;275:9684–9. doi: 10.1074/jbc.275.13.9684. [DOI] [PubMed] [Google Scholar]
- 28.Iwamoto T, Uehara A, Imanaga I, Shigekawa M. The Na+/Ca2+ exchanger NCX1 has oppositely oriented reentrant loop domains that contain conserved aspartic acids whose mutation alters its apparent Ca2+ affinity. J Biol Chem. 2000;275:38571–80. doi: 10.1074/jbc.M003788200. [DOI] [PubMed] [Google Scholar]
- 29.Dawson PA, Oelkers P. Bile acid transporters. Curr Opin Lipidol. 1995;6:109–14. doi: 10.1097/00041433-199504000-00009. [DOI] [PubMed] [Google Scholar]
- 30.Oelkers P, Kirby LC, Heubi JE, Dawson PA. Primary bile acid malabsorption caused by mutations in the ileal sodium-dependent bile acid transporter gene (SLC10A2) J Clin Invest. 1997;99:1880–7. doi: 10.1172/JCI119355. [DOI] [PMC free article] [PubMed] [Google Scholar]


