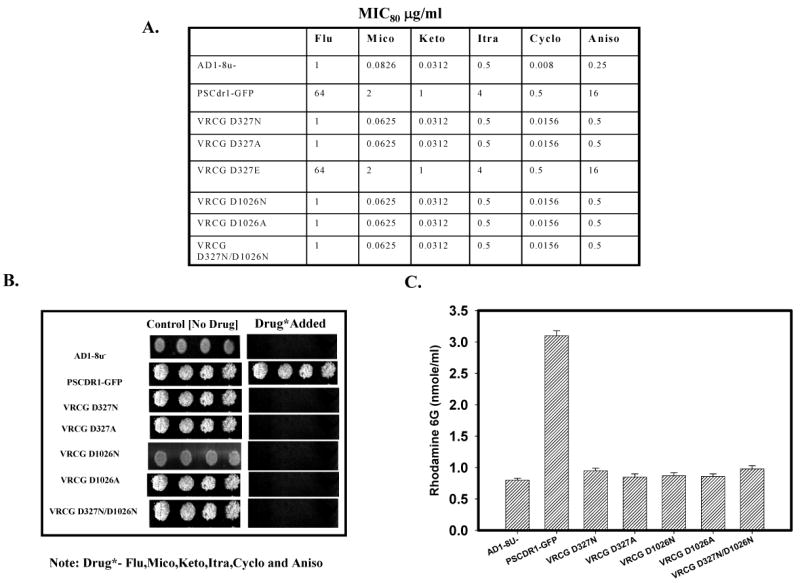
Figure 3.

(A) MIC80 values of cells expressing Cdr1p and its mutant variants in presence of different drugs tested: Drug susceptibility (MIC80) of S. cerevisiae cells expressing wild type and mutant variants of Cdr1p, MICs were determined by microdilution method as described previously ‘(26). (B) Drug resistance profiles of the wild type and mutants determined by spot assay. It was done as per the protocol described earlier (26). The concentration of the drugs used : fluconazole (5 μg/ml), anisomycin (1.0 μg/ml), miconazole (0.5 μg/ml), ketoconazole, itraconazole and cycloheximide (0.15 μg/ml). (C) Rhodamine 6G efflux by the wild type Cdr1p and its mutant variant proteins expressing cells: The R6G efflux was measured as described previously (28) The values are mean ± SD (error bars) for three independent experiments.
