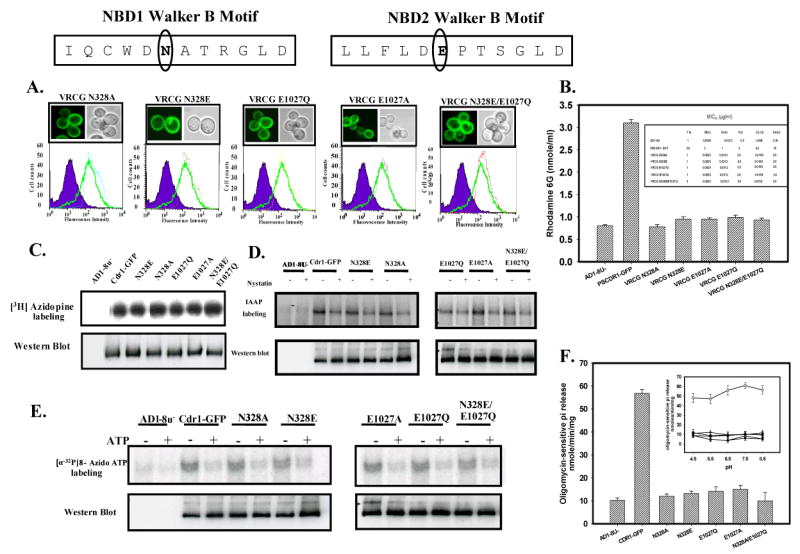
Figure 6.

(A) Membrane localization and expression profile of wild type Cdr1p and mutant variants: Boxed panel at the top shows the sequence of Walker B and extended Walker B motifs of N-terminal and C-terminal NBDs of Cdr1p. Fluorescence imaging (upper panel) and Flow cytometry (lower panel) of S. cerevisiae expressing Cdr1p and its mutant variants has been done as mentioned in legends of Fig. 2B. (B) Rhodamine 6G efflux by the wild type Cdr1p and its mutant variants expressing cells: Inset shows the table of MIC80 values of wild type Cdr1p and its mutant variants expressing cells for the drug tested. (C) Photoaffinity labeling of wild type Cdr1p and its mutant variants with [3H]-azidopine: The PM fraction (30 μg) of cells expressing the wild type Cdr1p and its mutant variants were photoaffinity labeled with 0.5 μM [3H]-azidopine as mentioned in legends of Fig. 4A. Loading pattern is AD1-8u- (control; lane 1), Cdr1-GFP (lane 2), Cdr1p N328E (lane 3), Cdr1p N328A (lane 4), Cdr1p E1027Q (lane 5), Cdr1p E1027A (lane 6) and Cdr1p N328E/E1027Q (lane 7). (D) Photoaffinity labeling of wild type Cdr1p and its mutant variants with [125I]-IAAP: The PM fraction (30 μg) of cells expressing the wild type Cdr1p and its mutant variants were incubated with 7.5 nM [125I]-IAAP (2200 Ci/mmol) in absence or presence of 2 μM Nystatin (+ lane) as described in ‘Experimental Procedures’. (E) Photoaffinity labeling of wild type Cdr1p and its mutant variants with [α-32P] 8-azido ATP: The PM fraction (30 μg) of cells expressing the wild type Cdr1p and its mutant variants were incubated with 10 μM [α-32P] 8-azido ATP 7.5 μCi/nmole at 4°C and competed with 10 mM cold ATP (+ ATP lane) as described in ‘Experimental Procedures’. In the panel C, D and E, lower panel shows the immunoblotting using anti-GFP antibody to ensure an equal loading of wild type Cdr1p and its mutant variants in all the lanes.
(F) Comparison of ATPase activity of Cdr1p with its mutant variants: ATPase activity of PM fraction of cells expressing the wild type Cdr1p and its mutant variants were assayed as described under ‘Experimental Procedures’; the values represent the average ± standard deviation of three independent experiments. Inset shows ATPase activity of Cdr1p and its mutant variants at different pH. Scattered plot represents AD1-8u- (●) PSCdr1-GFP (○), VRCG N328E (□), VRCG N328A (◆), VRCG E1027Q (▲), VRCG E1027A (Δ) and VRCG N328E/E1027Q (♦).
