Abstract
The excited states of dinucleoside phosphates (dGpdG, dApdA, dApdT, TpdA and dGpdT) in their cationic radical states were studied using time-dependent density functional theory (TD-DFT). The ground state geometries of all the dinucleoside phosphate cation radicals considered, in their base stacked conformation, were optimized using B3LYP/6-31G(d) method. Further, to take into account the effect of the aqueous environment surrounding the dinucleoside phosphates, the polarized continuum model (PCM) was considered and the excitation energies were computed using the TD-B3LYP/6-31G(d) method. From this study, we found that the first transition, in all the dinucleoside molecules involves hole transfer from base to base. DG•+pdG and dApdA•+ were found to have substantially lower first transition energies than others with two diffent DNA bases. Higher energy transitions involve base to sugar as well as base to base hole transfer. The calculated TD-B3LYP/6-31G(d) transition energies are in good agreement with previous calculations using CASSCF/CAS-PT2 level of theory. This TD-DFT work supports the experimental findings that sugar radicals formed upon photo-excitation of G•+ in γ-irradiated DNA and suggests an explanation for the wavelength dependence found.
Keywords: Time-dependent density functional theory (TD,DFT); excited state; one electron oxidized dinucleoside phosphates; sugar radical; dinucleoside phosphate radical cations; hole transfer/localization
Introduction
Carbon centered neutral sugar radicals in the DNA deoxyribose backbone are known to lead to single strand breaks in DNA. These lesions are among the most lethal of DNA damages. It was recently reported that irradiation of DNA by high energy Argon ion-beam1 (high linear energy transfer, LET, radiation) produced a far greater yield of sugar radicals than was found by γ-irradiation (a low LET radiation). Since these sugar radicals were formed predominantly along the ion track, where excitations and ionizations are in proximity, it was proposed that excited state cation radicals could be direct precursors of the neutral sugar radicals.2,3
Several studies were performed to test this hypothesis using near UV-visible photo-excitation of the guanine cation radical (G•+) in DNA and in model systems of deoxyribonucleosides and deoxyribonuleotides. Direct conversion of G•+ to deoxyribose sugar radicals was found in every case with high yields (50% in DNA and 80–100% in model systems).1,4,5 In model systems the formation of specific C1′•, C3′• and C5′• sugar radicals were found to be structure dependent. For example, phosphate groups at 3′ or 5′ were found to deactivate that site toward sugar radical formation and as a consequence only C1′• was found in DNA, whereas C1′•, C3′• and C5′•, were all found in deoxyguanosine (dG).1,5 The action spectrum in DNA showed light wavelengths of 310 to 480 nm were effective, but sugar radicals were not produced in DNA at wavelengths above 520 nm. For the model systems, all wavelengths from 310 to 700 nm were effective. Recently it was found that one electron oxidized adenine (A(-H)•) in deoxynucleosides and deoxynucleotides also is readily converted by visible light to sugar radicals, with C5′• radical being the most abundant.1 We note that while guanine cation radical (pKa = 4) was photoactive, its deprotonated radical, G(-H)•, was not. Adenine cation radical (pKa near 1) fully deprotonates from the exocyclic amine group forming A(-H)•, however, even in this deprotonated state it was still found to be photoactive with regard to sugar radical formation.
The mechanism of sugar radical formation proposed in our earlier work on these systems was that photoexcitation induces hole transfer from the DNA base one-electron-oxidized radical to the sugar ring and this is followed by rapid deprotonation at specific carbon sites on the sugar ring.1,4–6 To test this hypothesis, time-dependent density functional theory (TD-DFT) calculations were performed for both G•+ and A(-H)• in deoxyribonucleosides. It was found that excited states which were formed by light exposure in the near UV-visible range all originate from inner shell (core) molecular orbitals (MOs) and often involve hole transfer to the sugar ring. This confirms the first step in the proposed mechanism, i.e. excitation induced transfer of hole from the base to the sugar ring. These experimental and theoretical studies were extended to guanine cation radicals (G•+) in the dinucleoside phosphate, TpdG.6 Photo-excitation of G•+ in TpdG again results in high yields (ca. 85%) of deoxyribose sugar radicals at the C1′ and C3′ sites.6 TD-DFT calculations for this species were also in accord with the experimental results.
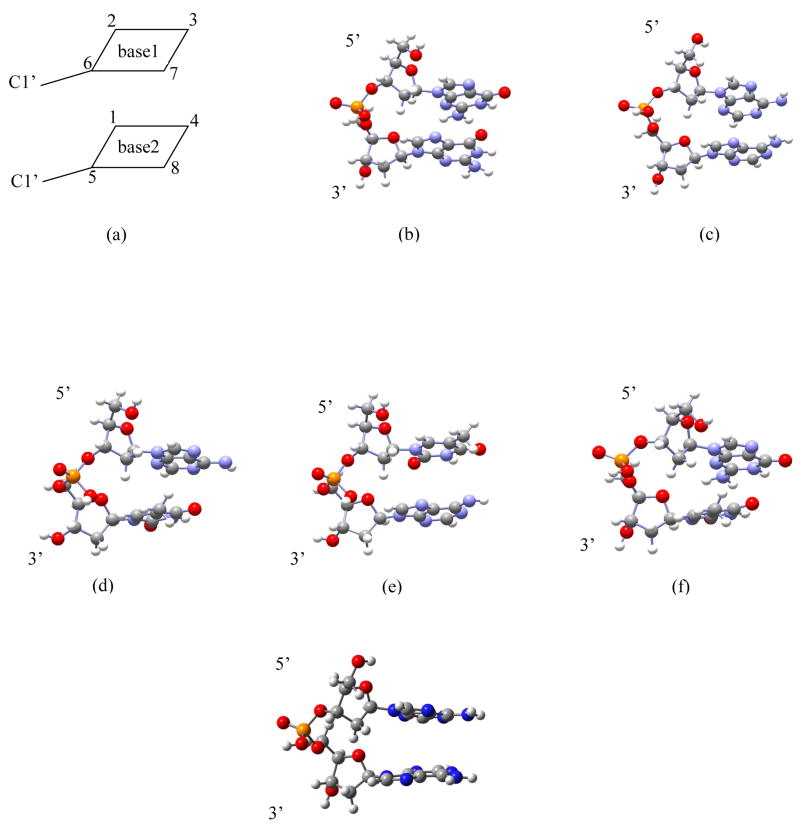
In this work we employed time-dependent density functional theory (TD-DFT) to study the excitations and the nature of the electronic transitions in a series of one electron oxidized dinucleoside phosphates, dG•+pdG, (dApdA)•+, dA(-H)•pdA, dA(-H)•pdT, TpdA(-H)• and dG•+pdT in a stacked conformation (see figure 1). We also discuss our previous results6 for TpdG•+. In other work, TD-DFT calculations have been found suitable to describe the nature of electronic excitations and transition energies in good agreement with experimental values.7–9 TD-DFT method has been found to be very appropriate for the study of low-lying valence excited states that are below the first ionization potential of the molecule, and is therefore an excellent choice for the investigation of radical cations.7 Using the TD-DFT method with different functionals in combination with 6-31G** basis set, Head-Gordon and co-workers7e studied up to eleven lowest electronic excitation energies of several polycyclic aromatic hydrocarbon radical cations and they found that the computed excitation energies are roughly within 0.3 eV of the experimental data. Recently, CAS-PT2 has been applied to study excitation induced base-to-base hole transfer10 in two DNA bases in stacked configuration, as in the work presented here. However, this earlier work10 did not include the sugar phosphate backbone which we find is a competing site for hole transfer.
Figure 1.
(a) constrained geometry optimization scheme. Unrestricted B3LYP/6-31G(d) optimized geometries of (b) dG•+pdG, (c) dA(-H)•pdA, (d) dA(-H)•pdT, (e) TpdA(-H)•, (f) dG•+pdT and (g) (dApdA)•+
Methods of Calculation
Initial starting geometries of all dinucleoside phosphates (dGpdG, dApdA, dApdT, TpdA and dGpdT), in their single stranded B-DNA conformation, were generated using the SPARTAN molecular modeling program.11 The anionic phosphate group was protonated to neutralize the system. Also, the 3′- and 5′- ends were terminated by OH groups. The ground state geometries of dG•+pdG, (dApdA)•+, dA(-H)•pdA, dA(-H)•pdT, TpdA(-H)•), and dG•+pdT were optimized in stacked geometry using density functional theory (DFT) using unrestricted B3LYP functional and 6-31G(d) basis set. The B3LYP density functional is a combination of Becke’s three parameter hybrid exchange functional12,13 and the Lee-Yang-Parr14 correlation functional. During geometry optimization, the interbase distance was constrained at ~3.4 Å to mimic the B-DNA conformation. This conformation was maintained using the concept of closed box geometry optimization criterion. In this criterion we assume a box enclosing the two base pairs whose upper and lower surfaces correspond to the approximate surface of the bases. Further more, we chose eight atoms which correspond to the corners of the box and constrained only the vertical distances between the atoms (1,2), (3,4), (5,6) and (7,8), the angles (1,2,3), (2,3,4), (5,6,7), (6,7,8) and dihedral angles (1,2,3,4) and (5,6,7,8) (see figure 1a). These constraints allowed the DNA base rings to relax but maintained the stacked orientation. Excited state calculations were carried out using time-dependent DFT (TD-DFT), B3LYP functional and the 6-31G(d) basis set. In recent years, the TD-DFT method has been found suitable to compute vertical transition energies of both gas phase and solvated molecules, with results that are comparable to experimental results.15–19 In this study, we calculated the transition energies of all the systems in aqueous media (ε = 78.4) using self-consistent reaction field (SCRF) calculations and the polarized continuum model (PCM). The transition energies in aqueous media were calculated using the gas phase optimized geometries. All the calculations were done using the Gaussian0320 suite of program and GaussView21 was used to plot the molecular orbitals.
Results and Discussion
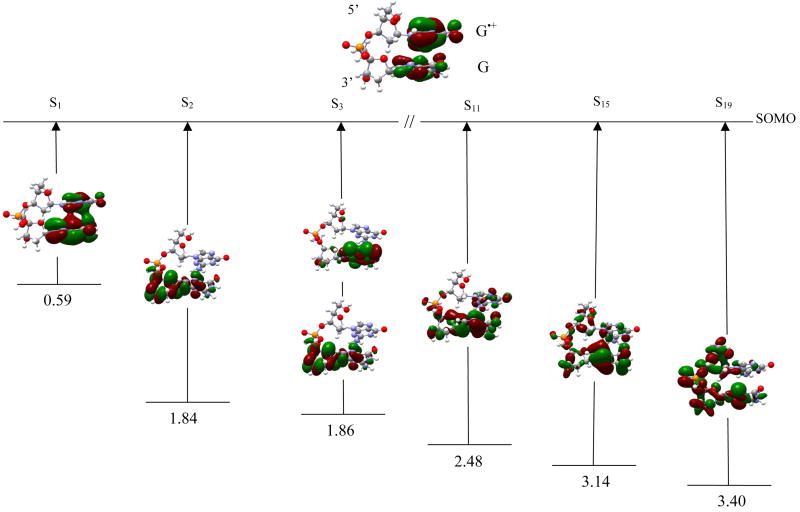
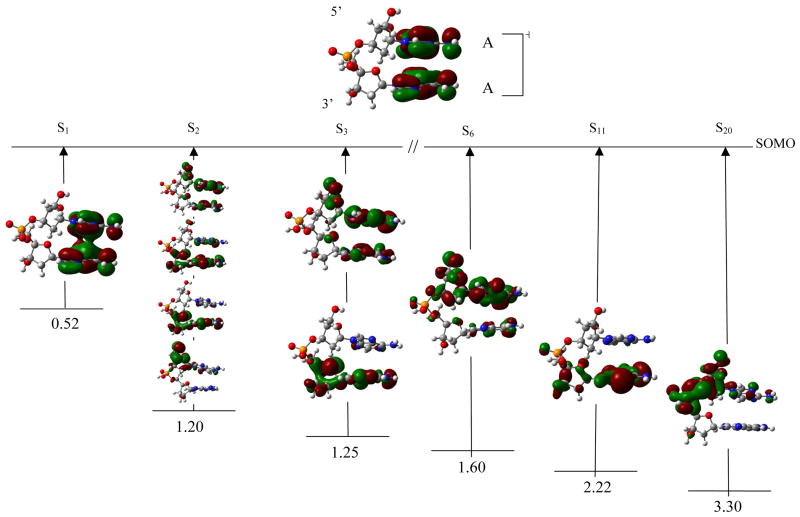
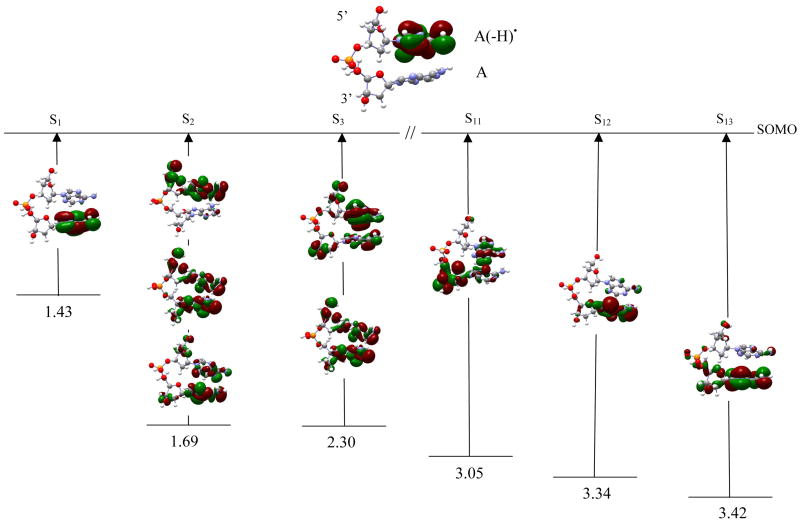
The optimized geometries of dG•+pdG, dA(-H)•pdA, dA(-H)•pdT, TpdA(-H)•), and TpdG•+ are shown in figure 1, respectively. Table 1 lists the first transition energies computed using TD-B3LYP/6-31G(d) along with those computed using CASSCF and different methods for the stacked DNA nucleobases.10 The first twenty transition energies in a solvated environment (ε = 78.4), using the TD-B3LYP/6-31G(d) level of theory, along with their oscillator strengths, orbital transitions and orbital contributions are presented in Tables 4–9 (as supporting material). The optimized geometries of all the systems considered in this study are also given in the supporting material. In figures 2–7, we selectively present six transitions, which covers the visible to near UV range, along with the orbital plots that are involved in the transitions. Transitions S1, S2 and S3 (shown in figures 2–7) correspond to the three lowest transitions whereas the other three transitions presented in Figures 2–7 have been chosen because each has a dominant molecular orbital contribution from a single inner MO. The other transitions are given in the supplemental information.
Table 1.
Calculated first excitation energies.
| Radical (5′-XY-3′) | Method | Excitation Energy (eV)
|
|
|---|---|---|---|
| Theory | Estimatedb | ||
| dG•+pdG | TD- B3LYP/6-31G(d) | 0.59 | 0.51 |
| G•+G | CAS-PT2(11,12)a | 0.39 | |
| dG•+pdT | TD- B3LYP/6-31G(d) | 1.00 | 1.06 |
| G•+T | CAS-PT2(11,12)a | 1.18 | |
| Tpd G•+ | TD- B3LYP/6-31G(d)c | 0.76 | 1.06 |
| CAS-PT2(11,12)a | 0.80 | ||
| (dApdA)•+ | TD- B3LYP/6-31G(d) | 0.52 | 1.03 |
| A•+A | CAS-PT2(11,12)a | 0.10 | |
| dA(-H)•pdA | TD- B3LYP/6-31G(d) | 1.43 | 1.14 |
| dA(-H)•pdT | TD- B3LYP/6-31G(d) | 1.87 | 1.73 |
| TpdA(-H)• | TD- B3LYP/6-31G(d) | 1.80 | 1.73 |
Complete active space (CAS). Ref. 10
Estimate of first excited state transition energy using equation 1. See supplemental for full description of the details this calculation.
Ref. 6. (g)
Figure 2.
TD-B3LYP/6–31G(d) computed transition energies of selected transitions of dG•+pdG cation radical. Excitation energies are given in eV.
Figure 7.
TD-B3LYP/6–31G(d) computed transition energies of selected transitions of (dApdA)•+ cation radical. Excitation energies are given in eV.
dG•+pdG In figure 2, six transitions which occur from inner shell molecular orbitals (MOs) to the singly occupied molecular orbital (SOMO) of β-spin along with plots of their molecular orbitals are shown. The ground state SOMO shows that the hole is localized largely on the 5′-guanine rather than the 3′-guanine. The first transition (S1) occurs between (SOMO-1) → SOMO of β-spin and moves substantial positive charge from the 5′-guanine to the 3′-guanine (see SOMO-1 in figure 2). S1 has energy 0.59 eV and oscillator strength of 0.0399. It is a π→π* transition between the two bases and involves a partial hole transfer between them. The second transition (S2) occurs due to promotion of an electron from (SOMO-2) to SOMO. This transition has transition energy 1.84 eV and a small oscillator strength of 0.0004. The hole in this state is mainly localized on the sugar ring attached to the 3′-guanine with a small fraction remaining ons the guanine base. A mixing of σ and π orbitals are found in this transition as it is clearly evident from their orbital plot (figure 2). S3 takes place between MOs (149B + 153B) → SOMO with energy 1.86 eV and oscillator strength 0.0006. The orbital plots of 149B and 153B show that the hole in this state is localized on the sugar ring and the guanine base (figure 2). Other transitions S4 to S19 show base-to-base and base-to-sugar hole transfer. Those that are limited to dominant contributions from a single MO are the transitions S11, S15 and S19 which have transition energies 2.48, 3.14 and 3.40 eV, respectively, with corresponding oscillator strengths 0.0081, 0.0115, and 0.0057. In S11 and S15, holes are mainly localized on the 3′-site of the sugar ring and guanine base while a small amount stays on the 5′-site sugar ring and guanine base. However, in S19 the hole is localized on both the sugar rings, the phosphate group, and slightly on the 3′-guanine.
dA(-H)•pdA For dA(-H)•pdA, shown in figure 3, the SOMO is mainly localized on the A(-H)• at 5′-site. The first transition (S1) involves the orbitals SOMO-1 → SOMO of β-spin and has transition energy 1.43 eV and oscillator strength 0.0021. This transition results in a transfer of an electron from the 3′-adenine to the 5′-A(-H)• creating a charge transfer complex, dA(-H)− pdA+•. From the orbital plots it is evident that the transition is π→π* in nature. S2 has energy 1.69 eV and (weak) oscillator strength 0.0001. As shown in figure 3, this transition arises from [SOMO-2, SOMO-3, SOMO-5] → SOMO. The orbital plots indicates that the hole is localized on both the adenines, C5′, C3′ and on the sugar rings. S3 involves [141, 144 → SOMO] and has transition energy 2.30 eV and oscillator strength 0.0169; this is larger than the S1 and S2 oscillator strengths. In this case, the hole is distributed on both the adenines, and on C5′ and C3′ (see figure 3). For S11, the hole is mainly localized on the sugar ring at 3′-site while a small part is distributed between both the adenines. For S12 and S13, the hole is localized on the adenine ring with a small part still localized on C3′ as shown in figure 3.
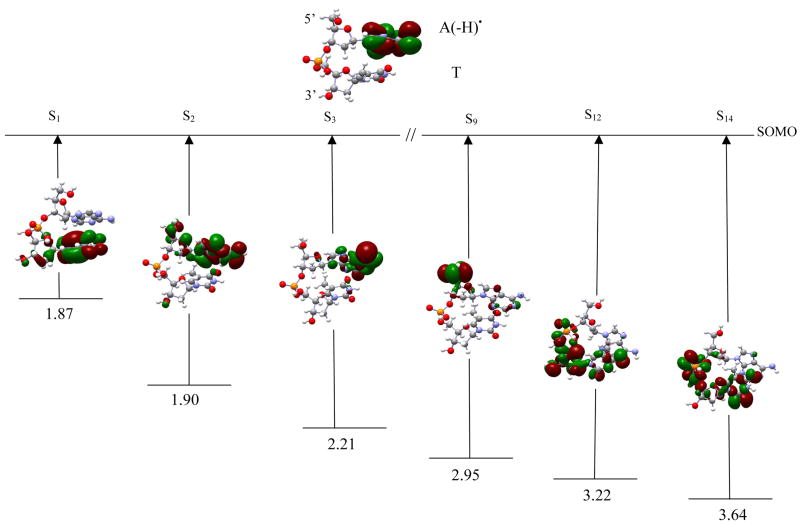
dA(-H)•pdT The computed TD-B3LYP/6-31G(d) transition energies of dA(-H)•pdT are presented in Table 6. The SOMO in the ground doublet state is completely localized on the adenine ring (figure 4). The first transition (S1) is π → π* and takes place between SOMO-1 → SOMO of β-spin. In this excited state the hole is transferred from the adenine to the thymine ring, with a very small portion on the thymine sugar ring. This creates a charge transfer intermediate dA(-H)−pdT+•. The S1 excitation energy is 1.87 eV with a weak oscillator strength of 0.0001. S2 involves excitation from molecular orbital 140 → SOMO of β-spin and has transition energy 1.90 eV and oscillator strength 0.0001. In this case the hole largely remains localized on the adenine with some sugar ring involvement at C5′. In S3 the orbital is localized on the A(-H) • ring and has transition energy 2.21 eV and oscillator strength 0.0020. For S9 the hole is mainly localized on C5′; however, in S12, the hole is distributed over the thymidine sugar ring including C3′. S14, which occurs between 133 → SOMO, has excitation energy 3.64 eV and no significant oscillator strength. The hole in this state is localized on the thymine and phosphate group and slightly on the sugar ring.
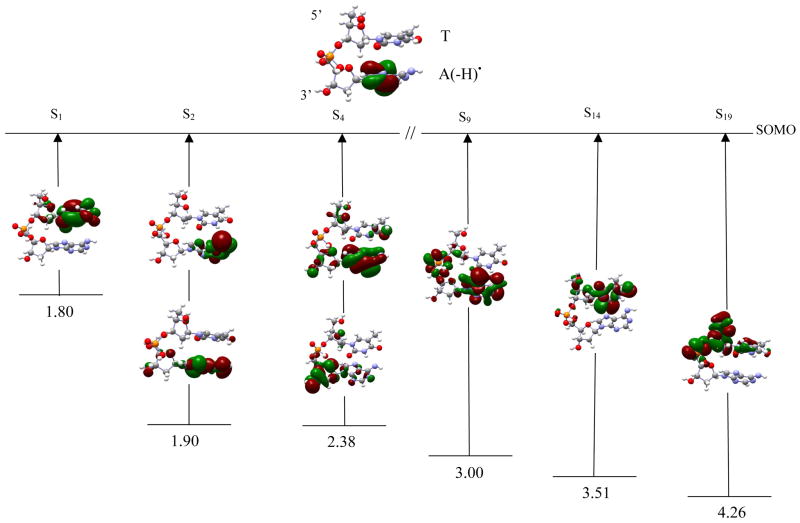
TpdA(-H)• The S1 transition, shown in figure 5, occurs from SOMO-1 → SOMO of β-spin. It has transition energy 1.80 eV and oscillator strength 0.0001. In this excitation the hole is transferred to the thymine ring, and the adenine ring becomes negatively charged forming T+•pdA(-H)−. This is a π → π* transition, as indicated from the orbital plots of SOMO-1 and SOMO, shown in figure 5. S2 is between MOs [134, 141 → SOMO] with the transition energy 1.90 eV and oscillator strength 0.0001. This transition is mainly to an excited state of the adenine ring. S3 is between MOs [134, 141 → SOMO] having transition energy 2.19 and oscillator strength 0.0021. Since S2 and S3 involve the same orbital in transition, we did not show the S3 transition in figure 5. S4 takes place between MOs [138, 143 → SOMO] and has transition energy 2.38 eV and oscillator strength 0.0302. The hole is localized on the adenine base, sugar ring and C3′. The other three transitions (S9, S14 and S19) lie in the range 3.00 – 4.26 eV. In S9 the hole is localized on the adenine and on the phosphate group. In S14 the hole is localized on the thymine with a small part on C5′. In S19 the hole is localized over the sugar ring, C5′ and the phosphate group.
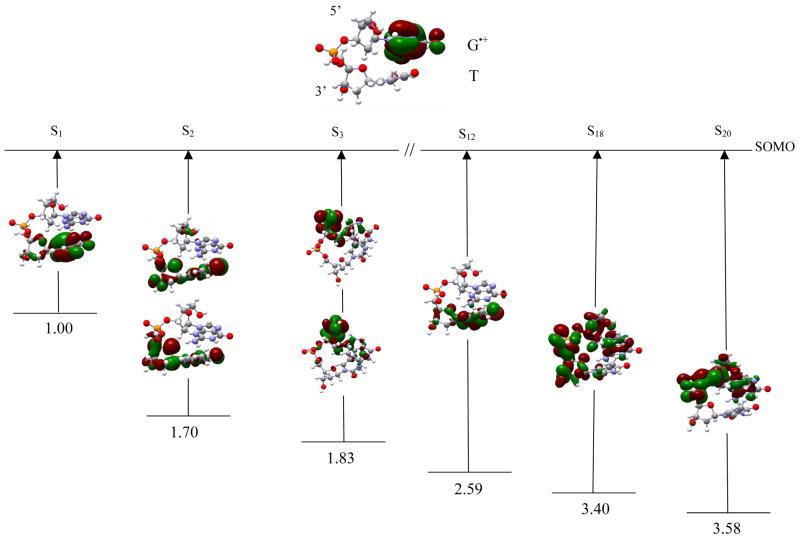
dG•+pdT Figure 6 shows that the SOMO (representing the hole) is completely delocalized over the guanine ring. The first transition (S1) transfers a hole from guanine to thymine, resulting in a dGpdT•+ hole transfer state. The S1 transition occurs at 1.00 eV and is π → π* in nature. The second transition S2 takes place between [145, 147 → SOMO] with transition energy 1.70 eV and oscillator strength 0.0010. The hole in this transition is distributed between the thymine ring and the adjacent sugar ring. The S3 transition occurs at 1.83 eV between MOs [143,144 → SOMO]. In this transition, the hole is completely localized on C5′. In the S12 transition, the hole is localized on the thymine, with a very small part on the connected sugar ring. Transitions S18, and S20 occur at 3.40 and 3.58 eV, respectively, with the hole localized on both sugar rings, a phosphate and the guanine ring.
(dApdA)•+ dApdA radical cation shows some peculiar behavior with the SOMO delocalized on both the adenine bases (see figure 7). The TD-B3LYP/6-31G(d) computed first transition (S1) is π→π* in nature and has excitation energy 0.52 eV and oscillator strength 0.0481. This transition occurs between SOMO-1 → SOMO. In contrast to dG•+pdG, in which the SOMO is mainly localized on one of the guanine base (figures 2), the SOMO in (dApdA)•+ is almost equally distributed between the adenine bases. The second transition, which occurs at 1.20 eV, is between MOs [141,142,143,145 → SOMO] and the hole is distributed on both the adenines, the sugar rings, C(5′) and C(3′) (figure 7). S3 takes place between MOs [141, 143 → SOMO] and has the hole distribution similar to that in S2. The S3 transition has an excitation energy of 1.25 eV. The other three transitions S6, S11 and S20 occur at 1.60, 2.22 and 3.30 eV, respectively. In these transitions the holes are mainly localized on C5′, the sugar ring, adenine and phosphate.
Figure 3.
TD-B3LYP/6–31G(d) computed transition energies of selected transitions of dA(-H)•pdA radical. Excitation energies are given in eV.
Figure 4.
TD-B3LYP/6–31G(d) computed transition energies of selected transitions of dA(-H)•pdT radical. Excitation energies are given in eV.
Figure 5.
TD-B3LYP/6–31G(d) computed transition energies of selected transitions of TpdA(-H)• radical. Excitation energies are given in eV.
Figure 6.
TD-B3LYP/6–31G(d) computed transition energies of selected transitions of dG•+pdT cation radical. Excitation energies are given in eV.
The nature of hole localization on DNA is of crucial importance because it aids the description of the mechanism of charge transfer processes within the DNA.22–28 ESR studies on holes in DNA clearly show localization at a single guanine. Figure 2, shows that in dG•+pdG the SOMO (representing the hole) is mainly localized (~84% spin density) on the 5′-G and a very small amount of hole (~16% spin density) localized on the 3′-G; in the first excited state, the hole(s) transfer to the 3′-G and a small amount remains on the 5′-G. Using KTA and CASSCF methods Blancafort and Voityuk10 calculated the Mulliken charges on the 5′-GG-3′ radical cation and they found that ~97% of holes are localized on the 5′-G and ~3% on the 3′-G. However, in the excited state the holes are transferred to the 3′-G and a small amount remains on the 5′-G. Saito and co-workers,24,25 using both experimental and ab initio calculations, demonstrated that 5′-G in 5′-GG-3′ is most easily oxidized and the orbitals calculated using 3-21G* basis set are mainly localized on the 5′-G and a small amount resides on the 3′-G on a stacked N-methylated GG/CC system. Hall et al.26, also demonstrated that long-range oxidative damage of DNA occurs specifically at the 5′-G in the 5′-GG-3′ doublets. Using DFT Senthilkumar et al.27 calculated the distribution of excess charge on guanines in different sequences and concluded that 5′-G is most easily oxidized.
In ground state of radical cation of dApdA, ~57% spin density is localized on the 5′- site of adenine while ~43% is localized on the 3′-site. Using CASSCF and KTA methods,10 a large variation in the positive charge localization on the 5′-AA-3′ radical cation has been reported which ranges from ~70% to 99% hole localization on the 3′-adenine and 30% to 1% hole localization on the 5′-adenine. For dG•+pdT (Figure 6), that the holes are completely localized on the 5′-G•, the same feature is observed using the KTA and CASSCF methods.10.
Recently, Head-Gordon and co-workers29–31 showed the limitations of TD-DFT method in describing the long-range charge-transfer excited states correctly. For the systems we are investigating this long range effect is not expected to be of significance. In order to test this we compare our results in two ways. First, we compare our TD-B3LYP/6-31G(d) calculated first transition energies of the dinucleoside phosphates radical cations treated in this work with work of Blancafort and Voityuk10 for three comparable stacked two DNA base radical cations using CASSCF/CAS-PT2 level of theory. These results are presented in Table 2 and show that the values found even for these differing systems and levels of calculation are in good agreement with the exception for dA•+pdA and 5′-A•+A-3′ which differs by 0.4 eV. We note that the transition energy of 0.1 eV for 5′-A•+A-3′ was considered problematic in the work of Blancafort and Voityuk10 because of the difficulty in considering the active space in the CASSCF method.
Since systems which have transitions with full charge transfer, such as dA(-H)•pdA, and dA(-H)•pdT were not considered by Blancafort and Voityuk10, we performed another test of this possible limitation in the TD-DFT method by calculating the first excitation energy using equation (1)
| (1) |
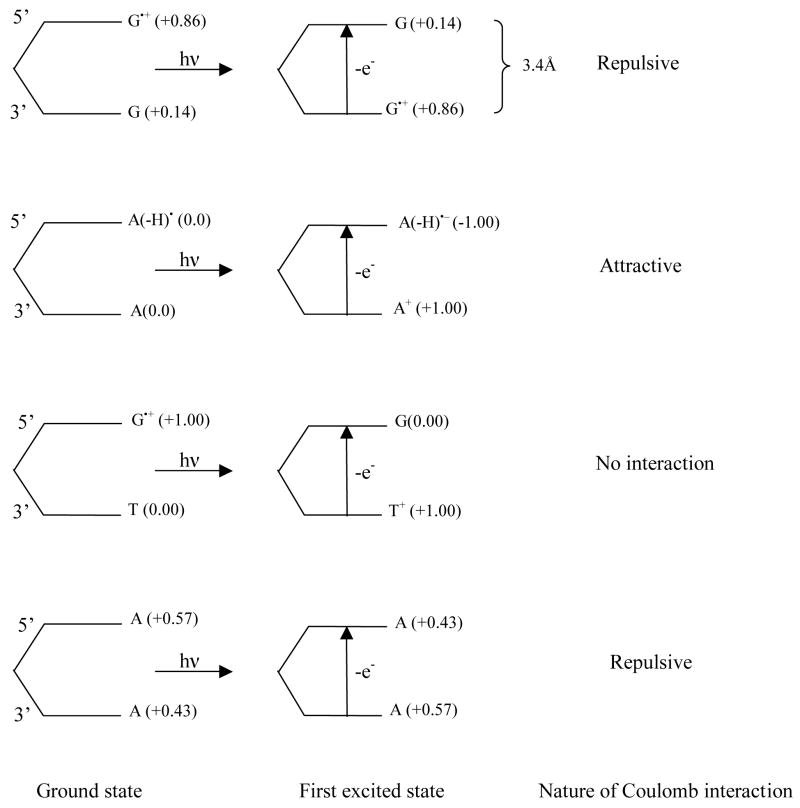
as proposed by Head-Gordon and co-workers31 In equation (1), IPbase1, EAbase2 and q1q2/R represent the ionization potential of base1 (donor), electron affinity of base2 (acceptor), q1 and q2 refer to the charge localized on base1 and base2, respectively, while R is the distance between the two bases which we assumed as 3.4 Å. The quantity q1q2/R is the Coulomb interaction between the two bases calculated in the point charge approximation. For the calculation of Eex, we used the available experimental adiabatic ionization potentials32 of A, G and T and the theoretically calculated adiabatic electron affinity of A(-H)• as reported by Evangelista and Schaefer33 using the B3LYP/DZP++ level of theory. To our surprise for such a simple relationship, the calculated first transition energies using equation 1 are in good agreement with those calculated with the TD-DFT/6-31G(d) method (see Table 2 and supplemental (Table 10) for a full description). Results from equation 1 suggest that electrostatic interactions between the bases play an important role in the transition energies. In the case of radical cations, such as dG•+pdT and TpdG•+, which have full charge transfer, the electrostatic interaction term in the first excited state is zero. Whereas, for dG•+pdG and (dApdA)•+ the electrostatic interaction is repulsive in the first excited state because the hole transfer is only partial and both bases have positive charge (see figure 8). However, in the case of a neutral radical, such as A(-H)•pdA or A(-H)•pdT, the electrostatic interaction in the excited states is attractive as full charge transfer was found yielding A(-H)−pdA+•, A(-H)−pdT+• in these excited states (figure 8). Results for (dApdA)•+ were the most discordant; the TD-DFT/6-31G(d) calculated first excitation energy (0.52 eV) is less than that estimated by equation 1 by 0.5 eV and larger than that from previous CAS calculations by 0.4 eV (Table 2).
Figure 8.
Schematic diagram of dG•+pdG, dA(-H)•pdA, dG•+pdT and (dApdA)•+ showing the localization of charge on the bases in their ground and first excited states (in parentheses) as estimated from orbital plots shown in Figures 2–7. Nature of the electrostatic interaction (using point charge approximation) between the bases in excited state is also given.
Conclusions
Below ~3.3 eV all the transitions calculated for one electron oxidized radicals of the dinucleoside phosphates, investigated in this study take place between inner (core) shell MOs to the SOMO of β-spin, and are in the visible to near UV spectral range. These transitions often result in hole transfer to the sugar phosphate backbone. The SOMO → LUMO (lowest unoccupied molecular orbital) transition does not occur in this energy range owing to a large SOMO- LUMO energy gap in these systems.
In one electron oxidized dinucleoside phosphates the first transition invariably involves hole transfer from base to base and hole transfer to the sugar ring is found at higher energies. The extent and nature of this base to base hole transfer is predicted in agreement with the CASSCF/CAS-PT2 methods.10 We find that dG•+pdG and dApdA •+ have the lowest excitation energies of 0.6 and 0.5 eV, respectively, among all one electron oxidized dinucleoside phosphates.
The B3LYP/6-31G(d) calculated first transition energies for the one electron oxidized dinucleoside phosphates are in good agreement with those calculated for the equivalent stacked DNA base radicals using a Koopmans’ theorem approximation (KTA) and CASSCF/CAS-PT2 methods.10
For dG•+pdG in its ground state, the hole is chiefly localized on the 5′-G which is in good agreement with the available experimental and theoretical results.10,22–27
The present study supports the hypothesis, generated from experiment, that hole transfer from base to sugar occurs on photo excitation of the one-electron-oxidized DNA systems leads to sugar radical formation. This study also supports the experimental finding that in DNA the longer wavelengths did not produce sugar radicals; as our calculations show these are involved in base to base transitions.1,4–6
Supplementary Material
Supporting information is available including: Complete Reference 20, Tables 4–8 giving full listing of transition energies, oscillator strengths and hole localization in the excited state, and DFT optimized geometries of each species investigated. This material is available free of charge via the internet at http://pubs.acs.org/.
Acknowledgments
This work was supported by the NIH NCI under grant no. R01CA045424. The authors are grateful to the Artic Region Supercomputing Center (ARSC) for generously providing the computational time to perform most of these calculations. The authors also thank the ARSC staff for their support and cooperation. AK is very thankful to Prof. D. Becker for critically reviewing the manuscript.
References
- 1.Adhikary A, Collins S, Koppen J, Becker D, Sevilla MD. Nucleic Acid Res. 2006;34:1501. doi: 10.1093/nar/gkl026. [DOI] [PMC free article] [PubMed] [Google Scholar]
- 2.Becker D, Bryant-Friedrich A, Trzasko C, Sevilla MD. Radiat Res. 2003;160:174. doi: 10.1667/rr3037. [DOI] [PubMed] [Google Scholar]
- 3.Becker D, Razskazovskii Y, Callaghan MU, Sevilla MD. Radiat Res. 1996;146:361. [PubMed] [Google Scholar]
- 4.Shukla LI, Pazdro R, Huang J, DeVreugd C, Becker D, Sevilla MD. Radiat Res. 2004;161:582. doi: 10.1667/rr3167. [DOI] [PubMed] [Google Scholar]
- 5.Adhikary A, Malkhasian AYS, Collins S, Koppen J, Becker D, Sevilla MD. Nucleic Acids Res. 2005;33:5553. doi: 10.1093/nar/gki857. [DOI] [PMC free article] [PubMed] [Google Scholar]
- 6.Adhikary A, Kumar A, Sevilla MD. Radiat Res. 2006;165:479. doi: 10.1667/rr3563.1. [DOI] [PubMed] [Google Scholar]
- 7.(a) Hirata S, Head-Gordon M, Szczepanski J, Vala M. J Phys Chem A. 2003;107:4940. [Google Scholar]; (b) Halasinski TM, Weisman JL, Ruiterkamp R, Lee TJ, Salama F, Head-Gordon M. J Phys Chem A. 2003;107:3660. [Google Scholar]; (c) Halasinski TM, Hudgins DM, Salama F, Allamandola LJ, Bally T. J Phys Chem A. 2000;104:7484. [Google Scholar]; (d) Szczepanski J, Banisaukas J, Vala M, Hirata S, Bartlett RJ, Head-Gordon M. J Phys Chem A. 2002;106:63. [Google Scholar]; (e) Hirata S, Lee TJ, Head-Gordon M. J Chem Phys. 1999;111:8904. [Google Scholar]
- 8.Jean JM, Hall KB. Proc Natl Acad Sci. 2001;98:37. doi: 10.1073/pnas.011442198. [DOI] [PMC free article] [PubMed] [Google Scholar]
- 9.Jean JM, Hall KB. Biochemistry. 2002;41:13152. doi: 10.1021/bi020308y. [DOI] [PubMed] [Google Scholar]
- 10.Blancafort L, Voityuk AA. J Phys Chem A. 2006;110:6426. doi: 10.1021/jp061184s. [DOI] [PubMed] [Google Scholar]
- 11.SPARTAN, version 5.0, Wavefunction, Inc., Irvine, CA, (1997).
- 12.Becke AD. J Chem Phys. 1993;98:1372. [Google Scholar]
- 13.Stephen PJ, Devlin FJ, Frisch MJ, Chabalowski CF. J Phys Chem. 1994;98:11623. [Google Scholar]
- 14.Lee C, Yang W, Parr RG. Phys Rev B. 1988;37:785. doi: 10.1103/physrevb.37.785. [DOI] [PubMed] [Google Scholar]
- 15.Tsolakidis A, Kaxiras E. J Phys Chem A. 2005;109:2373. doi: 10.1021/jp044729w. [DOI] [PubMed] [Google Scholar]
- 16.Cossi M, Barone V. J Chem Phys. 2001;115:4708. [Google Scholar]
- 17.Gustavsson T, Banyasz A, Lazzarotto E, Markovitsi D, Scalmani G, Frisch MJ, Barone V, Improta R. J Am Chem Soc. 2006;128:607. doi: 10.1021/ja056181s. [DOI] [PubMed] [Google Scholar]
- 18.Shukla MK, Leszczynski J. J Comput Chem. 2004;25:768. doi: 10.1002/jcc.20007. [DOI] [PubMed] [Google Scholar]
- 19.Shukla MK, Leszczynski J. J Phys Chem A. 2002;106:11338. [Google Scholar]
- 20.Frisch MJ, et al. Gaussian03 Revision B.04. Gaussian, Inc; Pittsburgh, PA: 2003. [Google Scholar]
- 21.GaussView. Gaussian, Inc; Pittsburgh, PA: 2003. [Google Scholar]
- 22.Voityuk AA. J Chem Phys. 2005;122:204904. doi: 10.1063/1.1924551. [DOI] [PubMed] [Google Scholar]
- 23.Voityuk AA. J Phys Chem B. 2005;109:10793. doi: 10.1021/jp050985c. [DOI] [PubMed] [Google Scholar]
- 24.Sugiyama H, Saito I. J Am Chem Soc. 1996;118:7063. [Google Scholar]
- 25.Saito I, Nakamura T, Nakatani K, Yoshioka Y, Yamaguchi K, Sugiyama H. J Am Chem Soc. 1998;120:12686. [Google Scholar]
- 26.Hall DB, Holmlin RE, Barton JK. Nature. 1996;382:731. doi: 10.1038/382731a0. [DOI] [PubMed] [Google Scholar]
- 27.Senthilkumar K, Grozema FC, Guerra CF, Bickelhaupt FM, Siebbeles LDA. J Am Chem Soc. 2003;125:13658. doi: 10.1021/ja037027d. [DOI] [PubMed] [Google Scholar]
- 28.(a) Cai Z, Sevilla MDTop. Curr Chem. 2004;237:103. [Google Scholar]; (b) Barnett RN, Cleveland CL, Joy A, Landman U, Schuster GB. Science. 2001;294:567–571. doi: 10.1126/science.1062864. [DOI] [PubMed] [Google Scholar]; (c) Conwell EM. Proc Natl Acad Sci USA. 2005;102:8795. doi: 10.1073/pnas.0501406102. [DOI] [PMC free article] [PubMed] [Google Scholar]; (d) Goldsmith RH, Sinks LE, Kelley FF, Betzen LJ, Liu W, Weiss EA, Ratner MA, Wasielewski MR. Proc Natl Acad Sci. 2005;102:3540–3545. doi: 10.1073/pnas.0408940102. [DOI] [PMC free article] [PubMed] [Google Scholar]; (e) Lewis FD, Zhu H, Daublain P, Fiebig T, Raytchev M, Qiang Wang Q, Shafirovich V. J Am Chem Soc. 2006;128:791–800. doi: 10.1021/ja0540831. [DOI] [PubMed] [Google Scholar]; (f) Kelley SO, Barton JK. Science. 1999;283:375. doi: 10.1126/science.283.5400.375. [DOI] [PubMed] [Google Scholar]; (g) Lewis FD. Photochem Photobiol. 2005;81:65. doi: 10.1562/2004-09-01-ir-299.1. [DOI] [PubMed] [Google Scholar]; (h) Giese B. Nature. 2001;412:318. doi: 10.1038/35085542. [DOI] [PubMed] [Google Scholar]
- 29.Dreuw A, Head-Gordon M. J Am Chem Soc. 2004;126:4007. doi: 10.1021/ja039556n. [DOI] [PubMed] [Google Scholar]
- 30.Dreuw A, Head-Gordon M. Chem Rev. 2005;105:4009. doi: 10.1021/cr0505627. [DOI] [PubMed] [Google Scholar]
- 31.Dreuw A, Weisman JL, Head-Gordon M. J Chem Phys. 2003;119:2943. [Google Scholar]
- 32.Colson AO, Sevilla MD. Int J Radiat Biol. 1995;67:627. doi: 10.1080/09553009514550751. [DOI] [PubMed] [Google Scholar]
- 33.Evangelista FA, Schaefer HF. J Phys Chem A. 2004;108:10258. [Google Scholar]
Associated Data
This section collects any data citations, data availability statements, or supplementary materials included in this article.
Supplementary Materials
Supporting information is available including: Complete Reference 20, Tables 4–8 giving full listing of transition energies, oscillator strengths and hole localization in the excited state, and DFT optimized geometries of each species investigated. This material is available free of charge via the internet at http://pubs.acs.org/.


