Abstract
The aim of this study was to assess the need and demand for sedation or general anesthesia (GA) for dentistry in the Canadian adult population. A national telephone survey of 1101 Canadians found that 9.8% were somewhat afraid of dental treatment, with another 5.5% having a high level of fear. Fear or anxiety was the reason why 7.6% had ever missed, cancelled, or avoided a dental appointment. Of those with high fear, 49.2% had avoided a dental appointment at some point because of fear or anxiety as opposed to only 5.2% from the no or low fear group. Regarding demand, 12.4% were definitely interested in sedation or GA for their dentistry and 42.3% were interested depending on cost. Of those with high fear, 31.1% were definitely interested, with 54.1% interested depending on cost. In a hypothetical situation where endodontics was required because of a severe toothache, 12.7% reported high fear. This decreased to 5.4% if sedation or GA were available. For this procedure, 20.4% were definitely interested in sedation or GA, and another 46.1% were interested depending on cost. The prevalence of, and preference for, sedation or GA was assessed for specific dental procedures. The proportion of the population with a preference for sedation or GA was 7.2% for cleaning, 18% for fillings or crowns, 54.7% for endodontics, 68.2% for periodontal surgery, and 46.5% for extraction. For each procedure, the proportion expressing a preference for sedation or GA was significantly greater than the proportion having received treatment with sedation or GA (P < 0.001). In conclusion, this study demonstrates that there is significant need and demand for sedation and GA in the Canadian adult population.
Keywords: Sedation, General anesthesia, Canada, Adults, Dental fear, Dental anxiety
Introduction
Fear and anxiety of dentistry are common findings.1–17 Although related, they differ in that fear may be considered the physiological process that occurs in the body when threatened by danger, whereas anxiety is the anticipation of the possibility of danger and is perceived to be less immediate in nature.18,19 Their presence in dental patients may lead to avoidance of appropriate care and therefore an impairment of their oral health.1,9,12,20–22
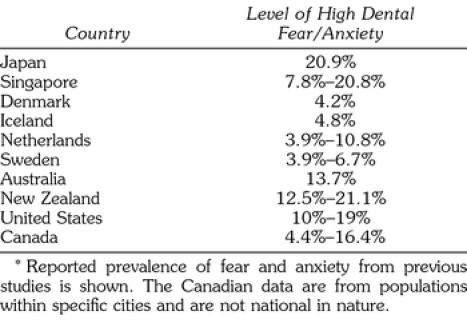
Fear and anxiety in dentistry have been estimated in various populations across the world, with various estimates shown in Table 1. Dental anxiety levels have been reported to be in the range of 4.2% to 20.9%.8,9 Even within the same population, different levels of anxiety have been found when using different measures.23 In Canada, prevalence rates ranging from 4.4% to 16.4% have been reported.
Table 1.
Prevalence of Dental Fear/Anxiety Internationally*
A number of scales have been used to determine the level of fear and anxiety.24 The most widely used is Corah's Dental Anxiety Scale (DAS).25 Others include Gatchel's 10-point scale,1 which uses a scale of 1–10 to gauge the level of anxiety towards dental treatment. Milgrom's single-item scale2 asks the respondent “How do you rate your own feelings toward dental treatment?” and uses a 5-point response scale. Kleinknecht's Dental Fear Survey (DFS) is a 20-item measure which assesses the subject's avoidance behaviors, fears, and physiological responses experienced during dental treatment.26 Spielberger's State-Trait Anxiety Inventory (STAI) consists of 40 statements to distinguish whether the anxiety is general or specific in nature.27 The Dental Belief Scale (DBS) is a 15-item survey that considers four areas of the dentist-patient relationship: communication, belittlement, lack of control, and trust.28
One of the difficulties in assessing fear and anxiety is the use of different cutoffs to signify a dentally anxious person. For example, using the DAS, a number of studies report a highly dentally anxious person if their score is 13 or above;21,29 while others choose to use a cutoff of 15.7,8,11 Milgrom's single-item scale, which asks the subject to self-report their dental anxiety, uses the 5-item response: not at all afraid, a little afraid, somewhat afraid, very afraid, and terrified.2 In grouping responses into a dichotomy for ease of statistical analysis, Milgrom et al choose to group the last 3 choices into the highly anxious group. They state that those who report being “somewhat afraid” are 1 standard deviation above the norm and show tendencies to avoid dental care.2 However, studies comparing Milgrom's single-item scale to others have shown evidence to the contrary. In a study comparing the DAS, DFS, and Milgrom's single-item scale, Moore et al8 showed that a group consisting of just the “very afraid and terrified” subjects correlated well with the DFS and the DAS. Locker et al23 showed that when subjects were categorized using just the 2 groups mentioned previously, there was better agreement between Milgrom's single-item scale and the DFS. For the study described herein, to assess the level of dental anxiety within the Canadian population, the choice was made to use Milgrom's single-item scale. It has the advantage of being succinct and has been shown to be well correlated to the DAS and the DFS.
Many patients are unable to benefit from appropriate dental care due to their fear and anxiety.1,20,21 Treatment options to help these patients include behavioral modification, systematic desensitization, hypnosis, and guided relaxation.30 Nevertheless, for many individuals these techniques are insufficient and they may require sedation or general anesthesia (GA) in order to undergo dental procedures.
Whereas it may be assumed that there is a need for these services based on the presence of fear and anxiety, what is not clear is whether there is a demand for sedation or GA. There are few reports in the literature investigating demand for this service. A survey conducted in the United Kingdom published in 1987 showed that 31% of those interviewed preferred sedation or GA during dental treatment.31 In 1998, Dionne et al carried out a telephone survey of a random sample of the American population.12 Of the 400 respondents interviewed, 2.8% were receiving either intravenous sedation or GA for dentistry, but 8.6% would prefer either if available. In 2001, a published survey of young Saudi adults found that 13.9% preferred “being put to sleep” and 9.8% preferred sedation for their dental treatment.22 To date there has not been a national study of the Canadian population assessing their level of dental fear and anxiety or their demand for sedation and GA in dentistry. The objective of this investigation was to determine their presence by means of a national survey. The level of fear and anxiety, and both the current prevalence of, and preference for, sedation or GA for various dental procedures were investigated through the use of a random sample survey of the adult Canadian population.
Methods
The professional call center SOM of Montreal was contracted to carry out a random digit dialing telephone survey utilizing a stratified 2-stage sample design. Each respondent was asked 14 questions on the topics of fear and anxiety in dentistry and demand for sedation or anesthesia services. These questions also obtained information on age, gender and language, to allow comparison to the most recent Canadian census of 2001 and thereby permitting weighting of the results so that the sample more closely resembled the true population. Only dentate individuals were asked to complete the questionnaire. To prevent potential response bias, the interviewers used a strict format outlined on the questionnaire which alternated the order of response options for each respondent.
The target population was all persons 18 years of age or older in Canada that had at least one natural tooth remaining. To achieve a sampling error of 3% for the estimated population of Canada of 30,000,000, the required sample size was 1067, using the sample size calculation of Neter et al.32 After rounding up, the sample size of this study aimed for 1100 completed interviews. The population distribution within Canada was broken down into 13 strata proportional to the population size for that area. The sizes of the strata varied from 9 to 253. For the first stage SOM used random digit dialing methodology to select households. The second stage randomly selected individuals within a household based on the Kish method.33 It is acknowledged that those without telephones, which approximates 1.4% of the population based on a 1997 Statistics Canada publication, would not have been available for this survey.34
Data analysis was performed using the statistical software package SPSS version 11.0, with all cross-tabulations confirmed using the statistical software Stata (Stata Corp LP, College Station, Tex). The use of a sampling error of 3% in the sample size calculation was based on the assumption that a simple random sample was to be used. As this survey was not a simple random sample but rather a 2-stage stratified random sample, the calculated sampling error for this survey was 3.31%, based on the estimate variances of the Jack-knife method.35 Calculation of the design effect for this study was 1.26. Chi square analysis was used to test for differences in proportions and the binomial test was used to compare an observed proportion (ie, the proportion preferring sedation for various techniques) with an expected proportion (ie, the proportion having had sedation for those techniques). All tests used the value P < 0.05 as being significant.
Results
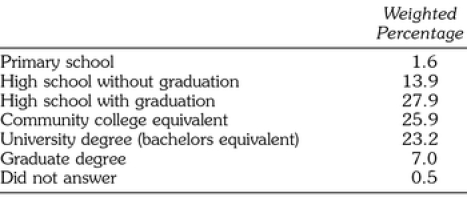
The final sample was 1101 respondents achieved by initially contacting 4478 phone numbers, of which 2817 were usable. The estimated nonresponse was 14.6%, the refusal rate 39.5% and the estimated response rate 45.9%. The gender distribution of the un-weighted sample was 39.6% male and 60.4% female. After weighting to reflect the Canadian Census of 2001, there were 49.3% male and 50.7% female. All subsequent data reports are based on weighted data of those dentate respondents who completed the survey. The distributions of the respondents by age is shown in Table 2A and distributions by education of the respondents are shown in Table 2B.
Table 2A.
Age Demographics
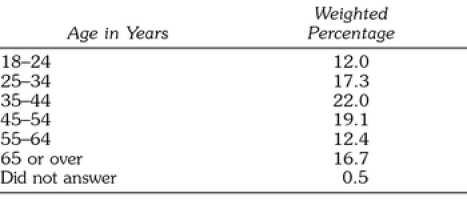
Table 2B.
Education Demographics
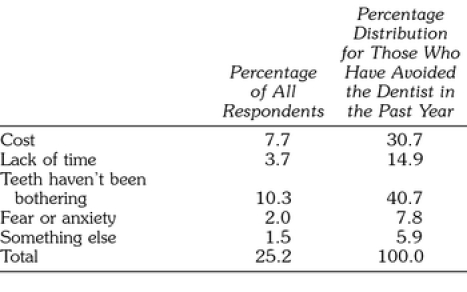
The results regarding time since last dental visit are shown in Table 3A. It can be seen that 25.2% had not been to the dentist in over one year, with the main reasons summarized in Table 3B. Fear of dentistry was the reason why 7.8% of the respondents had not been to the dentist in the past year, which equated to 2.0% of all respondents.
Table 3A.
Time Since Last Dental Visit
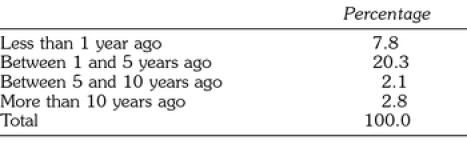
Table 3B.
Reasons for Avoiding Dental Visits
Prevalence of dental fear or anxiety was assessed by the responses to the question “How would you rate your feelings toward having dental treatment done?”. The results are shown in Table 4A, and these were then dichotomized according to their self-reported level of anxiety. Those that answered that they were either not at all afraid, a little afraid, or somewhat afraid would be grouped together as having no fear or a low level of fear, while those that reported that they were either very afraid or terrified were grouped together as having a high level of fear (Table 4B).
Table 4A.
Level of Dental Fear
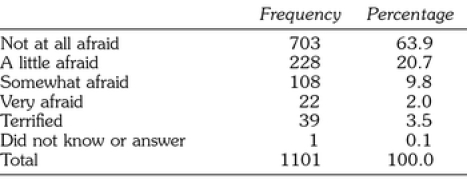
Table 4B.
Dichotomized Grouping of Dental Fear

Overall, 5.5% reported high levels of fear. Females were more than 2.5 times as likely to report having high fear towards dental treatment (7.9% vs 3.1%), which was statistically significant (chi-square, P < 0.001). The distribution by age is shown in Table 5, and it can be seen that there was no difference among the age groups and fear (chi-square, P > 0.05). There was also no relation with education level (chi-square, P > 0.05). A total of 63.2% of respondents indicated that they were covered by dental insurance, which made no difference with regard to the level of dental fear (chi-square, P > 0.05).
Table 5.
Cross-tabulation Between Level of Dental Fear or Anxiety and Age

As shown in Table 6A, when asked, “Have you ever missed, cancelled, or avoided a dental appointment because of fear of anxiety?,” 7.6% of the respondents indicated yes. This compares with the 2.0% who did so in the past year alone, as described above. The cross-tabulation of level of dental fear with avoidance is shown in Table 6B. Of those with a high level of fear, 49.2% had indicated that they had at some point missed, cancelled or avoided a dental appointment because of fear or anxiety, which was significantly different from the 5.2% in the no or low fear group (P < 0.001). This table also shows that 64.3% of those who avoided the dentist because of fear or anxiety self-reported themselves as having no or a low level of dental fear.
Table 6A.
Avoidance of Dental Visits
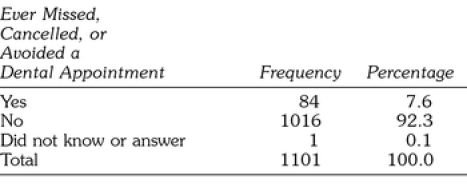
Table 6B.
Level of Dental Fear Related to Avoidance of Dental Visits

Respondents were asked about their interest in having either sedation or GA for their dental treatment. Sedation or GA was defined as “having an intravenous needle in the arm and medications administered in order to be anywhere from lightly asleep to totally asleep.” These results are shown in Table 7A. When cross-tabulated with their level of fear regarding dental treatment, 31.1% of those with high fear are definitely interested in sedation or GA with another 54.1% possibly interested depending on the cost (Table 7B). Only 14.8% of those with high fear were not interested. For those with no or low fear many were not interested, yet 42.3% were interested depending on the cost and 11.4% were definitely interested.
Table 7A.
Interest in Sedation or General Anesthesia during Dental Visits
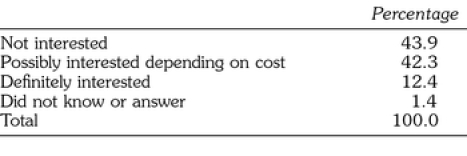
Table 7B.
Level of Dental Fear Related to Interest in Sedation or General Anesthesia

The respondents were then asked to imagine a scenario in which they had a toothache, were in severe pain and had to visit the dentist the next morning for endodontic treatment. They were then asked about their feelings about having this treatment. The results are seen in Table 8A. Similar to the classifications used in Table 4B, those in the “Very afraid” and “So terrified that would not have it done” were grouped into the high fear category (Table 8B). When this was done, 12.7% reported high fear regarding this specific procedure, an increase compared to the 5.5% of those with high fear towards dental treatment in general.
Table 8A.
Level of Dental Fear Related to Endodontics
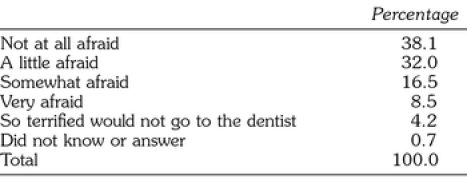
Table 8B.
Level of Dental Fear Relate11:15:04 AMd to Endodontic Treatment Grouped by Low or High Fear

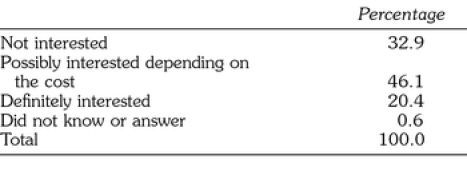
The respondents were then presented with the same scenario of severe pain and need for endodontics, but now with the availability of sedation or GA. The results, as shown in Table 9, were that 20.4% were “definitely interested” in sedation or GA, an increase from the 12.4% definitely interested when asked regarding dental treatment in general.
Table 9.
Interest in Sedation or General Anesthesia for Endodontics
With the availability of sedation or GA for this root canal treatment, respondents were assessed regarding level of fear. The results, as seen in Table 10A and B, show that the high fear group dropped to 5.4% compared with 12.7% when sedation or GA were not available. Of those 12.7% with high fear when faced with a root canal, 73.2% of them then reported themselves as having no or a low level of fear when the option of sedation or GA was offered for the procedure (Table 10C). There is a significant difference between these 2 groups (chi-square, P < 0.001).
Table 10A.
Level of Dental Fear Related to Endodontic Treatment with Sedation or General Anesthesia
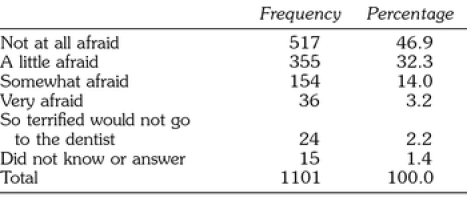
Table 10B.
Level of Dental Fear Related to Endodontic Treatment with Sedation or General Anesthesia, Grouped by Low or High Fear

Table 10C.
Level of Dental Fear Related to Root Canal Treatment with Sedation or General Anesthesia, Grouped by Level of Fear of Endodontic Treatment

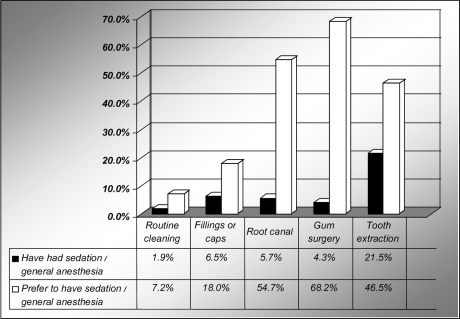
The prevalence and preference for sedation or GA was then assessed. When asked if they had ever had sedation or GA for a dental procedure, 29.1% of the respondents answered positively. These same respondents were then read a list of 5 dental procedures in order to identify those for which they had received sedation or GA, with the results shown in the Figure. They were then asked if they would prefer to have sedation or GA for each of these same procedures. As seen in the Figure, there were large increases in preference compared to prevalence for each procedure. These increases were 3.8-fold for cleaning; 2.8-fold for fillings or caps; 9.6-fold for root canal; 15.9-fold for periodontal surgery; and 2.2-fold for extraction. The preference for sedation or GA was significantly greater than the current prevalence for each given dental procedure (binomial test, P < 0.001).
Comparison of the prevalence with the preference of sedation or GA for each of the listed dental procedures.
Discussion
This is the first published study investigating fear and anxiety in Canada on a national level. The results are consistent with those found internationally. The 5.5% in the high fear group is within the range of other reported studies from Canada and Europe, although somewhat lower compared to the studies done in Asia and the United States. Possible explanations for this apparent discrepancy include the different anxiety scales used to determine high fear and this study did not include the edentulous population. It has been shown that the edentulous tend to have a higher level of dental fear than the dentate population.4,21
Milgrom's single-item scale2 was used in this study because of its simplicity and having a good correlation to Corah's DAS.8 It was shown that 2.0% of the respondents felt very afraid while 3.5% felt terrified. In grouping the very afraid and the terrified into a high fear group, the total in this study is 5.5%. If the “somewhat afraid” group had been included, as Milgrom advises,2 the total for the high fear group would be 15.3%. However, according to Moore,8 those that indicate that they are “very afraid” or “terrified” correlate well with those that score 15 or above on Corah's DAS as well as with those who scored between 8 to 10 on Gatchel's FS. It was decided in this study to take the more restrictive approach as described, with fewer being considered in the “high fear” group.
The finding that females were more than 2.5 times more likely to report themselves as having a high level of dental fear is consistent with the majority of published reports,2,7,8,15,20,27,36,37 although others have indicated there is no difference between gender and dental fear.16,21 When the level of dental fear was compared to those with or without dental insurance coverage it was shown that there was no difference, similar to the findings of Milgrom in a survey of Seattle residents.2 This shows that even though an individual is covered by dental insurance, a dental appointment may still be either missed, cancelled or avoided because of fear or anxiety.
The presence of fear appears related to avoidance. Almost half (49.2%) of those who were in the high fear group had either missed, cancelled or avoided a dental appointment because of fear or anxiety compared to only 5.2% of those in the no or low fear group. The finding that almost 64.3% of those with avoidance patterns self-reported themselves as having no or a low level of dental fear could be due to a number of reasons. The cutoff point separating the high fear group from the no or low fear group may have been set too high or there may be a general underestimation or denial of one's own level of dental fear.
Using the expanded weighting that was provided by SOM, calculated using the demographics of this study and compared to the Canadian census of 2001, the results may be extrapolated to the dentate Canadian population of 18 years of age and older. This represents over 20,000,000 Canadian adults (20,127,558). Extrapolation of these data show that over 400,000 people (402,551) did not visit the dentist in this past year because of dental fear or anxiety. Over 1.5 million people (1,529,694) have at one time missed, cancelled or avoided a dental appointment due to fear or anxiety.
Based on the similarity in the prevalence of fear, anxiety and avoidance internationally, we may make the assumption that the prevalence is similar in the US as in Canada, acknowledging that such an extrapolation has its limitations. The US Census Bureau estimated that there were over 211,000,000 persons 18 years and over in the US as of July 2003.38 If we extrapolate the percentages found in this study to the US adult population, we find that fear or anxiety has been the reason why over 15,000,000 Americans have missed, cancelled or avoided a dental appointment, with over 4,000,000 Americans avoiding the dentist for this reason in the past year alone.
This is also the first published study of the Canadian population's demand for sedation or GA for dentistry. The question assessing demand for sedation or GA for dentistry made it clear that the procedure was to take place in a dental office as opposed to a hospital. The description of sedation made it clear that it was parenteral as opposed to oral or inhalational. Therefore the results should be assessed within this context.
The 12.4% that were definitely interested in sedation or GA is consistent with the results of previously reported surveys.12,22,31 When combined with those who may be interested in this service depending on the cost, Table 7 shows that over half of the adult population is interested. If these results are extrapolated to the dentate Canadian population of 18 years of age and older (20,127,558), it may be seen that approximately 2,500,000 are definitely interested in sedation or GA for dentistry and over 8,500,000 are interested depending on the cost.
It is noteworthy that 11.4% of those in the no or low fear group were definitely interested in sedation or GA and 42.3% interested depending on cost, as shown in Table 7. This suggests that either the respondents underestimated their dental fear level or that the demand to have sedation or GA for dentistry encompasses other reasons besides fear or anxiety. One may speculate that this could be for such things as overall comfort, anticipation of prolonged dental procedures, or for those with severe gagging reflexes.
The question describing the presence of pain with need for a root canal was used as it was assumed that this may be a procedure that many consider aversive. In this case the proportion of those in the high fear group more than doubled, 12.7% vs. 5.5%, compared with fear of dentistry in general. With the availability of sedation or GA, the high fear group dropped from 12.7% down to 5.4%. The cross-tabulation shown in Table 10 demonstrates that of those who self-reported a high fear level with the thought of having a root canal, 73.2% shifted into the no or low fear group when faced with the thought of a root canal with sedation or GA. Conversely, of those who previously had no or low fear towards having a root canal done, 2.4% switched into the high fear group at the prospect of having a root canal carried out with sedation or GA. There could be a number of reasons to explain this finding. These include previous negative experiences with sedation or GA or fear of anesthesia itself. If an individual has had previous negative experiences such as nausea or vomiting, this may make a choice for sedation or GA less likely. Therefore these results suggest that the patient's preference for sedation or GA may change depending on the procedure performed. As well, fear and anxiety are lowered with the availability of sedation or GA for dental treatment.
In an attempt to gauge the preference of the public for sedation or GA for different dental procedures, the broad scope of dentistry was simplified into 5 procedures with varying degrees of invasiveness. In order to quantify the preference for sedation or GA in dentistry it was considered important to first assess the prevalence that currently exists within the profession. The second step was to assess the level of preference for sedation or GA in dentistry and compare it to the current prevalence level.
The results, as shown in the Figure, showed a substantial increase in the preference for sedation or GA from the current prevalence for all 5 dental procedures. The ratio of prevalence to preference for sedation or GA for tooth extraction was the smallest of all of the dental procedures. This should not be surprising considering that oral and maxillofacial surgeons are trained to administer parenteral sedation and GA. Nevertheless, it can be seen that even with this training, less than half of those who wish to have sedation or GA for extractions have actually had it (21.5% vs 46.5%). The preference for sedation or GA for endodontics and periodontal surgery were much higher than originally anticipated. It is also noteworthy that even for the relatively non-invasive procedure of cleaning, 3.8 times as many people would prefer sedation or GA than are receiving it. For all of the procedures assessed, the large differences in prevalence and preference suggest that there is a large unmet demand for these services.
As calculated above, if we extrapolate these data to the adult dentate Canadian population, over 4,000,000 Canadians are definitely interested in sedation or GA when in severe pain and in need for endodontics and over 9,000,000 are interested depending on the cost.
As above, extrapolation of these results to the US population may be considered. The US Census Bureau estimated that there were over 211,000,000 persons 18 years and over in the US as of July 2003.38 If we extrapolate the percentages found in this study to the US adult population, we see that approximately 25,000,000 Americans would be definitely interested in sedation or GA for dentistry and approximately 85,000,000 Americans would be interested depending on the cost. Over 40,000,000 Americans would be definitely interested in sedation or GA when in severe pain and needing a root canal treatment, with over 90,000,000 Americans interested depending on the cost.
In conclusion, this study shows that there is significant fear and anxiety in dentistry in the Canadian adult population, at levels similar to those found internationally. Its presence leads to patients avoiding dental treatment, thereby jeopardizing their ability to optimize their oral health. These results are also consistent with the contention that there is need and demand for sedation and GA services for dentistry. Therefore, it can be concluded that the evidence shows that there is both significant need and significant demand for sedation and anesthesia services for dentistry.
Acknowledgments
This study was funded by the Anesthesia Research Foundation (ARF) of the American Dental Society of Anesthesiology, the Ontario Dental Society of Anaesthesiology, and the University of Toronto Faculty of Dentistry. The results of this study were originally presented in June 2003 at the International Association of Dental Research Meeting in Goteborg, Sweden and at the ARF Workshop on Enteral Sedation in Dentistry in October, 2003. This report is based, in part, on a thesis submitted by Dr Chanpong in conformity with the requirements for the Master of Science in dental anesthesia at the University of Toronto.
References
- Gatchel RJ, Ingersoll BD, Bowman L, Robertson MC, Walker C. The prevalence of dental fear and avoidance: a recent survey study. J Am Dent Assoc. 1983;107(4):609–610. doi: 10.14219/jada.archive.1983.0285. [DOI] [PubMed] [Google Scholar]
- Milgrom P, Fiset L, Melnick S, Weinstein P. The prevalence and practice management consequences of dental fear in a major US city. J Am Dent Assoc. 1988;116(6):641–647. doi: 10.14219/jada.archive.1988.0030. [DOI] [PubMed] [Google Scholar]
- Gatchel RJ. The prevalence of dental fear and avoidance: expanded adult and recent adolescent surveys. J Am Dent Assoc. 1989;118(5):591–593. doi: 10.14219/jada.archive.1989.0068. [DOI] [PubMed] [Google Scholar]
- Stouthard ME, Hoogstraten J. Prevalence of dental anxiety in The Netherlands. Comm Dent Oral Epidemiol. 1990;18(3):139–142. doi: 10.1111/j.1600-0528.1990.tb00039.x. [DOI] [PubMed] [Google Scholar]
- Teo CS, Foong W, Lui HH, Vignehsa H, Elliott J, Milgrom P. Prevalence of dental fear in young adult Singaporeans. Int Dent J. 1990;40(1):37–42. [PubMed] [Google Scholar]
- Domoto PK, Weinstein P, Melnick S, et al. Results of a dental fear survey in Japan: implications for dental public health in Asia. Comm Dent Oral Epidemiol. 1988;16(4):199–201. doi: 10.1111/j.1600-0528.1988.tb01753.x. [DOI] [PubMed] [Google Scholar]
- Hakeberg M, Berggren U, Carlsson SG. Prevalence of dental anxiety in an adult population in a major urban area in Sweden. Comm Dent Oral Epidemiol. 1992;20(2):97–101. doi: 10.1111/j.1600-0528.1992.tb00686.x. [DOI] [PubMed] [Google Scholar]
- Moore R, Birn H, Kirkegaard E, Brodsgaard I, Scheutz F. Prevalence and characteristics of dental anxiety in Danish adults. Comm Dent Oral Epidemiol. 1993;21(5):292–296. doi: 10.1111/j.1600-0528.1993.tb00777.x. [DOI] [PubMed] [Google Scholar]
- Weinstein P, Shimono T, Domoto P, et al. Dental fear in Japan: Okayama Prefecture school study of adolescents and adults. Anesth Prog. 1993;39(6):215–220. [PMC free article] [PubMed] [Google Scholar]
- Ronis DL. Updating a measure of dental anxiety: reliability, validity, and norms. J Dent Hygiene. 1994;68(5):228–233. [PubMed] [Google Scholar]
- Hagglin C, Berggren U, Hakeberg M, Ahlqwist M. Dental anxiety among middle-aged and elderly women in Sweden. A study of oral state, utilisation of dental services and concomitant factors. Gerodontology. 1996;13(1):25–34. doi: 10.1111/j.1741-2358.1996.tb00147.x. [DOI] [PubMed] [Google Scholar]
- Dionne RA, Gordon SM, McCullagh LM, Phero JC. Assessing the need for anesthesia and sedation in the general population. J Am Dent Assoc. 1998;129(2):167–173. doi: 10.14219/jada.archive.1998.0173. [DOI] [PubMed] [Google Scholar]
- Doerr PA, Lang WP, Nyquist LV, Ronis DL. Factors associated with dental anxiety. J Am Dent Assoc. 1998;129(8):1111–1119. doi: 10.14219/jada.archive.1998.0386. [DOI] [PubMed] [Google Scholar]
- Kaakko T, Milgrom P, Coldwell SE, Getz T, Weinstein P, Ramsay DS. Dental fear among university students: implications for pharmacological research. Anesth Prog. 1998;45(2):62–67. [PMC free article] [PubMed] [Google Scholar]
- Ragnarsson E. Dental fear and anxiety in an adult Icelandic population. Acta Odontologica Scandinavica. 1998;56(2):100–104. doi: 10.1080/00016359850136067. [DOI] [PubMed] [Google Scholar]
- Thomson WM, Locker D, Poulton R. Incidence of dental anxiety in young adults in relation to dental treatment experience. Comm Dent Oral Epidemiol. 2000;28(4):289–294. doi: 10.1034/j.1600-0528.2000.280407.x. [DOI] [PubMed] [Google Scholar]
- Smith TA, Heaton LJ. Fear of dental care. Are we making any progress. J Am Dent Assoc. 2003;134:1101–1108. doi: 10.14219/jada.archive.2003.0326. [DOI] [PubMed] [Google Scholar]
- Tasman A, Kay J, Lieberman JA. Psychiatry. Philadelphia, PA: WB Saunders Co; 1997. [Google Scholar]
- Task Force on DSM-IV APA. Diagnostic and Statistical Manual of Mental Disorders: DSM-IV-TR. 4th ed. Washington, DC: American Psychiatric Association; 2000. [Google Scholar]
- Domoto P, Weinstein P, Kamo Y, Wohlers K, Fiset L, Tanaka A. Dental fear of Japanese residents in the United States. Anesth Prog. 1991;38(3):90–95. [PMC free article] [PubMed] [Google Scholar]
- Locker D, Liddell A, Burman D. Dental fear and anxiety in an older adult population. Comm Dent Oral Epidemiol. 1991;19(2):120–124. doi: 10.1111/j.1600-0528.1991.tb00125.x. [DOI] [PubMed] [Google Scholar]
- Taani DSMQ. Dental fear among a young adult Saudian population. Int Dent J. 2001;51:62–66. doi: 10.1002/j.1875-595x.2001.tb00823.x. [DOI] [PubMed] [Google Scholar]
- Locker D, Shapiro D, Liddell A. Who is dentally anxious? Concordance between measures of dental anxiety. Comm Dent Oral Epidemiol. 1996;24(5):346–350. doi: 10.1111/j.1600-0528.1996.tb00874.x. [DOI] [PubMed] [Google Scholar]
- Newton JT, Buck DJ. Anxiety and pain measures in dentistry: a guide to their quality and application. J Am Dent Assoc. 2000;131(10):1449–1457. doi: 10.14219/jada.archive.2000.0056. [DOI] [PubMed] [Google Scholar]
- Corah NL. Development of a dental anxiety scale. J Dent Res. 1969;48(4):596. doi: 10.1177/00220345690480041801. [DOI] [PubMed] [Google Scholar]
- Kleinknecht RA, Thorndike RM, McGlynn FD, Harkavy J. Factor analysis of the dental fear survey with cross-validation. J Am Dent Assoc. 1984;108(1):59–61. doi: 10.14219/jada.archive.1984.0193. [DOI] [PubMed] [Google Scholar]
- Spielberger C, Gorsuch R, Lushene R. STAI manual for the State-Trait Anxiety Inventory. Palo Alto, Calif: Consulting Psychologists Press; 1983. [Google Scholar]
- Milgrom P. Behavioral methods and research issues in the management of the adult dental patient. Anesth Prog. 1986;33(1):5–9. [PMC free article] [PubMed] [Google Scholar]
- Locker D, Shapiro D, Liddell A. Negative dental experiences and their relationship to dental anxiety. Comm Dent Health. 1996;13(2):86–92. [PubMed] [Google Scholar]
- Milgrom P, et al. Treating Fearful Patients: A Patient Management Handbook. Reston, Va: 1985. [Google Scholar]
- Lindsay SJE, Humphris G, Barnby GJ. Expectations and preferences for routine dentistry in anxious adult patients. Br Dent J. 1987;163:120–124. doi: 10.1038/sj.bdj.4806218. [DOI] [PubMed] [Google Scholar]
- Neter J, Wasserman W, Whitmore GA. Applied Statistics. 4th ed. New York, NY: Allyn and Bacon; 1993. [Google Scholar]
- Kish L. Survey Sampling. New York, NY: J Wiley; 1965. [Google Scholar]
- Ministry of Industry. Household Facilities and Equipment. Ottawa, Ontario, Canada: Statistics Canada; 1997. [Google Scholar]
- Groves RM, Kahn RL. Surveys by Telephone: A National Comparison with Personal Interviews. Boston, Mass: Academic Press, Inc; 1979. [Google Scholar]
- Stouthard ME, Hoogstraten J. Ratings of fears associated with twelve dental situations. J Dent Res. 1987;66(6):1175–1178. doi: 10.1177/00220345870660061601. [DOI] [PubMed] [Google Scholar]
- Liddell A, Locker D. Gender and age differences in attitudes to dental pain and dental control. Comm Dent Oral Epidemiol. 1997;25(4):314–8. doi: 10.1111/j.1600-0528.1997.tb00945.x. [DOI] [PubMed] [Google Scholar]
- U.S. Census. Available at http://www.census.gov/population/projections/nation/sumary/np-t3-b.pdf. 2003. Accessed Janaury 21, 2005.


