Abstract
AIMS
The aims of the study were 1) to evaluate the pharmacokinetics of nicorandil in healthy subjects and acute heart failure (AHF) patients and 2) to evaluate the exposure-response relationship with pulmonary arterial wedge pressure (PAWP) in AHF patients and to predict an appropriate dosing regimen for nicorandil.
METHODS
Based on the data from two healthy volunteer and three AHF patient studies, models were developed to characterize the pharmacokinetics and pharmacodynamics of nicorandil. PAWP was used as the pharmacodynamic variable. An asymptotic exponential disease progression model was used to account for time dependent changes in PAWP that were not explained by nicorandil exposure. The modelling was performed using NONMEM version V.
RESULTS
The pharmacokinetics of nicorandil were characterized by a two-compartment model with linear elimination. CL, V1 and V2 in AHF patients were 1.96, 1.39 and 4.06 times greater than in healthy subjects. Predicted plasma concentrations were assumed to have an immediate concentration effect relationship on PAWP. An inhibitory Emax model with Emax of −11.7 mmHg and EC50 of 423 µg l−1 was considered the best relationship between nicorandil concentrations and PAWP. PAWP decreased independently of nicorandil exposure. This drug independent decline was described by an asymptotic decrease of 6.1 mmHg with a half-life of 5.3 h.
CONCLUSIONS
AHF patients have higher clearance and initial distribution volume of nicorandil compared with healthy subjects. The median target nicorandil concentration to decrease PAWP by 30% is predicted to be 748 µg l−1, indicating that a loading dose of 200 µg kg−1 and a maintenance dose of 400 µg kg−1 h−1 would be appropriate for the initial treatment of AHF.
WHAT IS ALREADY KNOWN ABOUT THIS SUBJECT
Nicorandil injection is used for unstable angina and for acute heart failure in Japan.
The pharmacokinetics of nicorandil following oral administration have been described in healthy subjects.
WHAT THIS STUDY ADDS
This paper describes the differences in nicorandil pharmacokinetics between healthy subjects and acute heart failure patients.
A population pharmacokinetic-pharmacodynamic model for nicorandil in acute heart failure patients is described using pulmonary artery wedge pressure as the biomarker.
A rational guide for initial dosing of nicorandil to achieve a target effect on pulmonary artery wedge pressure was based on pharmacokinetic and pharmacodynamic principles.
Keywords: acute heart failure, disease progression, NONMEM, pharmacodynamics, pharmacokinetics, pulmonary wedge pressure
Introduction
Acute heart failure (AHF) is associated with low cardiac output, tissue hypoperfusion, high pulmonary arterial wedge pressure (PAWP) and peripheral congestion. Vasodilators are used as first line therapy to improve the peripheral circulation and lower preload when hypoperfusion is associated with decreased blood pressure, signs of congestion and low diuresis [1].
The tablet formulation of nicorandil is widely used as an antianginal agent in European and Asian countries. In addition, nicorandil injection has been used for unstable angina in Japan and Korea. In a canine model, nicorandil has been shown to decrease left ventricular end diastolic pressure and increase cardiac output via both a nitrate like action (via an increase in cGMP) and the opening of ATP sensitive potassium channels [2]. In the treatment of patients with AHF, nicorandil reduces preload and afterload, and therefore the haemodynamic response. In comparison with nitrates, no tachyphylaxis has been reported with nicorandil [3, 4]. The pharmacokinetics after oral and IV administration are described elsewhere [5]. There are no known major active metabolites of nicorandil.
The immediate goal in AHF is to improve symptoms and stabilize the haemodynamic condition (e.g. by a decrease in PAWP and increase in cardiac output and/or stroke volume). While a change in cardiac output is dependent on the differential effects of vasodilators on arterial and venous tone, PAWP is independently reduced by both mechanisms. Therefore, PAWP is an important endpoint for the evaluation of the therapeutic benefit of nicorandil.
The objectives of this pharmacokinetic-pharmacodynamic (PKPD) analysis were to determine the relationship between plasma nicorandil exposure and the PAWP response in AHF patients, and use the resulting model to propose an appropriate initial dosage regimen.
Methods
The Institutional Research Review Committee approved all study protocols and informed consent was obtained from each patient prior to the trial. All studies were conducted according to the Declaration of Helsinki and Good Clinical Practice (GCP).
Study designs
This present pharmacokinetic analysis was performed using five clinical studies, including two studies in healthy volunteers and three studies in AHF patients including acute exacerbation of chronic heart failure (Table 1).
Table 1.
Summary of patient characteristics at each study
| Study | Bolus injection study | Bolus injection + infusion study | Bolus injection study | Bolus injection + infusion study | Long term infusion study |
|---|---|---|---|---|---|
| Healthy volunteers | Healthy volunteers | Patients | Patients | Patients | |
| n | 5 | 6 | 28 | 46 | 20 |
| Number of observation | 105 | 175 | 159 | 79 | 100 |
| Dose | 6, 12, 18, 24 mg | Bolus: 12 mg Infusion: 6, 9, 12 mg h−1 for 235 min | 4, 8, 12, 18 mg | Bolus: 200 µg kg−1Infusion: 50–200 µg kg−1 for 24 h | Bolus: 200 µg kg−1Infusion: 50–200 µg kg−1 for 48 h |
| Demographics | |||||
| Age (years) | 33.0 ± 7.7 | 41.2 ± 5.9 | 62.8 ± 12.8 | 65.1 ± 11.5 | 70.8 ± 8.4 |
| Weight (kg) | 62.6 ± 8.6 | 63.6 ± 6.4 | 58.6 ± 11.3 | 60.3 ± 10.7 | 61.8 ± 10.2 |
| Sex | |||||
| Male | 5 | 6 | 21 | 30 | 14 |
| Female | 0 | 0 | 7 | 16 | 6 |
| NYHA classification | |||||
| II | – | – | 3 | 10 | 4 |
| III | – | – | 10 | 12 | 6 |
| IV | – | – | 15 | 24 | 10 |
| PAWP at predose (mmHg) | – | – | 25.9 ± 6.4 | 26.9 ± 6.3 | 27.2 ± 7.4 |
| CI at predose (l min−1 m−2) | – | – | 2.52 ± 0.70 | 2.47 ± 0.88 | 2.22 ± 0.43 |
| Cause | |||||
| Ischaemic heart disease | – | – | 11 | 16 | 6 |
| Valvular heart disease | – | – | 6 | 14 | 2 |
| Hypertensive heart disease | – | – | 4 | 7 | 2 |
| Dilaed cardiomyopathy | – | – | 7 | 9 | 6 |
Data are shown as mean ± SD.
Bolus injection study for healthy volunteers
The primary objective of this study was to determine the safety, tolerability, and pharmacokinetic profile of nicorandil in healthy male subjects. Six healthy volunteers were enrolled into a single bolus injection study, which was designed as a single-blind, ascending dose study. Nicorandil was administrated intravenously at a dose of 6, 12, 18 or 24 mg over 5 min. Every subject was administered four doses of nicorandil. One subject dropped out after the first dosing because of SA node block, which was judged not to be related to nicorandil.
Bolus injection and infusion study for healthy volunteers
The primary objective of this study was to determine the safety, tolerability, and pharmacokinetic profile of nicorandil in healthy male subjects during and after infusion. Nine healthy volunteers were enrolled in a single-blind, ascending dose combination study of a rapid ‘bolus’ injection followed by a constant rate infusion. Nicorandil (12 mg) was injected over 5 min followed by an infusion rate of 6, 9 or 12 mg h−1 of nicorandil for 235 min. Two subjects dropped out one because of an increase in erythrocyte sedimentation rate and fever as adverse events and the other withdrew voluntarily.
Bolus injection study for AHF patients
This was an open-label non-randomized study designed to assess the safety, tolerability, and pharmacokinetics of intravenously administered nicorandil following bolus injection doses in AHF patients. Patients with AHF were enrolled if they satisfied the following inclusion criteria: (i) PAWP or diastolic pulmonary arterial pressure, if PAWP was impossible to measure, was higher than 18 mmHg and was stable for at least 15 min, (ii) age between 20 and 79 years old. Twenty-eight patients were separated into four cohorts (4, 8, 12 and 18 mg) and administered nicorandil. The bolus injection was administered over 1 to 5 min.
Bolus injection and infusion study for AHF patients
This was an open-label non-randomized study designed to assess the safety, tolerability, and pharmacokinetics of nicorandil administrated by infusion following bolus injection in AHF patients. Patients with AHF were enrolled if they satisfied the following inclusion criteria: (i) PAWP or diastolic pulmonary arterial pressure, if PAWP was impossible to measure, higher than 18 mmHg, (ii) age between 20 and 79 years old. A total of 46 patients were divided into five groups: a bolus injection of 200 µg kg−1 nicorandil was injected followed by infusion at a rate of 50, 100, 150, 200 or 250 µg kg−1 h−1. The bolus injection was administered over 5 min, and infusion was performed for 6 or 24 h, if possible.
Treatment with digitalis glycosides and fluid transfusion continued without changing the dosage during the study. Vasodilators, diuretics, inotropic agents, sulfonyl-urea, hypoglycaemic agents and all other concomitant medications were withheld during both studies.
Long-term infusion study
This was an open-label non-randomized study designed to assess the safety, tolerability, and pharmacokinetics during long-term infusion of nicorandil following bolus doses in AHF patients. Patients with AHF were enrolled if they satisfied the following inclusion criteria: (i) PAWP or diastolic pulmonary arterial pressure, if PAWP was impossible to measure, higher than 15 mmHg, (ii) age over 20 years old. Twenty-three patients with AHF were administered nicorandil intravenously at a dose of 200 µg kg−1 over 5 min followed by a continuous infusion at a rate of 200 µg kg−1 h−1 for 48 h. Concomitant medications were allowed to be used during the study except for oral doses of nicorandil and sildenafil citrate.
Collection of blood samples
Bolus injection study for healthy volunteers
Blood samples were collected at predose and at 5, 15, 30 min, 1, 2, 4, 5, 8, 12, 24 h after the dose in single bolus injection dose study.
Bolus injection and continuous infusion study for healthy volunteers
Blood samples were collected at predose and at 5, 15, 30 min, 1, 2, 4, 4.5, 8, 12, 24 h after the dose in the bolus injection plus infusion dose study.
Bolus injection study for AHF patients
Blood samples were collected at predose and 0.25, 0.5, 1, 1.5, 2 and 3 h after the dose in the single bolus injection dose study except for the dose of 18 mg when samples collected at predose and at 0.25, 0.5 and 1 h after the dose. PAWP was measured at the same time as blood sampling in the bolus injection dose study.
Bolus injection and continuous infusion study for AHF patients
In the combined bolus injection plus infusion study, blood samples were collected at predose and 1 and 6 h. PAWP was measured predose and at 0.25, 0.5, 1, 2, 4 and 6 h.
Long-term infusion study
Blood samples were collected at predose and 2, 6, 12, 24, 48 h after start of dose. PAWP was measured at 2, 24 and 48 h.
Assay of nicorandil in plasma
Nicorandil in plasma was quantified by HPLC [6]. For all studies except for the long-term infusion study, the lower limit of quantification (LLOQ) was 3 ng ml−1 (defined by the coefficient of variation of replicate samples less than 20%). The within day coefficient of variation of the assay ranged from 10.12% (3 ng ml−1) to 2.55% (100 ng ml−1). Nicorandil in plasma was measured at Mitsubishi Kagaku Bio-Clinical Laboratories, Inc (Tokyo, Japan) and Chugai Pharmaceutical Co., Ltd. (Tokyo, Japan).
For the long-term infusion study, a slightly modified assay method for determination of nicorandil concentrations in plasma was applied because the solid phase extraction column was no longer obtainable. This method was developed by Japan Clinical Laboratories, Inc. (Osaka, Japan). By this method, the LLOQ was 5 ng ml−1 and the coefficient of variable (CV) value at the LLOQ was less than 15%. The within day CV of the assay ranged from 4.6% (5 ng ml−1) to 2.4% (1000 ng ml−1).
Both of those HPLC methods have almost the same recovery ratio. These are 76.6–89.8% in the concentration range of 3 ng ml−1 to 200 ng ml−1 for the first method and 78.8–80.0% in the range of 5 ng ml−1 to 1000 ng ml−1 for the modified method applied to the latest study, respectively.
Data below the LLOQ of plasma concentration were excluded from the population pharmacokinetic analysis.
Measurement of PAWP
PAWP was measured using a Swan-Ganz catheter. If for technical reasons it was not possible to measure PAWP then pulmonary arterial diastolic pressure was recorded instead.
Models
Model estimation
Nonlinear mixed effect models using NONMEM (Version V; GloboMax LLC, MD, USA) were developed to characterize the pharmacokinetics and pharmacodynamics of nicorandil in the healthy volunteer and patient population. All models were fitted using the first-order conditional estimation (FOCE) method with interaction. NONMEM was compiled by Intel Visual Fortran (Version 9; Intel Corporation, CA, USA) on a Windows XP operating system (Microsoft Corporation, WA, USA).
Fixed and random effect model building was performed based on the change in objective function and examination of the model predictions. The covariance between random effects was investigated.
A visual predictive check was performed by simulating 1000 virtual observations at each time point using the final model and its parameter estimates. Parameter uncertainty was evaluated by a non-parametric bootstrap procedure.
The pharmacokinetic model was developed separately and then used with fixed parameter values to explore the disease progression and pharmacodynamic models. The concentration observations were included in the data set even though the PK parameters were fixed (PPPD method [7]). The final models were tested with simultaneous estimation of all parameters. The simultaneous method was used for the bootstrap runs.
Pharmacokinetics of nicorandil
The duration of bolus injections and constant rate infusions of nicorandil were recorded on the case report form. It was assumed that the dose was infused at a constant rate over the recorded duration. Input was assumed to be zero-order with rate k0 calculated using the administered dose and infusion duration. A one compartment model with clearance (CL) and distribution volume (V1) and a two compartment model with clearance (CL), intercompartmental clearance (Q), central compartment volume (V1) and peripheral compartment volume (V2) were evaluated to describe nicorandil disposition.
Pharmacodynamics of the effect of nicorandil on PAWP
There was no clear evidence of a delay between PAWP changes and changes in plasma concentration (see Figure 6). Any delay was expected to be short because nicorandil acts on blood vessels so that the distributional delay from plasma to the extracellular fluid at the blood vessel calcium channel was expected to be at most a matter of minutes. The vasorelaxation effect of nicorandil occurs rapidly in vitro[8] so we did not expect this to introduce detectable delays in the observed response. Finally, intracellular responses e.g. cyclic GMP are typically occurring in seconds. Because all of these processes reach a new steady state quickly it may be difficult to detect a delay due to these mechanisms. An empirical effect compartment model was tested to estimate the magnitude of delay and see if it improved the ability to predict PAWP time course.
Figure 6.
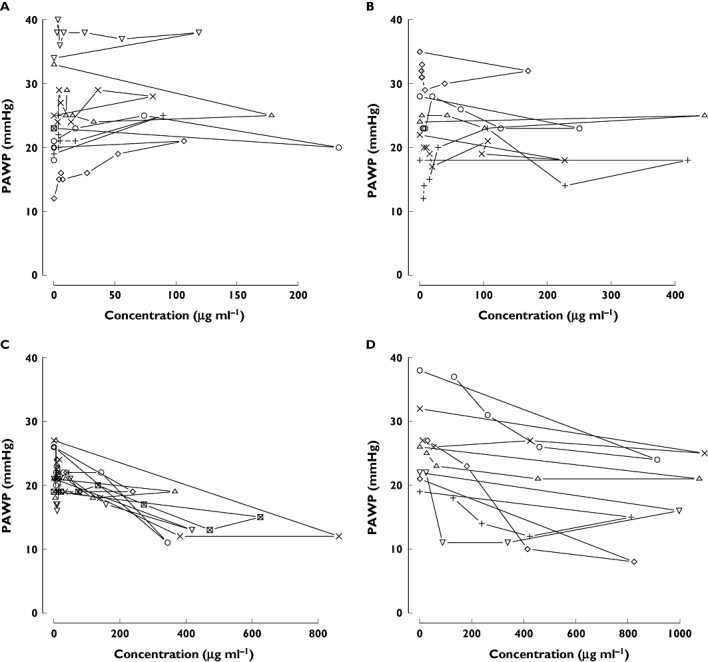
Concentration–effect (PAWP) plots of nicorandil. These data were obtained from a bolus injection study of patients with AHF. PAWP was measured using a Swan-Ganz catheter. Concentrations of nicorandil were measured by HPLC. Each plot shows individual data. Panels A, B, C, and D show a 4, 8, 12 and 18 mg kg−1 bolus dose of nicorandil
The interaction between nicorandil concentration, Ce(t), and change in PAWP was assumed to be determined immediately by plasma concentration or the predicted effect compartment concentration. Linear (Equation 1) and Emax models (Equation 2) were tested to see which gave the better fit.
| (1) |
 |
(2) |
Disease progression
Two models were evaluated to describe changes in PAWP unrelated to nicorandil concentration. These models provided an empirical description of the time course of PAWP. Because PAWP is a biomarker for heart failure disease status we considered them disease progress models. The first model assumed that PAWP decreases linearly (linear model) over the duration of observation from a baseline value (S0) with slope α (Equation 3) [9].
The second model assumed an asymptotic exponential change (exponential model) in PAWP from a baseline to a new steady state value (SSS) with a time course described by a half-life of progression (Tprog). In both cases the effect of nicorandil was assumed to produce a time varying offset, PD(t), to the disease progression curve [9].
| (3) |
 |
(4) |
Covariate effects
Fixed effect models for between subject variability in parameters were used to predict group specific parameters from the population standard estimate [10]. Size differences were based on a standard weight of 70 kg. Differences in CL, Q, V1 and V2 were assumed to be explained in part by an allometric function of weight [11] e.g. Equation 5.
 |
(5) |
Differences in CL, Q, V1 and V2 between patients and healthy subjects were investigated using models such as equation 6. FCL is the fractional difference in clearance between patients with AHF and healthy subjects.
| (6) |
No other covariates were evaluated to describe differences between the subjects in these studies.
Random effects
Between subject and within subject variability in parameters
Population parameter variability (PPV) in pharmacokinetics and pharmacodynamics was described by assuming a log-normal distribution for random differences in parameters. PPV was partitioned between (BSV) and within (WSV) subject variability by estimating parameters within different occasions (see [12, 13] for details). An occasion was defined as each time a dose was given and followed by observations. The individual and occasion specific parameter for subject i on the kth occasion was obtained from the group parameter estimate. This is illustrated for CL in e quation 7.
| (7) |
The η random effects were assumed to arise from a normal distribution with mean 0 and standard deviation BSV for between subject variability and WSV for within subject variability. The variance of BSV and WSV was estimated. The covariance of BSV was estimated in order to describe the within individual correlation of random effects.
Residual unidentified variability in observations
Residual unidentified variability (RUV) for pharmacokinetic data was described by proportional (RUV_CV) and additive (RUV_SD) random differences of the observations from the predictions. RUV for pharmacodynamic data was described by additive random differences of the observations from predictions. The proportional component was predicted from the prediction for the jth observation in the ith individual (PREDi,j) (Equation 8). Both RUV_CV and RUV_SD were estimated from observations of nicorandil. Only RUV_SD was estimated from PAWP observations.
Between subject parameter variability in RUV was described by a random effect (η) which was assumed to arise from a normal distribution with mean 0 and standard deviation PPV_RUV [14]. A random effect (ε) for each observation was assumed to arise from a normal distribution with mean 0 and unit standard deviation.
 |
(8) |
Results
Demographics
Table 1 presents a summary of demographics in healthy volunteers and patients. Data were available from 105 subjects. Eleven healthy volunteers contributed nicorandil concentrations only. The data from healthy volunteers was used to establish the PK model of nicorandil. Ninety-four subjects contributed observations of nicorandil concentrations and PAWP. There were 618 nicorandil concentration observations and 559 PAWP observations.
Pharmacokinetics of nicorandil
Individual pharmacokinetic profiles of nicorandil after intravenous injection to healthy volunteers are shown in Figure 1 and those in AHF patients in Figure 2. The best final pharmacokinetic model was a two compartment model. Goodness of fit plots using the two compartment model and data from healthy subjects and AHF patients are shown in Figure 3. The results of the visual predictive check in AHF patients are shown in Figures 4 and 5. The visual predictive check simulations are based on all the infusion rates and durations in the observed patients. Because of the variety of doses and rates, the profile shown in the figures should only used to compare with the observed concentrations. It does not reflect any specific dosing regimen.
Figure 1.
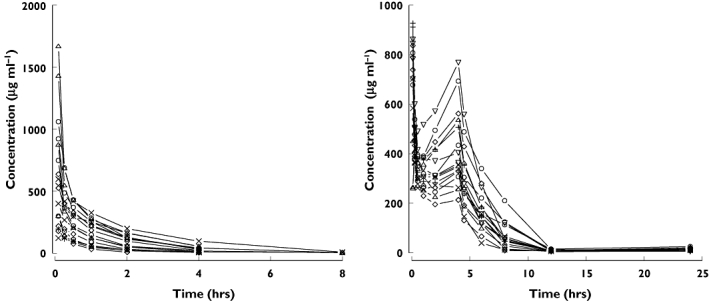
Individual plasma concentrations of nicorandil in healthy volunteers
Figure 2.
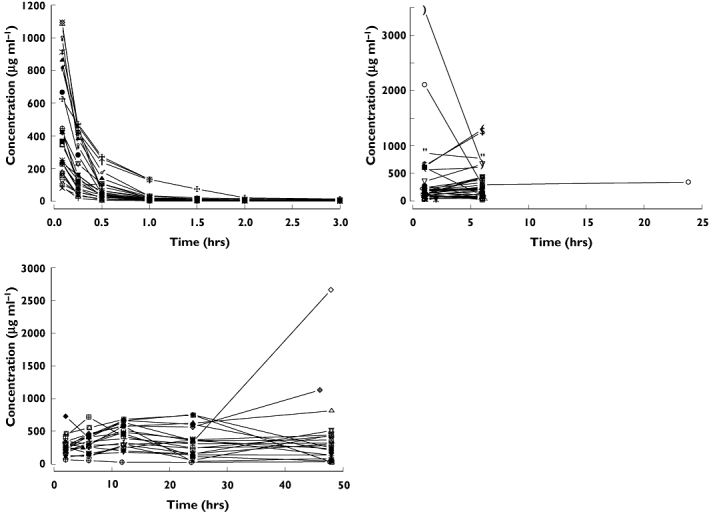
Individual plasma concentration profiles of nicorandil following administration to acute heart failure patients. Left upper panel: bolus injection of nicorandil at a dose of 4, 8, 12 and 18 mg kg−1. Right upper panel: 6 h or 24 h infusion of nicorandil at a dose of 50, 100, 150, 200 and 250 µg kg−1 h−1 following a bolus injection of nicorandil at a dose of 200 µg kg−1. Left lower panel: 48 h infusion of nicorandil at a dose of 200 µg kg−1 h−1 following a bolus injection of nicorandil at a dose of 200 µg kg−1
Figure 3.
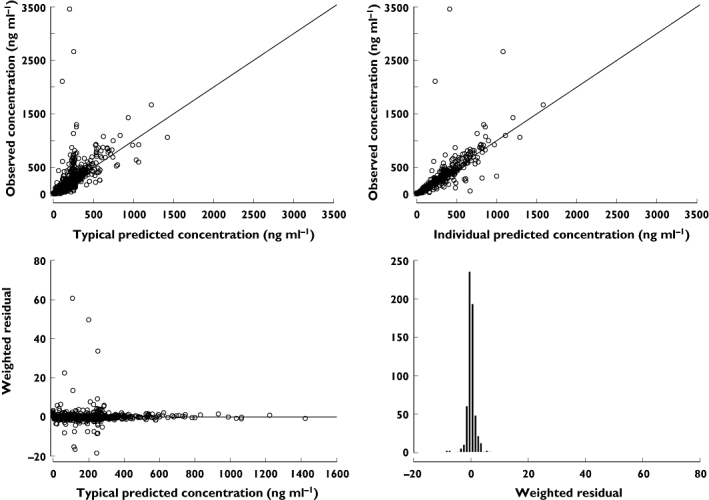
Goodness of fit plots under the final pharmacokinetic model for nicorandil. Lines in upper right and left panel show unity
Figure 4.
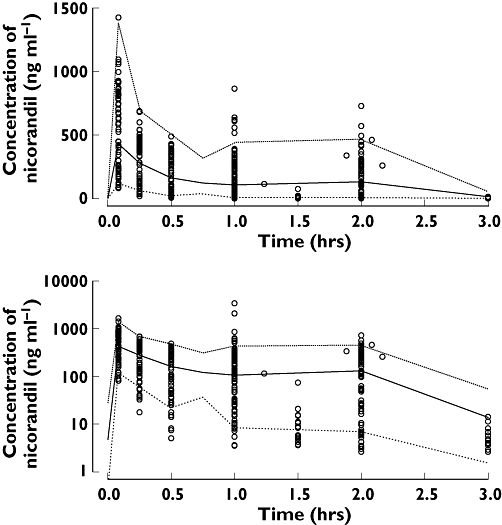
Visual predictive check of PKPD model 10 for nicorandil concentration in acute heart failure patients (symbols are observation, median is thick line, 90% prediction intervals are thin lines). Low ( ), median (
 ), high (
 ), observed (
 )
)
Figure 5.
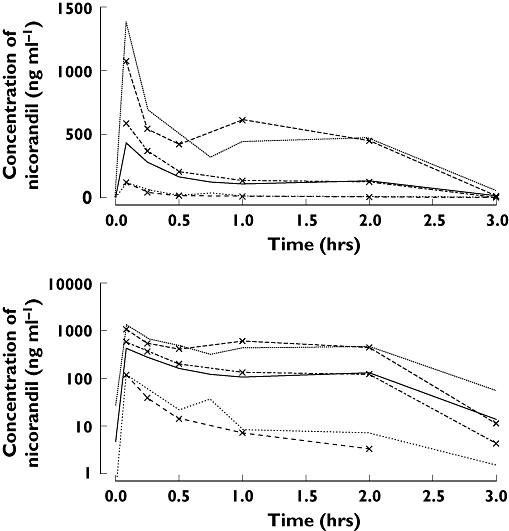
Visual predictive check of PKPD model 10 for nicorandil concentration in acute heart failure patients (lines with symbols are observations and without symbols are predictions; median is thick line, 90% prediction intervals are thin lines). Low ( ), median (
 ), high (
 ), OBS low (
 ), OBS median (
 ), OBS high (
 )
)
The clearance of nicorandil was nearly doubled in patients with AHF compared with healthy subjects (Table 2). The distribution volume of nicorandil in the central compartment was increased by 40% in AHF patients. Intercompartmental clearance of nicorandil was halved in AHF patients. The distribution volume of nicorandil in the peripheral compartment was four times greater in patients with AHF than in healthy subjects.
Table 2.
Pharmacokinetic and pharmacodynamic structural model parameter estimates for the effect of nicorandil on PAWP using model 10. Bootstrap coefficient of variation (standard deviation/median) and empirical 90% confidence interval
| Statistic | Description | Median | Units | CV % | Confidence interval | |
|---|---|---|---|---|---|---|
| 5% | 95% | |||||
| POP_S0 | Baseline PAWP | 25.6 | mmHg | 2.7 | 24.6 | 26.8 |
| POP_Sss | Steady state PAWP | 19.5 | mmHg | 10.0 | 16.5 | 22.7 |
| POP_TPROG | Progress half-life | 5.83 | h | 69.4 | 0.920 | 11.9 |
| POP_Emax | Maximum effect of nicorandil on PAWP | −11.7 | mmHg | 58.7 | −30.0 | −7.48 |
| POP_EC50 | Nicorandil concentration at 50% of Emax | 423 | µg l−1 | 107.1 | 165 | 1552 |
| POP_CL | Nicorandil clearance | 26.3 | l h−1 70 kg−1 | 13.5 | 21.9 | 31.5 |
| POP_V1 | Central volume of distribution | 18.1 | l 70 kg−1 | 14.8 | 14.9 | 23.3 |
| POP_Q | Intercompartmental clearance | 71.6 | l h−1 70 kg−1 | 76.9 | 54.5 | 203 |
| POP_V2 | Peripheral volume of distribution | 24.1 | l 70 kg−1 | 6.6 | 21.1 | 25.4 |
| FCL | Fractional CL change in heart failure | 1.94 | 25.0 | 1.03 | 2.63 | |
| FV1 | Fractional V1 change in heart failure | 1.39 | 17.0 | 1.05 | 1.81 | |
| FQ | Fractional Q change in heart failure | 0.519 | 42.8 | 0.192 | 0.891 | |
| FV2 | Fractional V2 change in heart failure | 4.06 | 219.1 | 1.83 | 25.3 | |
Pharmacodynamic analysis of nicorandil
The relationship between PAWP and plasma concentration of nicorandil is shown in Figure 6. The effect compartment half-life and its variability were estimated to be 2.2 min with very small between patient variability. The NONMEM run finished with rounding errors and less than three significant digits and an objective function fall of 8.9. It was decided that there was little evidence to support the additional complexity of a model for delay in onset of effect. We concluded that PAWP decreased rapidly after the administration of 12 or 18 mg kg−1 of nicorandil, with a negligible delay in PAWP response. The PAWP changes in individual subjects are shown in Figure 7. There was evidence that the achieved concentrations were approaching those required for maximum effect because the Emax model was preferred over the linear model based on improvement in the objective function (compare model 12 with model 11 in Table 3).
Figure 7.
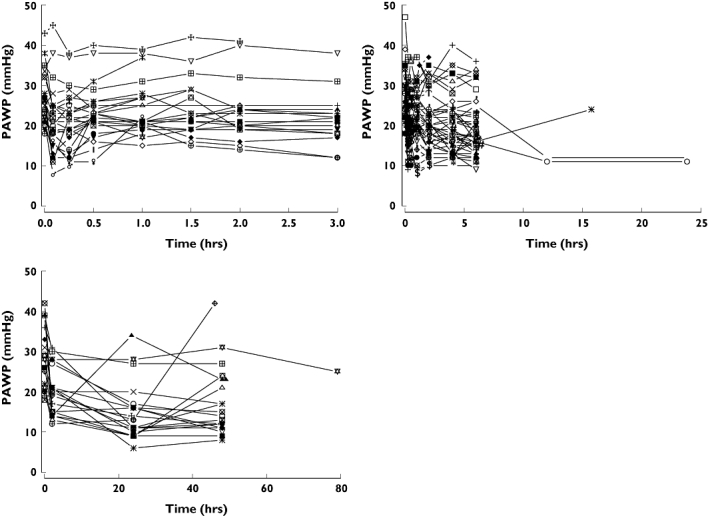
Individual PAWP profiles of nicorandil following administration to acute heart failure patients. Left upper panel: bolus injection of nicorandil at a dose of 4, 8, 12 and 18 mg kg−1. Right upper panel: 6 h or 24 h infusion of nicorandil at a dose of 50, 100, 150, 200 and 250 µg kg−1 h−1 following a bolus injection of nicorandil at a dose of 200 µg kg−1 h−1. Left lower panel: 48 h infusion of nicorandil at a dose of 200 µg kg−1 h−1 following a bolus injection of nicorandil at a dose of 200 µg kg−1
Table 3.
Model building table for nicorandil pharmacodynamics and disease progress
| Model | Disease progress | Drug effect | Random effects | Estimation | Obj | Sig |
|---|---|---|---|---|---|---|
| 10 | Exponential | Emax | Covariance of S0, SS, EC50 | Simultaneous | 7600.48 | 5.9 |
| 11 | Exponential | Emax | Covariance of S0, SS, EC50 | Sequential | 7601.34 | 6.5 |
| 12 | Exponential | Linear | Covariance of S0, SS, EC50 | Sequential | 7624.16 | 5.4 |
| 13 | Exponential | Emax | No covariance | Sequential | 7624.92 | 5.9 |
| 14 | Linear | Sigmoid Emax | Covariance of S0, alpha, Emax, EC50 | Sequential | 7634.66 | 6.6 |
| 15 | Linear | Emax | Covariance of S0, alpha, Emax, EC50 | Sequential | 7634.80 | 6.3 |
| 16 | Linear | Emax | No covariance | Sequential | 7639.33 | 5.9 |
| 17 | None | Emax | Covariance of S0, Emax, EC50 | Sequential | 7664.96 | . |
Obj, NONMEM objective function value; Sig, NONMEM estimate of minimum number of significant digits in the parameter estimates.
The between subject random effects were correlated. Inclusion of the covariance between S0, Sss, and EC50 improved the objective function (compare model 13 with model 11 in Table 3).
Allowing PAWP to vary with time, independently of nicorandil exposure, further improved the objective function (compare model 17 with model 16 in Table 3). An asymptotic disease progress model described the changes in PAWP better than a linear model (compare model 16 with model 13 in Table 3). The disease progression model predicted that PAWP changes slowly over the study observation period independently of nicorandil exposure. A change of 6.1 mmHg (S0-Sss) is the asymptotic prediction of the decrease in PAWP from baseline independent of nicorandil exposure.
The objective function did not change appreciably when both the PK and PD components were fitted simultaneously. Model 10 was considered the best PKPD model describing the nicorandil concentrations and response of PAWP.
For the final PKPD model the goodness of fit plots are shown in Figure 8 and the visual predictive check in Figures 9 and 10. Final parameter estimates calculated by a non-parametric boot strap method are shown in Table 2 and random effect parameters are shown in Table 4. The maximum predicted effect of nicorandil (Emax) was −11.7 mmHg and the nicorandil concentration at 50% of Emax was 423 µg ml−1.
Figure 8.
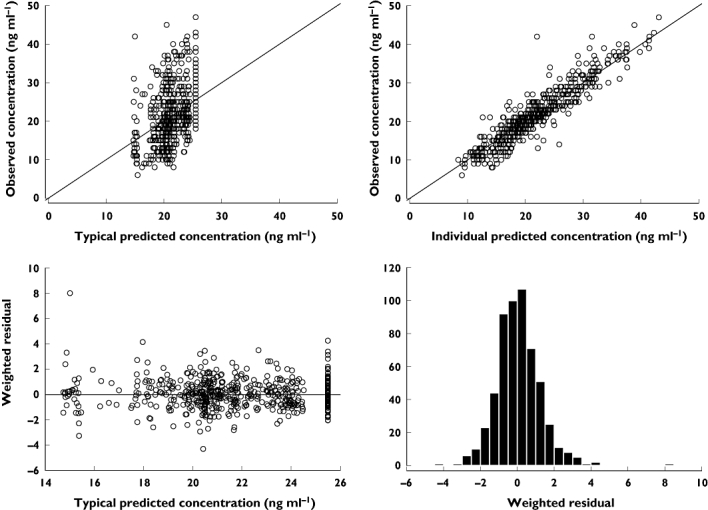
Goodness of fit plots for the final pharmacokinetic-pharmacodynamic model (model 10)
Figure 9.
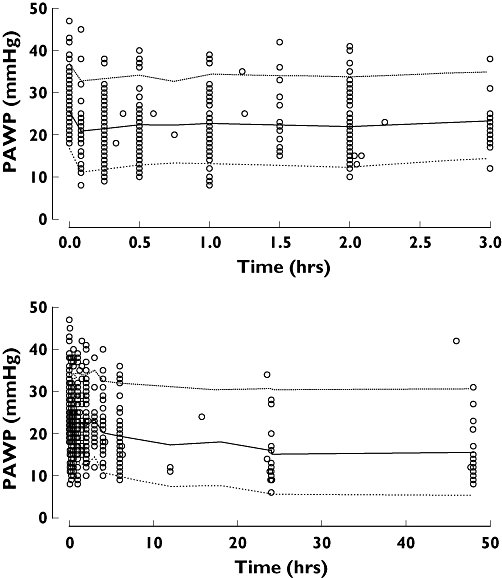
Visual predictive check of PKPD model 10 for PAWP in patients with acute heart failure (symbols are observations, median is thick line, 90% prediction intervals are thin lines). Low ( ), median (
 ), high (
 ), observed (
 )
)
Figure 10.
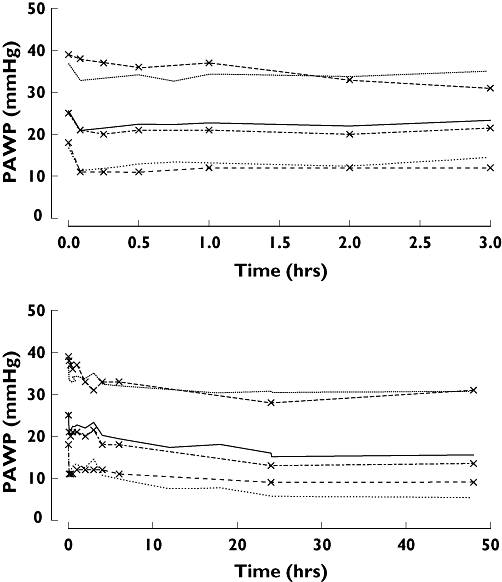
Visual predictive check of PKPD model 10 in patients with acute heart failure for PAWP (lines with symbols are observations and without symbols are predictions; median is thick line, 90% prediction intervals are thin lines). Low ( ), median (
 ), high (
 ), OBS low (
 ), OBS median (
 ), OBS high (
 )
)
Table 4.
Pharmacodynamic random effects model parameter estimates for the effect of nicorandil on PAWP using model 10. Bootstrap coefficient of variation (standard deviation/median) and empirical 90% confidence interval
| Statistic | Description | Median | CV % | Confidence interval | |
|---|---|---|---|---|---|
| 5% | 95% | ||||
| PPV_S0 | Population parameter variability in S0 | 0.210 | 8.5 | 0.180 | 0.238 |
| PPV_Sss | Population parameter variability in Sss | 0.320 | 23.9 | 0.233 | 0.431 |
| PPV_EC50 | Population parameter variability in EC50 | 0.879 | 58.4 | 0.075 | 1.76 |
| BSV_CL | Between subject variability in CL | 0.686 | 19.0 | 0.523 | 0.941 |
| BSV_V1 | Between subject variability in V1 | 0.301 | 26.2 | 0.214 | 0.453 |
| BSV_Q | Between subject variability in Q | 0.414 | 82.1 | 0.067 | 1.167 |
| BOV_CL1 | Between occasion variability in CL | 0.199 | 24.7 | 0.116 | 0.279 |
| R12 | Correlation of S0 and Sss | 0.864 | 16.1 | 0.621 | 1.00 |
| R23 | Correlation of Sss and EC50 | 0.054 | 692.5 | −10.57 | 0.651 |
| R78 | Correlation of CL and V1 | 0.257 | 104.0 | −0.1673 | 0.709 |
| R89 | Correlation of V1 and Q | 0.957 | 37.0 | 0.3044 | 1.00 |
| PPV_RUVFX | Population parameter variability in PAWP residual error | 0.308 | 42.3 | 0.010 | 0.487 |
| RUV_SDFX | Standard deviation of PAWP residual error | 2.5 | 6.9 | 2.22 | 2.79 |
| PPV_RUVCP | Population parameter variability in nicorandil residual error | 0.716 | 27.3 | 0.419 | 1.05 |
| RUV_CVCP | Coefficient of variation of nicorandil residual error | 0.212 | 12.9 | 0.172 | 0.260 |
| RUV_SDCP | Standard deviation of nicorandil residual error | 6.82 | 38.0 | 3.73 | 12.0 |
The target effect and target concentration of nicorandil
The observed baseline PAWP values in the bolus, bolus and infusion, and long-term studies were 25.9, 26.9 and 27.2 mmHg, respectively (Table 1). A decrease of 30% in PAWP from baseline due to nicorandil was proposed as the target effect. A target decrease of 30% in PAWP would reduce PAWP to close to 18 mmHg (i.e. 18.1, 18.8 and 19.0 mmHg, respectively). This is consistent with current treatment guidelines [1]. Further decreases in PAWP due to factors unrelated to nicorandil would produce further lowering over the following 24 h. The target concentration of nicorandil to achieve this target initial PAWP, was predicted for each patient using maximum a posteriori Bayesian estimates from the final PKPD model. The target concentration was obtained using the Emax model and solving for the concentration needed to produce a 30% fall in PAWP. The loading dose was predicted by multiplying the target concentration by the central compartment volume and the maintenance dose rate was predicted by multiplying the target concentration by the elimination clearance. This is a simplification of the two compartment model and ignores the early drop and subsequent rise in concentrations reflecting equilibration of the central and peripheral compartments. The median and 90% intervals of the individual patient predicted doses are shown in Table 5. The median target concentration of nicorandil to decrease PAWP by 30% was estimated to be 748 µg/l and the median loading dose and maintenance infusion rate required to achieve the target concentration were estimated to be 230 µg kg−1 and 412 µg kg−1 h−1.
Table 5.
Post hoc target effect and dose statistics (94 subjects of whom 84 were predicted to be able to reach the target PAWP)
| Statistic | Target PAWP (mmHg) | Target concentration (µg l−1) | Loading dose (µg kg−1) | Maintenance rate (µg kg−1 h−1) |
|---|---|---|---|---|
| Median | −7.5 | 747.8 | 230.4 | 412.5 |
| Lower 5% CI | −10.9 | 147.0 | 33.3 | 78.8 |
| Upper 95% CI | −5.8 | 3778.6 | 1229.5 | 3543.5 |
CI, Confidence interval.
Discussion
We performed a PKPD analysis to determine the relationship between plasma nicorandil concentration and haemodynamic changes in acute heart failure patients in order to predict an appropriate loading and maintenance dose of nicorandil. Data from five studies, which included 11 healthy subjects and 94 patients with AHF, were analyzed using a nonlinear mixed effects modelling approach.
The results of this present analysis are consistent with previous reports, that nicorandil is eliminated rapidly from plasma in human studies [15]. A surprising finding was the increase in the plasma clearance of nicorandil in patients with AHF compared with healthy subjects (Table 2). A decrease in clearance due to lower hepatic blood flow and impaired hepatic function would have been expected, and we cannot offer a plausible mechanistic explanation for an increase in clearance in AHF. There did seem to be an increase in central volume and a decrease in intercompartmental clearance in AHF which could be explained by venous distension and reduced tissue perfusion rate in AHF patients.
The lack of detectable delay in onset of effect suggests nicorandil reaches these sites rapidly and quickly changes vascular resistance. Other vasodilator drug effects have been described using similar models. The pharmacokinetic-pharmacodynamic relationship characterizing the haemodynamic effects of a calcium antagonist has been described by an immediate effect with an Emax model [16, 17]. Similarly, the effect of 1,3-glyceryl nitrate on blood pressure was analyzed assuming an immediate effect with an inhibitory Emax model [18].
We have demonstrated that there is a component of the time course of PAWP in AHF which is unrelated to exposure. It seems plausible that such an effect would occur in unstable patients admitted to hospital with heart failure. However, the reasons for the slow change in PAWP are only speculative and we see no rational basis for believing that other models such as a turnover model would be superior to an empirical description of this phenomenon.
The disease progress model we used is based on a description of changes in PAWP that appear to be independent of nicorandil exposure. In the absence of a placebo it is impossible to distinguish true progression from effects due to the drug without some assumptions based on prior information. We expect nicorandil effects to be rapid (see above). The slow (half-life 5.8 h) change in PAWP predicted from the model appears to be independent of exposure to nicorandil. The disease progress phenomenon which reaches a steady state after 24 h (four half-lives) seems a plausible description for PAWP changes expected in patients with unstable AHF related to other factors associated with hospitalization and treatments other than nicorandil e.g. diuretics.
We used the pharmacodynamic analysis to predict an appropriate loading and maintenance dose of nicorandil. The major adverse events related to nicorandil in these studies were headache and hypotension. There was no obvious relationship between plasma concentration of nicorandil and the incidence of hypotension. The estimated plasma concentration of nicorandil to achieve a 30% decrease in PAWP was 748 ng ml−1. This is similar to the concentration of nicorandil (850.6 ng ml−1) required to decrease the left ventricular end-diastolic pressure by ∼30% in dogs with heart failure [2]. The expected variability in response due to patient variability is illustrated in Figures 9 and 10. Based on this variability the percentage of patients in this study who would reach the target effect was 64% based on the loading dose and 62% based on the proposed maintenance dose rate.
We could not detect any evidence of tachyphylaxis over the 48 h administration period. Larsen et. al. also reported that nicorandil did not induce tachyphylaxis [4], so there is reason to expect that nicorandil would continue to be effective if administered for longer periods.
We recommend that in patients with AHF, nicorandil be initially administered as a loading dose of 200 µg kg−1 followed by an infusion of 400 µg kg−1 h−1. It is predicted that this regimen would lead to an average 30% reduction in PAWP. The subsequent infusion rate should be adjusted based upon clinical response.
We thank Dr. Takeshi Kamijo for reviewing this manuscript.
Competing interests
Satofumi Iida and Haruki Kinoshita work at Chugai Pharmaceutical Co., Ltd and Dr Nicholas Holford has served as an outside consultant in their research.
REFERENCES
- 1.Nieminen MS, Bohm M, Cowie MR, Drexler H, Filippatos GS, Jondeau G, Hasin Y, Lopez-Sendon J, Mebazaa A, Metra M, Rhodes A, Swedberg K, Priori SG, Garcia MA, Blanc JJ, Budaj A, Cowie MR, Dean V, Deckers J, Burgos EF, Lekakis J, Lindahl B, Mazzotta G, Morais J, Oto A, Smiseth OA, Garcia MA, Dickstein K, Albuquerque A, Conthe P, Crespo-Leiro M, Ferrari R, Follath F, Gavazzi A, Janssens U, Komajda M, Morais J, Moreno R, Singer M, Singh S, Tendera M, Thygesen K. Executive summary of the guidelines on the diagnosis and treatment of Acute Heart Failure: the Task Force on Acute Heart Failure of the European Society of Cardiology. Eur Heart J. 2005;26:384–416. doi: 10.1093/eurheartj/ehi044. [DOI] [PubMed] [Google Scholar]
- 2.Kamijo T, Kamei K, Sugo I, Kamiyama T, Sudo H, Ohba Y. Hemodynamic and hormonal responses to nicorandil in a canine model of acute ischemic heart failure: a comparison with cromakalim and nitroglycerin. J Cardiovasc Pharmacol. 1999;33:93–101. doi: 10.1097/00005344-199901000-00014. [DOI] [PubMed] [Google Scholar]
- 3.Tsutamoto T, Kinoshita M, Hisanaga T, Maeda Y, Maeda K, Wada A, Fukai D, Yoshida S. Comparison of hemodynamic effects and plasma cyclic guanosine monophosphate of nicorandil and nitroglycerin in patients with congestive heart failure. Am J Cardiol. 1995;75:1162–5. doi: 10.1016/s0002-9149(99)80750-4. [DOI] [PubMed] [Google Scholar]
- 4.Larsen AI, Goransson L, Aarsland T, Tamby JF, Dickstein K. Comparison of the degree of hemodynamic tolerance during intravenous infusion of nitroglycerin versus nicorandil in patients with congestive heart failure. Am Heart J. 1997;134:435–41. doi: 10.1016/s0002-8703(97)70078-4. [DOI] [PubMed] [Google Scholar]
- 5.Frydman AM, Chapelle P, Diekmann H, Bruno R, Thebault JJ, Bouthier J, Caplain H, Ungethuem W, Galliard C, Le Liboux A, Renard A, Gaillot J. Pharmacokinetics of nicorandil. Am J Cardiol. 1989;63:25J–33J. doi: 10.1016/0002-9149(89)90201-4. [DOI] [PubMed] [Google Scholar]
- 6.Tanikawa M, Uzu M, Ohsawa Y, Fukushima M. Sensitive method for determination of nicorandil in human plasma by reversed-phase high-performance liquid chromatography with ultraviolet detection. J Chromatogr. 1993;617:163–7. doi: 10.1016/0378-4347(93)80437-9. [DOI] [PubMed] [Google Scholar]
- 7.Zhang L, Beal SL, Sheiner LB. Simultaneous vs. sequential analysis for population PK/PD data I: best-case performance. J Pharmacokinet Pharmacodyn. 2003;30:387–404. doi: 10.1023/b:jopa.0000012998.04442.1f. [DOI] [PubMed] [Google Scholar]
- 8.Kreye VA, Lenz T, Pfrunder D, Theiss U. Pharmacological characterization of nicorandil by 86Rb efflux and isometric vasorelaxation studies in vascular smooth muscle. J Cardiovasc Pharmacol. 1992;3(20) Suppl:S8–12. doi: 10.1097/00005344-199206203-00003. [DOI] [PubMed] [Google Scholar]
- 9.Chan PL, Holford NH. Drug treatment effects on disease progression. Annu Rev Pharmacol Toxicol. 2001;41:625–59. doi: 10.1146/annurev.pharmtox.41.1.625. [DOI] [PubMed] [Google Scholar]
- 10.Holford NHG. Input-output models. In: Kimuko HC, Duffull SB, editors. Simulation for Designing Clinical Trials: A Pharmacokinetic-Pharmacodynamic Modeling Perspective (Drugs and the Pharmaceutical Sciences) New York: Marcel Dekker; 2003. pp. 17–30. [Google Scholar]
- 11.Holford NH. A size standard for pharmacokinetics. Clin Pharmacokinet. 1996;30:329–32. doi: 10.2165/00003088-199630050-00001. [DOI] [PubMed] [Google Scholar]
- 12.Holford NH. Target concentration intervention: beyond Y2K. Br J Clin Pharmacol. 1999;48:9–13. doi: 10.1046/j.1365-2125.1999.00971.x. [DOI] [PMC free article] [PubMed] [Google Scholar]
- 13.Matthews I, Kirkpatrick C, Holford N. Quantitative justification for target concentration intervention – parameter variability and predictive performance using population pharmacokinetic models for aminoglycosides. Br J Clin Pharmacol. 2004;58:8–19. doi: 10.1111/j.1365-2125.2004.02114.x. [DOI] [PMC free article] [PubMed] [Google Scholar]
- 14.Karlsson MO, Jonsson EN, Wiltse CG, Wade JR. Assumption testing in population pharmacokinetic models: illustrated with an analysis of moxonidine data from congestive heart failure patients. J Pharmacokinet Biopharm. 1998;26:207–46. doi: 10.1023/a:1020561807903. [DOI] [PubMed] [Google Scholar]
- 15.Frydman A. Pharmacokinetic profile of nicorandil in humans: an overview. J Cardiovasc Pharmacol. 1992;3(20) Suppl:S34–44. doi: 10.1097/00005344-199206203-00008. [DOI] [PubMed] [Google Scholar]
- 16.Bellissant E, Giudicelli JF. Pharmacokinetic-pharmacodynamic model for fantofarone cardiac and brachial haemodynamic effects in healthy volunteers. Br J Clin Pharmacol. 1999;48:801–10. doi: 10.1046/j.1365-2125.1999.00091.x. [DOI] [PMC free article] [PubMed] [Google Scholar]
- 17.Dias VC, Weir SJ, Ellenbogen KA. Pharmacokinetics and pharmacodynamics of intravenous diltiazem in patients with atrial fibrillation or atrial flutter. Circulation. 1992;86:1421–8. doi: 10.1161/01.cir.86.5.1421. [DOI] [PubMed] [Google Scholar]
- 18.Gumbleton M, Benet LZ. Simultaneous pharmacodynamic modeling of the non-steady-state effects of three oral doses of 1,3-glyceryl dinitrate upon blood pressure in healthy volunteers. J Pharmacokinet Biopharm. 1993;21:515–32. doi: 10.1007/BF01059112. [DOI] [PubMed] [Google Scholar]


