

Abstract
The human Apical Sodium-dependent Bile Acid Transporter (hASBT) is a potential target for drug delivery, but an understanding of hASBT substrate requirements is limited. The objective of this study was to evaluate the influence of ionic character and steric bulk in the C-24 region of bile acid conjugates in governing interaction with hASBT. Ionic character was studied using chenodeoxycholate (CDCA) conjugates of glutamic acid and lysine, which varied in charge (monoanionic, dianionic, cationic, neutral, and zwitterionic) and location of charge (proximal or distal to C-24). Steric effects were evaluated using ester conjugates that varied in ester substituent size (methyl, benzyl, and t-butyl) and location (proximal and/or distal). Conjugate interaction with hASBT was assessed via transport and inhibition studies, using a hASBT-MDCK monolayer. Monoanionic, cationic, and neutral conjugates of CDCA exhibited high inhibitory potency (Ki < 10 μM). High inhibition potency of neutral and cationic conjugates indicated a negative charge is not essential for hASBT binding. Dianionic conjugates exhibited low inhibition potency (Ki > 100 μM). Conjugates with a single bulky ester substituent proximal or distal to C-24 region exhibited high inhibition potency. However, two bulky substituents practically abolished interaction. In transport studies, monoanionic conjugates were high affinity hASBT substrates. Meanwhile, cationic and zwitterionic conjugates were not substrates for hASBT. Overall, C-24 ionic character influenced interaction with hASBT. Although the presence of a single negative charge was not essential for interaction with hASBT, monoanionic conjugates were favored for hASBT-mediated transport compared to cationic and zwitterionic conjugates.
Keywords: bile acids, prodrugs, hASBT, QSAR, SLC10A2, cell culture, transporters
Introduction
The bioavailability of oral drug candidates is often limited by their low intestinal permeability. Intestinal permeability of drugs can be enhanced via a prodrug approach targeting influx transporters in the small intestine. hASBT is a member of the solute carrier (SLC) genetic superfamily and is an attractive target for prodrug targeting, given its high transport capacity. As is often the case with transport targeted delivery 1, native substrates (i.e. bile acids for hASBT) have been employed as targeting moieties 2. Coupling of the drug to the bile acid could be via the bile acid’s C-24 carboxylate or the C-3 hydroxyl group 3–5. For example, a two fold enhancement in acyclovir bioavailability was achieved in rats, when acyclovir was C-24 conjugated to CDCA via a valine linker 2.
The lack of knowledge of hASBT substrate requirements has impeded progress in the rational prodrug design targeting hASBT. In particular, the influence of C-24 chemistry space in enhancing or impeding the interaction of bile acid analogues with hASBT is not clear. Previous studies have indicated that steroidal hydroxylation patterns and C-24 conjugation patterns govern the interaction of native bile acids with hASBT 6. It was observed that conjugation at C-24 enhanced inhibition potency and transport affinity of bile acids to hASBT. Additionally, it was reported that the C-24 region dominated steroidal hydroxylation effects in certain bile acids. These studies provide insight into structural features of the targeting moiety (i.e. bile acid) that favor interaction with hASBT. However, it is not clear how C-24 chemistry influences interaction with hASBT.
Lack et al. proposed that a negative charge around C-24 region is essential for interaction with hASBT 7. This observation also reflects that all the native bile acids carry a negative charge in the C-24 region. Most previous studies have focused on compounds incorporating a negative charge around C-24. For example, Swaan and colleagues examined the transport of four C-24 bile acid conjugates across Caco-2 monolayers 5. Each provided a negative charge near C-24. Two conjugates were rapidly transported. Subsequent QSAR analysis suggested that the C-24 side chain can be 14 Å in length or longer for translocation, and that large hydrophobic moieties increase binding to hASBT 8. Previous studies from our laboratory with neutral acyclovir conjugates indicate that neutral conjugates are transported via hASBT. The same observation was also made by Swaan et al., suggesting that a hydrogen bond acceptor could substitute for the negative charge 8.
The objective of this study was to evaluate the influence of ionic character and steric bulk around C-24 region of bile acid conjugates in governing interaction with hASBT. Ionic character was studied using chenodeoxycholate conjugates of glutamic acid or lysine. Conjugates varied in the nature of charge (monoanionic, dianionic, cationic, neutral, and zwitterionic) and location of charge (proximal or distal to C-24). Steric effects were evaluated using conjugates of lysine or glutamate that varied in substituent bulkiness and location of the bulky substituent (proximal and/or distal). Additionally, these also provide scaffolding for the subsequent attachment of potential drug candidates, directly extending these results to potential prodrug design. Requirements for hASBT inhibition can be expected to differ from requirements for hASBT-mediated translocation. Hence, both transport and inhibition studies were performed for each conjugate.
Experimental Section
Materials
Geneticin, fetal bovine serum, trypsin, and DMEM were purchased from Invitrogen Corporation (Carlsbad, CA). [3 H]-taurocholic acid and [14C]-mannitol were purchased from American Radiolabeled Chemicals (St. Louis, MO). Protected glutamate and lysine analogues were obtained from Bachem America (Philadelphia, PA). All other chemicals were obtained from Sigma Chemical (St. Louis, MO) or TCI America (Portland, OR).
Overview of Synthetic Approaches
CDCA conjugates were designed to evaluate the influence of ionic character and steric bulk around C-24 region. Among the native bile acids, CDCA was selected based on its favorable transport across hASBT-MDCK monolayers. CDCA was conjugated with either glutramate or lysine derivative (Fig. 1 and Fig. 2, respectively). Since glutamate carries both carboxylate and amine function, a two stage indirect coupling approach was selected using an N-hydroxysuccinimide ester intermediate of CDCA. This approach was particularly useful for monoanionic glutamic acid conjugates and is illustrated in Fig. 3. Neutral conjugates were synthesized via a simple one step reaction using HBTU as a coupling agent in the presence of triethylamine (TEA) as base. Lysine conjugates were synthesized using orthogonal protection for the ε-amine and α-carboxylate, as illustrated in Fig. 4.
Figure 1.

Glutamate conjugates of CDCA. Conjugates differ with respect to number of negative charge (0, 1 or 2), location of a negative charge (α or γ), and nature of the ester groups (methyl, benzyl and t-butyl). Glutamic acid CDCA amide carries two negative charges proximal and distal to C-24 (i.e. α and γ positions, respectively). Monoanionic conjugates contained either one proximal or one distal carboxylate, with the other methyl or benzyl esterified. For neutral conjugates, each of the carboxylates were esterified with substituents varying in size.
Figure 2.

Lysine conjugates of CDCA. In contrast to glutamate conjugates, lysine conjugates can provide a positive charge distal to C-24. The three lysine conjugates differed in ionic character. α lysine CDCA amide is zwitterionic with an α carboxylate and ε amino group. α lysine methyl ester CDCA amide is a cationic conjugate, since the α carboxylate is methyl esterified. α lysine (CBZ) benzyl ester CDCA amide is neutral, since the α carboxylate and ε amino group are benzyl esterified and CBZ protected, respectively.
Figure 3.

Synthetic scheme for monoanionic conjugates of CDCA. Since glutamate possesses both the carboxylate and amine function, conjugation to CDCA was carried out via an activated ester approach using N-hydroxysuccinamide (NHS) ester intermediate. The scheme illustrates the synthesis of γ methyl glutamic acid CDCA amide.
Figure 4.

Synthetic scheme for lysine conjugates of CDCA. Each lysine conjugate was synthesized via coupling of protected lysine derivative to CDCA using HBTU in the presence of TEA. The scheme illustrates the synthesis of α lysine methyl ester CDCA amide as an example. Subsequent hydrogenation resulted in the generation of the target compound following deprotection.
Synthesis of N-hydroxysuccinimide ester of CDCA
5.89 g (15 mmol) of CDCA was dissolved in 30 mL of dry dimethylformamide (DMF), along with 2.3 mL (16.5 mmol) of triethyl amine (TEA) and 5.89 g (15.5 mmol) of HBTU at room temperature. 1.9 g (16.5 mmol) of N-hydroxysuccinimide was dissolved in DMF and added dropwise to the above mixture. The mixture was stirred for 4 hours at room temperature. The contents were poured into brine and extracted into diethyl ether. The ether extract was washed thrice with cold water and once with 10% sodium carbonate. The ether extract was evaporated under vacuum to yield a fluffy white powder (yield 7.0 g). TLC of the intermediate indicated a single spot (CH2Cl2/CH3OH = 9:1). This intermediate was used in the subsequent synthetic schemes. Mass spectrometry (MS) indicated appropriate peaks: [M + 1] 490.31 and [M + Na] 512.31. 13 C NMR (CDCl3) (δ 11.8, 18.2, 20.6, 22.8, 23.7, 25.6, 28.0, 28.2, 30.7, 32.9, 34.6, 35.1, 35.2, 35.3, 38.7, 39.5, 39.6, 39.9, 41.5, 42.8, 50.5, 55.7, 68.6, 72.1, 75.1, 106.1, 111.2, 117.3, 126.3, 126.7, 169.2, 169.2).
Synthesis of monoanionic glutamate conjugates of CDCA
In the synthesis of α methyl ester glutamic acid CDCA amide 3.43 g (7 mmol) of N-hydroxysuccinimide ester of CDCA was dissolved in 15 mL of dry dimethylformamide (DMF), along with 1.12 mL (7 mmol) of triethyl amine (TEA) at room temperature. 1.13 g (7 mmol) of α-methyl glutamic acid was dispersed in 8 mL of DMF and added drop wise to the above mixture. The mixture was stirred for 12 hours at room temperature. DMF was evaporated under vacuum at a temperature less than 40°C. The crude product was dissolved in a mixture of 1:1 methanol and dichloromethane, and subsequently adsorbed onto 10 g of dried silica. The crude mixture was loaded on a silica column and eluted with a gradient system from zero to 20% methanol and dichloromethane, along with 1% acetic acid. Fractions were collected, and the solvents evaporated under vacuum to yield buff colored product. Yield was approximately 90% for crude product; after column purification yield was 60%. TLC of the final product showed a single spot free of impurities (CH2Cl2/CH3OH/CH3COOH = 8:2:0.1). MS indicated appropriate peaks: [M + 1] 536.35, [M + Na] 558.35, and [M − 1] 534.35. 13 C NMR (CDCl3) (δ 11.8, 18.5, 20.6, 22.8, 23.7, 27.5, 28.3, 30.2, 30.6, 31.0, 31.2, 32.8, 34.6, 35.1, 35.4, 36.6, 39.4, 39.7, 41.5, 42.7, 50.5, 51.8, 55.5, 67.5, 68.6, 72.1, 128.3, 128.6, 128.7, 135.1, 162.7, 172.0, 174.2, 175.7).
The synthesis of the γ-methyl ester glutamic acid CDCA amide was performed in a similar fashion. TLC of the final product showed a single spot free of impurities (CH2Cl2/CH3OH/CH3COOH = 8:2:0.1). MS indicated appropriate peaks: [M + 1] 536.35, [M + Na] 558.35, and [M − 1] 534.35. 13 21.6, 23.2, 23.7, 26.8, 28.3, C NMR ((CD3)2SO) (δ30.3, 31.1, 32.0, 32.6, 32.8, 35.3, 35.3, 35.5, 35.8, 39.5, 39.6, 39.9, 40.3, 40.4, 40.6, 41.9, 42.4, 50.5, 51.5, 51.9, 56.1, 66.7, 70.8, 173.2,173.3, 173.8).
α benzyl ester glutamic acid CDCA amide and γ benzyl ester glutamic acid CDCA amide were each synthesized in a similar fashion via the N-hydroxysuccinimide intermediate. After evaporation of DMF, residue was dissolved in 50 mL of dichloromethane and washed five times with 50 mL of water. The DCM extract was subsequently dried using brine and sodium sulfate. Removal of DCM under vacuum yielded the compound as a buff colored precipitate, with 80% product yield. TLC of the final product showed a single spot free of impurities (CH2Cl2/CH3OH = 8:2). MS indicated appropriate peaks: [M + 1] 612.39, and [M − 1] 510.38. α benzyl ester glutamic acid CDCA amide 13 C NMR (CD3Cl) (δ 11.8, 18.4, 20.6, 22.8, 23.7, 27.4, 28.2, 30.2, 30.6, 31.4, 32.9, 34.6, 35.1, 35.4, 39.4, 39.7, 40.8, 41.5, 42.7, 50.4, 51.8, 55.5, 67.4, 68.6, 72.1, 76.6, 102.1, 128.3, 128.6, 128.7, 135.2, 172.0, 174.2, 175.6. γ benzyl ester glutamic acid CDCA amide 13 C NMR (CD3Cl) (δ 11.8, 18.4, 20.6, 22.8, 23.7, 26.7, 28.3, 30.6, 31.6, 32.9, 33.1, 34.5, 35.1, 35.4, 35.4, 36.6, 39.4, 39.7, 41.5, 42.7, 50.4, 52.2, 55.7, 65.4, 66.8, 68.6, 72.1, 127.0, 127.7, 128.3, 128.4, 128.6, 128.7, 135.6, 155.4, 162.8, 173.5, 173.6, 174.9).
Synthesis of neutral glutamate conjugates of CDCA
In the synthesis of α, γ dimethyl ester glutamic acid CDCA amide, 1.57 g (4 mmol) of CDCA was dissolved in 10 mL of dry DMF, along with 0.5 mL (4 mmol) of TEA at room temperature. 1.06 g (5 mmol) of α, γ-dimethyl glutamic acid was dissolved in 7 mL of dry DMF and added to the above mixture and stirred for 6 hours at room temperature. The crude mixture was poured into ice cold distilled water and extracted into diethyl ether. The ether extract was washed thrice with water and once with brine. The crude mixture was loaded on a silica column and eluted with a gradient solvent system ranging from zero to 10% methanol in dichloromethane. Fractions were collected and the solvents evaporated under vacuum. Yield was approximately 90% for crude product; after column purification yield was 80%. TLC of the final product showed a single spot free of impurities (CH2Cl2/CH3OH = 9:1). MS indicated appropriate peaks: [M + 1] 550.37 and [M + Na] 572.37. 13 C NMR (CDCl3) (d 12.0, 18.6, 20.8, 23.0, 23.9, 27.6, 28.4, 30.3, 30.9, 31.7, 33.0, 33.5, 34.8, 35.3, 35.5, 35.7, 39.6, 39.8, 40.1, 41.7, 42.9, 50.7, 51.8, 52.1, 52.8, 56.0, 68.7, 72.3, 172.7, 173.6, 173.8).
The syntheses of α t-butyl, γ methyl glutamic acid CDCA amide and γ t-butyl, α methyl, glutamic acid CDCA amide were performed in a similar fashion. TLC showed a single spot free of impurities for each of the compounds (CH2Cl2/CH3OH = 9:1). MS indicated appropriate peaks for each: [M + 1] 592.41 and [M + Na] 614.41. For γ methyl α t-butyl glutamic acid CDCA amide, 13 C NMR (CDCl3) (δ 11.8, 18.7, 20.6, 22.8, 23.7, 27.7, 28.1, 28.2, 30.7, 30.9, 31.5, 31.6, 32.8, 33.4, 34.6, 35.1, 35.3, 35.1, 35.5, 39.7, 39.9, 41.5, 42.7, 50.5, 51.7, 52.5, 55.9, 68.5, 72.0, 80.9, 95.2, 172.3, 177.7, 173.5). For α methyl γ t-butyl glutamic acid CDCA amide, 13 C NMR (CDCl3) (δ 11.8, 18.4, 20.6, 22.8, 23.7, 27.3, 28.1, 28.2, 30.7, 31.0, 31.5, 32.9, 33.4, 34.6, 35.1, 35.4, 35.5, 39.5, 39.7, 39.9, 41.5, 42.8, 50.5, 51.8, 52.5, 55.9, 68.6, 72.1, 80.9, 172.4, 172.7, 173.5).
α, γ dibenzyl glutamic acid CDCA amide was synthesized in a similar fashion and purified via extraction. MS indicated appropriate peaks: [M + 1] 702.43 and [M + Na] 724.41. 13C NMR (CDCl3) (δ 3.0, 15.9, 19.0, 23.5, 34.7, 36.8, 38.0, 45.7, 47.0, 61.9, 63.9, 67.3, 123.6, 130.4, 131.0, 167.2, 168.0, 168.9).
Synthesis of dianionic glutamate conjugate of CDCA
For the synthesis of glutamic acid CDCA amide, α, β dibenzyl ester glutamic acid CDCA amide was dissolved in methanol and subjected to catalytic hydrogenation, using 10% Palladium on charcoal in a Parr apparatus overnight. Caution must be exercised during the addition of Pd/Charcoal into methanol, as the mixture may ignite. The mixture was subsequently filtered over a layer of celite. Methanol was evaporated under vacuum to yield the target compound as a white precipitate with 90% product yield. TLC of the final product showed a single spot free of impurities (CH2Cl2/CH3OH/CH3COOH = 8:2:1). MS indicated appropriate peak under negative ion mode: [M − 1] 520.34. 13 C NMR (CD3OH) (δ 9.3,16.0, 18.9, 20.5, 21.7, 25.0, 26.5, 28.4, 28.4, 30.3, 30.9, 31.1, 33.0, 33.3, 33.6, 33.9, 37.6, 37.9, 38.2, 40.3, 40.8, 41.7, 43.8, 45.9, 48.1, 48.6, 50.1, 54.5, 66.2, 70.0, 172.2, 173.4, 174.0).
Synthesis of lysine conjugates of CDCA
In the synthesis of α lysine (CBZ) benzyl ester CDCA amide, 1.96 g (5 mmol) of CDCA was dissolved in 15 mL of dry DMF, along with 1.2 mL (6 mmol) of TEA at room temperature. 2.40 g (6 mmol) of lysine (CBZ) benzyl ester was dissolved in 7 mL of dry DMF and added to the above mixture and stirred for 6 hours at room temperature. The crude mixture was poured into ice cold distilled water and extracted into diethyl ether. The ether extract was washed thrice with water and once with brine. The ether extract was dried using sodium sulfate and evaporated under vacuum to yield a buff colored precipitate of α lysine (CBZ) benzyl ester CDCA amide. Yield exceeded 90%. TLC of this product showed a single spot free of impurities (CH2Cl2/CH3OH = 9:1). MS indicated appropriate peaks: [M + 1] 745.47 and [M + Na] 767.47. 13 C NMR (CD3Cl) (δ 11.7, 18.3, 20.5, 22.2, 22.7, 23.6, 28.2, 29.3, 30.6, 31.5, 31.9, 32.8, 34.5, 35.0, 35.3, 39.4, 39.6, 39.8, 40.5, 41.4, 42.6, 50.4, 51.9, 55.6, 66.6, 67.2, 68.5, 72.0, 128.0, 128.3, 128.5, 128.6, 135.3, 136.5, 156.6, 172.4, 173.8).
For the synthesis of α lysine CDCA amide, α lysine (CBZ) benzyl ester CDCA amide was dissolved in methanol and subjected to catalytic hydrogenation using 10% Palladium on charcoal in a Parr apparatus overnight. Caution must be exercised during the addition of Pd/Charcoal into methanol as the mixture may ignite. The mixture was subsequently filtered over a layer of celite and methanol was evaporated under vaccum to yield α lysine DCA amide as a white precipitate (90 % product yield). TLC of the final product showed a single spot free of impurities (CH2Cl2/CH3OH/CH3COOH = 8:2:1) MS indicated appropriate peak under positive ion mode: [M + 1] 521.34.
To synthesize α lysine methyl ester CDCA amide, lysine (CBZ) methyl ester was coupled with CDCA in a similar fashion as above to yield α lysine (CBZ) CDCA amide, which was subsequently subjected to catalytic hydrogenation yielding target. Deprotection of the terminal amine group was done via hydrogenation, since the methyl ester is stable to hydrogenation. CBZ chemistry was chosen over t-boc or f-moc chemistry for deprotection since deprotection using TFA resulted in acylation of the steroidal hydroxyl groups. CBZ was removed conveniently via catalytic hydrogenation using Pd/Charcoal. 13C NMR (CD3Cl) (δ 8.5, 15.8, 18.0, 19.7, 20.2, 20.3, 20.9, 24.5, 25.5, 27.6, 28.2, 29.9, 30.3, 32.2, 32.5, 32.8, 33.2, 36.7, 37.0, 37.3, 39.4, 39.9, 40.9, 43.0, 45.1, 65.3, 69.1, 170.2, 173.2).
Identity of conjugates was confirmed via 13C NMR and MS. 13C NMR spectra contained peaks consistent with the amide linkage and appropriate carbonyl chemistry. MS data was consistent with the desired structures and a lack of bile acid in final product. Purity was assessed by TLC, NMR and LC-MS. TLC and NMR indicated high levels of purity. Conventional HPLC analysis with UV detection was not suitable for purity evaluations since bile acids do not possess a strong chromophore. Therefore, TLC and NMR were utilized for purity assessment. As an additional measure, CDCA levels in all the products were carefully monitored as presence of CDCA impurity in the final product can bias results due to its potent interaction with hASBT. The level of CDCA impurity in each conjugate was quantified using LC-MS and was observed to be less than 0.2%.
Cell Culture
Stably transfected hASBT-MDCK cells were cultured as described previously 9. Briefly, cells were grown at 37°C, 90% relative humidity, and 5% CO2 atmosphere, and fed every 2 days. Media comprised DMEM supplemented with 10% FBS, 50 U/mL penicillin, and 50 μg/mL streptomycin. Geneticin was used at 1 mg/mL to maintain selection pressure. Cells were passaged every 4 days or after reaching 90% confluence.
Chemical and metabolic stability
Conjugates were evaluated for chemical stability in transport buffer for three hours. Metabolic stability in the presence of cells was evaluated using sodium free buffer. Conjugates were dissolved in sodium free buffer (5 μM) and subsequently incubated with cells grown in 12 well plates at 37°C at 50 rpm. Samples were collected at 15, 30 and 60 minutes and frozen immediately after the addition of acetonitrile (20% of total volume). Samples were analyzed by LC-MS as described below under analytical methods.
Transport across hASBT-MDCK monolayers
Transport studies were performed to yield kinetic data that relates to the binding and subsequent translocation across the membrane. hASBT-MDCK cells were grown on polyester Transwells as described earlier 9. Briefly, cells were seeded at a density of 0.75 million cells/cm2 on polyester Transwells (Corning; Corning, NY, 0.4 μ pore size, 1cm2) and grown as described above. Cells were washed thrice with HBSS or modified HBSS prior to transport study. Studies were carried out at 37°C at 50 rpm using an orbital shaker. Transport buffer consisted of either Hank’s Balanced Salts Solution (HBSS, pH = 6.8) which contains 137 mM NaCl or a sodium-free, modified HBSS (pH = 6.8) where sodium chloride was replaced with 137 mM tetraethylammonium chloride. Since bile acid transport is sodium-dependent, studies using sodium-free buffer allowed for the measurement of passive transport of bile acids.
Kinetics of hASBT-mediated transport was assessed from transport studies employing a range of donor concentrations for each conjugate. In all studies, [14C]-mannitol was used to monitor monolayer integrity in parallel wells. Mannitol permeability was always less than 2.5 × 10⁻⁶ cm/sec in each individual well indicating monolayer integrity. The apical and basolateral volumes were 0.5 mL and 1.5 mL, respectively. Samples were quantified using LC-MS and liquid scintillation counter. Stability of conjugates were monitored during the course of the study via LC-MS and observed to be stable with less than 5% metabolized during the course of the study.
Inhibition Studies
hASBT-MDCK cells were seeded at a density of 1.5 million cells/well in 12 well plates (Corning; Corning, NY) and induced with 10 mM sodium butyrate for 12–15 h at 37°C prior to study on day 4. Kinetics of hASBT-mediated taurocholate uptake into hASBT-MDCK cells was measured as described earlier 9. Briefly, cells were washed thrice with HBSS (pH = 6.8) or modified HBSS (pH = 6.8) and incubated with donor solutions at 37°C and 50 rpm for 10 min. The donor solution was removed and the cells were washed three times with chilled sodium free buffer. Cells were lysed using 0.25 mL of 1 N NaOH and neutralized with 0.25 mL of 1 N HCl. Cell lysate was then counted for associated radioactivity using a liquid scintillation counter.
To characterize requirements for hASBT binding, cis-inhibition studies of taurocholate uptake were carried out using individual chenodeoxycholate (CDCA) conjugates at various concentrations (0–100 μM). Taurocholate was used as the substrate. Cells were exposed to donor solution containing taurocholate and CDCA conjugate for 10 min at 37°C and 50 rpm. After 10 minutes, the donor solution was removed and the cells were washed three times with chilled sodium free buffer. Cells were lysed using 0.25 mL of 1N NaOH and neutralized with 0.25 mL of 1N HCl. Cell lysate was then counted for associated radioactivity (i.e. taurocholate) using a liquid scintillation counter. Inhibition data was analyzed in terms of inhibition constant Ki, as described below.
Analytical Methods
Conjugates were analyzed by LC-MS or LC-MS-MS on an Agilent HPLC system, equipped with an autosampler (CTC Analytics, Switzerland) and Applied Biosystems Sciex API4000-Qtrap mass spectrometer. The column was a Phenomenex Luna C18 50 × 2 mm 3μ, heated to 40°C. Flow rate was 0.7 mL/min. A 3 min gradient was employed using acetonitrile and 10 mM ammonium acetate (pH = 6.8). The gradient mixture started with 1% acetonitrile and terminated with 70% acetonitrile. Detection was achieved under negative ion electrospray tandem mass spectrometry using [M−] peak for all the anionic bile acids, as [M−] peak provided the greatest sensitivity. Neutral glutamate conjugates and lysine conjugates were detected under positive ion mode based on higher sensitivity. Samples were also monitored for metabolites. Radiolabeled taurocholate and mannitol were quantified using a Beckman liquid scintillation counter model LS 5801 (Beckman Instruments; Fullerton, CA) in Econosafe scintillation cocktail.
Data Analysis
Flux data was analyzed as described earlier10. This previous study indicated that high transporter expression can lower monolayer resistance, resulting in ABL-limited transport of solutes, leading to biased kinetic estimates if ABL is not considered. The extent of bias is determined by transporter expression level and substrate affinity. Therefore, flux data in the present study was fitted to a previously developed modified Michelis-Menten model that takes into account aqueous boundary layer resistance (eqn 1). Data from sodium-free studies were fitted to a passive transport model (eqn 2).
| (1) |
| (2) |
where J is taurocholate flux, Jmax and Kt are the Michaelis-Menten constants for hASBT-mediated transport, S is taurocholate (i.e. substrate) concentration, Pp is the passive taurocholate permeability coefficient, and PABL is the aqueous boundary layer (ABL) permeability. In eqn 1 and 2, PABL was 70 × 10−6 cm/sec 10. Equations 1 and 2 were applied simultaneously to sodium containing and sodium-free flux data to estimate Kt, Jmax, and Pp. A pooled data analysis approach was used to model flux data from multiple occasions. Briefly, the pooled approach entailed fitting eqn 1 and 2 simultaneously to pooled flux data from all occasions, to yield single Kt estimate for all occasions; Jmax and Pp varied with occasion.
The following competitive inhibition model was applied to cis inhibition studies of taurocholate uptake by individual bile acids 10:
| (3) |
where I is the concentration of inhibitor (i.e. CDCA conjugate) and S is the concentration of taurocholate (i.e. 0.5 or 5 μM). In applying eqn 3, only Ki was estimated. The other three parameters (i.e. Jmax, Kt, and Pp) were estimated from taurocholate uptake studies without inhibitor using eqn 1 and 2, as described above where PABL = 150 × 10−6 cm/sec.
Statistical Analysis
Non-linear curve fitting was performed using WinNonlin 4.1 (Pharsight, Mountain View, CA). Results were analyzed using student’s t test and ANOVA. A p-value of less than 0.05 was considered significant. SEM of a ratio was calculated using the delta method 11.
Results
Design of CDCA Conjugates with varying ionic and steric character around C-24
CDCA conjugates were designed to evaluate the influence of ionic character and steric bulk around C-24 region. CDCA conjugates of glutamic acid or lysine were employed to yield congeneric series differing in charge (monoanionic, dianionic, cationic, neutral, and zwitterionic) and charge location (proximal or distal to C-24). Steric effect was evaluated using ester conjugates that varied in size of ester substituent and location (proximal and/or distal). Glutamate conjugates of CDCA provide carboxyl group(s) that is ionized at pH above five. Similarly, lysine conjugates of CDCA can provide a protonated amine at pH below eight. Also, the multiple sites of conjugation on each glutamic acid and lysine would allow either to function as a linker for coupling bile acid with drug candidates, directly extending these results to potential prodrug design.
Figure 1 illustrates the glutamate conjugates of CDCA. Glutamic acid CDCA amide (Glu-CDCA) carries two negative charges proximal and distal to C-24 (i.e. α and γ positions, respectively). Monoanionic conjugates contained either one proximal or one distal carboxylate, with the other carboxylate esterified with methyl or benzyl substituent. For neutral conjugates, each carboxylate was esterified with substituents varying in steric bulk.
Figure 2 illustrates the structure of lysine conjugates of CDCA. Unlike glutamate conjugates, lysine conjugates can provide a positive charge distal to C-24. The three lysine conjugates differed in ionic character. α lysine CDCA amide (Lys-CDCA) is zwitterionic with an α carboxylate and ε amino group. α lysine methyl ester CDCA amide (AM-lys-CDCA) is a cationic conjugate. α lysine (CBZ) benzyl ester CDCA amide (AB-Lys(Z)-CDCA) is neutral.
Synthesis of CDCA conjugates
Most of the conjugates were synthesized with yields ranging from 60% to 90%. Identification of each of the synthesized conjugates was confirmed via 13C NMR and MS. 13C NMR spectra contained peaks consistent with the amide linkage and appropriate carbonyl chemistry. Coupling via the C-24 carboxylate of CDCA was checked by monitoring carboxylate shifts at ~ 180 ppm. MS data was consistent with the desired structures and a lack of bile acid in final product. Purity for each of the conjugates was assessed by TLC, NMR and LC-MS. TLC indicated a single spot for all the conjugates indicating high levels of conjugate purity. LC-MS quantified the level of CDCA impurity to be under 0.2%.
Inhibition studies
Taurocholate uptake inhibition studies were carried out for each CDCA conjugate. Figure 5 illustrates the concentration-dependent inhibition of taurocholate uptake into hASBT-MDCK monolayers by α benzyl glutamic acid CDCA amide (AB-glu-CDCA). AB-glu-CDCA inhibited taurocholate flux over ten-fold at 50 μM with a Ki of 0.55 μM. Similar profiles were observed for other CDCA conjugates. Dixon analysis of the monoanionic γ methyl ester glutamic acid CDCA amide indicated a linear plot with an intercept not different than zero (p>0.05), indicating competitive inhibition. Significant differences in inhibitory potencies were observed between the synthesized CDCA conjugates with Ki values ranging from 0.5 μM to greater than 1.5 M. The monoanionic CDCA conjugate, α benzyl glutamic acid CDCA amide exhibited the greatest potency with a Ki of 0.55 μM. Dibenzyl glutamic acid CDCA amide and α lysine(CBZ) benzyl ester CDCA amide exhibited negligible inhibitory potency with Ki greater than 0.5 M.
Figure 5.
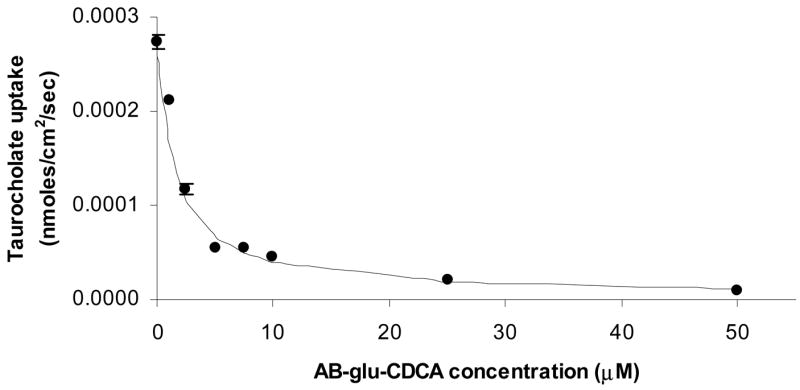
Concentration-dependent inhibition of taurocholate uptake into hASBT-MDCK monolayers by α benzyl glutamic acid CDCA amide. α benzyl glutamic acid CDCA amide is abbreviated AB-glu-CDCA. Cis-inhibition studies of taurocholate uptake were carried out at varying concentrations of AB-glu-CDCA (0–50 μM). Closed circles indicate observed data points, while the solid line indicates model fitted data. Taurocholate uptake into hASBT-MDCK cells was reduced significantly by AB-glu-CDCA. Qualitatively similar profiles were observed for other CDCA conjugates.
Figure 6 illustrates the influence of C-24 ionic character on inhibition potency. Monoanionic, cationic, and neutral conjugates of CDCA exhibited high inhibitory potency (i.e. Ki lower than 10 μM). Both neutral and cationic conjugates exhibited high inhibition potency indicating that a negative charge is not essential for binding to hASBT. The dianionic Glu-CDCA exhibited poor inhibitory potency with a Ki greater than 100 μM. The zwitterionic Lys-CDCA exhibited moderate inhibition potency (i.e. Ki between 10 and 100 μM). Within monoanionic CDCA conjugates, conjugates with proximal (i.e. GM-glu-CDCA and GB-glu-CDCA) and distal (i.e. GM-glu-CDCA and GB-glu-CDCA) negative charge exhibited similar inhibition potency. Meanwhile, each AB-glu-CDCA and GB-glu-CDCA exhibited Ki values that were five fold lower than the corresponding methyl ester conjugates.
Figure 6.

Effect of C-24 ionic character on inhibition potency. The inhibition potency of conjugates was influenced by ionic character around C-24 region. Monoanionic, cationic, and neutral conjugates of CDCA exhibited high inhibitory potency (i.e Ki lower than 10 μM). Within monoanionic CDCA conjugates, location of the negative charge proximal (GM-glu-CDCA and GB-glu-CDCA) or distal (AM-glu-CDCA and AB-glu-CDCA) to C-24 did not affect inhibitory activity. The dianionic Glu-CDCA exhibited poor inhibitory potency with a Ki greater than 100 μM. The zwitterionic Lys-CDCA exhibited moderate inhibition potency (i.e. Ki between 10 and 100 μM).
Figure 7 illustrates C-24 steric influence on hASBT-inhibition potency of neutral conjugates. Compared to methyl substituent, presence of a t-butyl group distal or proximal to C-24 region did not change inhibitory potency of the conjugates. Additionally location of t-butyl group did not affect inhibitory potency as both ATB-GM-glu-CDCA and GTB-AM-CDCA exhibited similar Ki values. On the contrary, presence of two benzyl groups completely abolishes inhibitory activity in case of α, γ dibenzyl ester glutamic acid CDCA amide.
Figure 7.

Effect of steric bulk around C-24 region on inhibition potency of neutral conjugates. Compared to a methyl ester, a bulky t-butyl ester proximal or distal to C-24 did not influence inhibition potency. However, the presence of two benzyl esters practically abolished interaction with hASBT (Ki > 0.5M).
Transport studies
Inhibition data indicated most conjugates to generally exhibit good inhibition potency. However, substrate requirements for hASBT-mediated translocation may differ from requirements for hASBT inhibition. Subsequently, each conjugate exhibiting hASBT inhibition was evaluated for hASBT-mediated transport. Table 1 summarizes the kinetic parameters of hASBT-mediated transport for all the CDCA conjugates.
Table 1.
Kinetic estimates of hASBT-mediated transport of CDCA conjugates. Results are presented as mean (SEM) of at least three measurements.
| Ionic Character | Conjugate | Normalized Jmax | Kt (μM) | Pp (cm/sec) × 106 |
|---|---|---|---|---|
| Dianionic | Glu-CDCA | Nm | Nm | 1.30 (0.09) |
| Monoanionic | AM-glu-CDCA | 1.28 (0.17) | 3.92 (0.52) | 1.89 (0.16) |
| AB-glu-CDCA | 0.923 (0.145) | 0.249 (0.285) | 5.32 (0.35) | |
| GM-glu-CDCA | 1.97 (0.26) | 7.79 (1.17) | 1.45 (0.12) | |
| GB-glu-CDCA | 2.06 (0.26) | 0.149 (0.203) | 2.03 (0.18) | |
| Cationic | AM-lys-CDCA | Nm | Nm | 1.29 (0.09) |
| Zwitterionic | Lys-CDCA | Nm | Nm | 1.73 (0.14) |
| Neutral | DM-glu-CDCA | Nd | Nd | 9.72 (0.29) |
nm = not measurable i.e. not transported by hASBT
nd = not determinable owing to high passive permeability
Figure 8 illustrates the concentration dependent transport of α methyl glutamic acid CDCA amide (AM-glu-CDCA) across hASBT-MDCK monolayers. Transport of AM-glu-CDCA was mediated largely by hASBT, with an approximately 12-fold greater flux from sodium-containing studies than from sodium-free studies. Similar profiles were obtained for the other three monoanionic conjugates of CDCA. The dianionic conjugate glutamic acid CDCA amide did not exhibit any hASBT-mediated transport, as can be expected from its poor inhibition potency. The cationic and the zwitterionic conjugate lysine conjugates did not exhibit significant hASBT-mediated transport, suggesting that these features abolish hASBT-mediated transport, in spite of their high inhibition potency. Neutral conjugate of glutamic acid α, γ, dimethyl glutamic acid CDCA amide (DM-glu-CDCA) did not show apparent hASBT-mediated transport, perhaps due to its high passive permeability 12.
Figure 8.

Concentration-dependent transport of α methyl glutamic acid CDCA amide across hASBT-MDCK monolayers. AM-glu-CDCA flux was measured at varying concentrations (1–50 μM) in the presence and absence of sodium to delineate hASBT-mediated and passive flux components. Filled circles represent flux data in the presence of sodium. Open circles represent passive flux (i.e absence of sodium). The solid lines represent the model fitted curve. In the presence of sodium, AM-glu-CDCA transport was significantly larger compared to transport in the absence of sodium. Similar profiles were obtained for other monoanionic CDCA conjugates. Neutral conjugates of CDCA exhibited high passive flux and active flux was not discerned.
Overall, significant hASBT-mediated transport was observed only for monoanionic conjugates of CDCA. All the monoanionic conjugates were substrates for hASBT (Table 1). Within monoanionic CDCA conjugates, conjugates with either α or γ carboxylate exhibited similar substrate affinities indicating that the location of free carboxylate did not influence transport affinity. In comparing benzyl versus methyl esters, benzyl esters were more favored with approximately 10-fold lower Kt values. These results mirror the trends observed from inhibition studies, regarding the location of the free carboxylate and nature of the ester substituent (Fig. 6).
Discussion
The human ileal bile acid transporter, also known as hASBT (SLC10A2), is a key component in the enterohepatic recirculation of bile acids and serves as a target to enhance oral drug absorption. Structural information on hASBT has been restricted to its primary sequence and membrane topology 13. In the absence of a high resolution crystal structure for hASBT, little is known about the interaction of hASBT with its substrates. This general lack of information has resulted in very few successful attempts at increasing bioavailability of compounds with poor intestinal permeability 14,15.
Previous studies with native bile acids have indicated that C-24 conjugation enhances affinity to hASBT and results in enhanced hASBT-mediated transport 6,16. However, it is not clear how C-24 chemistry influences interaction with hASBT. Previous studies by Lack et al. indicated that a negative charge around C-24 is essential for interaction with hASBT 7. These studies were based on data from rat everted sac model, where bile acid transport was confounded with other intestinal transporters. Additionally, it was suggested that the negative charge should be distal to C-24. However, recent studies from our laboratory with neutral acyclovir conjugates indicated that neutral conjugates are transported via hASBT. Similar observation was also made by Swaan et al., suggesting that a hydrogen bond acceptor could substitute for the negative charge 8. Results from Kramer et al. indicated that hybrids of bile acid and HMG Co A reductase inhibitors lacking a negative charge were able to inhibit taurocholate uptake in rabbit brush border membrane vesicles 17,18. This lack of agreement between recent studies and Lack’s earlier observations would appear to reflect the limitations of the assay system used in earlier studies. A recently developed hASBT-MDCK addressees some of these limitations and provides a convenient assay system for the assessment of hASBT function 9.
The present study reveals insights about the influence of ionic character and steric bulk around C-24 region of bile acid conjugates in governing interaction with hASBT. Influence of ionic character was studied systematically using CDCA conjugates of glutamic acid or lysine which varied in charge (monoanionic, dianionic, cationic, neutral, and zwitterionic) and charge location (proximal or distal to C-24). Steric effects were evaluated using conjugates of lysine and glutamate that varied in substituent bulkiness and location of the bulky substituent (proximal and/or distal). Glutamate and lysine conjugates were employed since they provide charged functional groups that can easily be derivatized to yield congeneric series of compounds varying in ionic and steric character.
Results from inhibition studies indicate that presence of a single negative charge is not essential for binding to hASBT. Neutral and cationic CDCA conjugates exhibited potent inhibitory activity similar to monoanionic conjugates. Zwitterionic conjugates also exhibited moderate inhibitory activity. Presence of two negative charges was detrimental to hASBT binding; dianionic conjugate glutamic acid CDCA amide exhibited very weak inhibitory activity. Table 2 compares the inhibition potency and substrate affinity of various CDCA conjugates. Interestingly, although the cationic conjugate (AM-lys-CDCA) and zwitterionic conjugate (Lys-CDCA) exhibited potent inhibitory activity, these conjugates were not substrates for hASBT. Only the monoanionic conjugates exhibited high hASBT-mediated transport, such that kinetic parameters could be estimated.
Table 2.
C-24 chemistry effect on inhibitory potency and transport affinity. Inhibitory potency is classified as low, moderate or high, depending on Ki. Transport affinity is characterized as substrates or non-substrates.
| Ionic character | Conjugate | Inhibition potency a | Substrate Affinityb |
|---|---|---|---|
| Dianionic | Glu-CDCA | Low | Non-substrate |
| Monoanionic | AM-glu-CDCA | High | Substrate |
| AB-glu-CDCA | High | Substrate | |
| GM-glu-CDCA | High | Substrate | |
| GB-glu-CDCA | High | Substrate | |
| Cationic | AM-Lys-CDCA | High | Non-substrate |
| Zwitterionic | Lys-CDCA | Moderate | Non-substrate |
| Neutral | DM-glu-CDCA | High | ndc |
Low, moderate, and high potencies refer to Ki > 100 μM, 100 μM > Ki > 10 μM, and Ki < 10 μM, respectively.
A conjugate is classified as a substrate if the ratio of flux in presence of sodium versus flux in absence of sodium is significantly greater than unity.
nd = not determinable owing to high passive permeability
Previous studies have indicated that steric bulk influences hASBT-mediated transport. For example, transport of cholyl lysine fluorescein across ileum was relatively low and exhibited negligible differences in transport rate across jejunum and ileum. On the other hand, cholyl lysine NBD (nitrobenzoxadiazole) exhibited greater transport from the ileum compared to jejunum 19. This difference in transport characteristics probably reflect the smaller size of NBD (nitrobenzoxadiazole) fluorophore compared to fluorescein. In the present study, presence of a single bulky t-butyl or benzyl substituent did not impede binding to hASBT. Additionally, location of the bulky substituent (i.e. proximal or distal to C-24 carboxylate) did not influence inhibitory potency. However, presence of two bulky groups practically abolished interaction with hASBT, as observed for α γ dibenzyl glutamic acid amide and α lysine (CBZ) benzyl ester glutamic acid amide.
Results from the current study can be expected to facilitate future design of prodrugs targeting hASBT. From observed C-24 charge requirements, an appropriate linker can be used to achieve favorable C-24 chemistry space for the hASBT-mediated transport of prodrugs.
Acknowledgments
This work was supported in part by National Institutes of Health grant DK67530. A.C. is the recipient of an Independent Scientist Award (DA19634).
List of Abbreviations
- hASBT
human apical sodium-dependent bile acid transporter
- SLC
solute carrier family
- MDCK
Madin canine kidney
- HBSS
Hanks balanced salt solution
- ABL
aqueous boundary layer
- TCA
taurocholic acid
- CDCA
Chenodeoxycholic acid
- Glu-CDCA
Glutamic acid CDCA amide
- AM-glu-CDCA
α methyl glutamic acid CDCA amide
- AB-glu-CDCA
α benzyl glutamic acid CDCA amide
- GM-glu-CDCA
γ methyl glutamic acid CDCA amide
- GB-glu-CDCA
γ benzyl glutamic acid CDCA amide
- AM-lys-CDCA
α lysine methyl ester CDCA amide
- Lys-CDCA
α lysine CDCA amide
- DM-glu-CDCA
α, γ dimethyl glutamic acid CDCA amide
- ATB-GM-glu-CDCA
α t-butyl, γ methyl glutamic acid CDCA amide
- GTB-AM-glu-CDCA
γ t-butyl, α methyl, glutamic acid CDCA amide
- DB-glu-CDCA
α, γ dibenzyl glutamic acid CDCA amide
- AB-Lys(Z)-CDCA
α lysine(CBZ) benzyl ester CDCA amide
References
- 1.Steffansen B, Nielsen CU, Frokjaer S. Delivery aspects of small peptides and substrates for peptide transporters. Eur J Pharm Biopharm. 2005;60:241–245. doi: 10.1016/j.ejpb.2005.01.004. [DOI] [PubMed] [Google Scholar]
- 2.Tolle-Sander S, Lentz KA, Maeda DY, Coop A, Polli JE. Increased acyclovir oral bioavailability via a bile acid conjugate. Mol Pharm. 2004;1:40–48. doi: 10.1021/mp034010t. [DOI] [PubMed] [Google Scholar]
- 3.Kramer W, Wess G. Bile acid transport systems as pharmaceutical targets. Eur J Clin Invest. 1996;26:715–732. doi: 10.1111/j.1365-2362.1996.tb02383.x. [DOI] [PubMed] [Google Scholar]
- 4.Kullak-Ublick GA, Glasa J, Boker C, Oswald M, Grutzner U, et al. Chlorambucil-taurocholate is transported by bile acid carriers expressed in human hepatocellular carcinomas. Gastroenterology. 1997;113:1295–1305. doi: 10.1053/gast.1997.v113.pm9322525. [DOI] [PubMed] [Google Scholar]
- 5.Swaan PW, Hillgren KM, Szoka FC, Jr, Oie S. Enhanced transepithelial transport of peptides by conjugation to cholic acid. Bioconjug Chem. 1997;8:520–525. doi: 10.1021/bc970076t. [DOI] [PubMed] [Google Scholar]
- 6.Balakrishnan A, Wring SA, Polli JE. Interaction of Native Bile Acids with Human Apical Sodium Dependent Bile Acid Transporter (hASBT): Influence of Steroidal Hydroxylation Pattern and C-24 Conjugation. Pharm Res. 2006 doi: 10.1007/s11095-006-0219-4. (in press) [DOI] [PMC free article] [PubMed] [Google Scholar]
- 7.Lack L. Properties and biological significance of the ileal bile salt transport system. Environmental Health Perspectives. 1979;33:79–90. doi: 10.1289/ehp.793379. [DOI] [PMC free article] [PubMed] [Google Scholar]
- 8.Swaan PW, Szoka FC, Jr, Oie S. Molecular modeling of the intestinal bile acid carrier: a comparative molecular field analysis study. J Comput Aided Mol Des. 1997;11:581–588. doi: 10.1023/a:1007919704457. [DOI] [PubMed] [Google Scholar]
- 9.Balakrishnan A, Sussman DJ, Polli JE. Development of stably transfected monolayer overexpressing the human apical sodium-dependent bile acid transporter (hASBT) Pharm Res. 2005;22:1269–1280. doi: 10.1007/s11095-005-5274-8. [DOI] [PubMed] [Google Scholar]
- 10.Balakrishnan A, Polli JE. Deleterious effect of high transporter expression in the estimation of transporter kinetics. AAPS J. 2005;7:R6224. [Google Scholar]
- 11.Tanner MA. Tools for Statistical Inference, vol. 67: Lecture Notes in Statistics. Springer-Verlag; Berlin: 1992. [Google Scholar]
- 12.Lentz KA, Polli JW, Wring SA, Humphreys JE, Polli JE. Influence of passive permeability on apparent P-glycoprotein kinetics. Pharm Res. 2000;17:1456–1460. doi: 10.1023/a:1007692622216. [DOI] [PubMed] [Google Scholar]
- 13.Zhang EY, Phelps MA, Banerjee A, Khantwal CM, Chang C, et al. Topology scanning and putative three-dimensional structure of the extracellular binding domains of the apical sodium-dependent bile acid transporter (SLC10A2) Biochemistry. 2004;43:11380–11392. doi: 10.1021/bi049270a. [DOI] [PubMed] [Google Scholar]
- 14.Zhang EY, Knipp GT, Ekins S, Swaan PW. Structural biology and function of solute transporters: implications for identifying and designing substrates. Drug Metab Rev. 2002;34:709–750. doi: 10.1081/dmr-120015692. [DOI] [PubMed] [Google Scholar]
- 15.Hagenbuch B, Dawson P. The sodium bile salt cotransport family SLC10. Pflugers Arch. 2004;447:566–570. doi: 10.1007/s00424-003-1130-z. [DOI] [PubMed] [Google Scholar]
- 16.Balakrishnan A, Wring SA, Polli JE. Characterization of C-24 chemistry space and Steroidal Hydroxylation: Influence on bile interaction with hASBT. The AAPS Journal. 2005;7:R6223. [Google Scholar]
- 17.Kramer W, Wess G, Enhsen A, Bock K, Falk E, et al. Bile acid derived HMG-CoA reductase inhibitors. Biochim Biophys Acta. 1994;1227:137–154. doi: 10.1016/0925-4439(94)90088-4. [DOI] [PubMed] [Google Scholar]
- 18.Wess G, Kramer W, Han XB, Bock K, Enhsen A, et al. Synthesis and biological activity of bile acid-derived HMG-CoA reductase inhibitors. The role of 21-methyl in recognition of HMG-CoA reductase and the ileal bile acid transport system. J Med Chem. 1994;37:3240–3246. doi: 10.1021/jm00046a007. [DOI] [PubMed] [Google Scholar]
- 19.Holzinger F, Schteingart CD, Ton-Nu HT, Eming SA, Monte MJ, et al. Fluorescent bile acid derivatives: relationship between chemical structure and hepatic and intestinal transport in the rat. Hepatology. 1997;26:1263–1271. doi: 10.1002/hep.510260526. [DOI] [PubMed] [Google Scholar]