Abstract
The enzyme-linked immunosorbant assay (ELISA) is often used to measure protein levels in plasma and other solutions. In order for the assay to be quantitative, a standard curve must be prepared for each assay. Technical blunders in preparing the standard curve can render otherwise representative sample values useless. In order to recover these data, a protocol has been developed whereby a new standard curve is generated using the ΔOD values of the samples. This new standard is applied to the original plate in order to determine sample concentrations. To validate this method, sample concentrations obtained using an acceptable standard curve were plotted against those obtained using the new standard curve. Linear regression analysis showed a 1:1 correlation between concentrations, with r2 values ranging from 0.98–0.99 and slopes ranging from 0.97–1.10. In this manner, data for these samples are preserved, saving the investigator the time and money involved in repeating experiments.
Keywords: ELISA, standard curve, cytokine, sample concentration, recovery
Introduction
Given its ease of performance, high throughput capabilities and the increasing availability of recombinant standards and antibodies for various proteins, the ELISA has become the assay of choice for measuring proteins in various biological matrices (Salonen and Vaheri, 1981; Boscato and Stuart, 1988). The ELISA technique has recently been optimized to measure protein concentrations from as little as 10µL of sample, with proper dilution. This greatly benefits many in vivo applications in which only small volumes of sample can be collected in order to monitor disease progression over time (O'Connor et al., 2004; Osuchowski et al., 2006). Unfortunately, human error and other unidentifiable factors sometimes result in unsuccessful assays in which a reliable standard curve can not be generated, leaving otherwise representative sample readings useless. This can prove detrimental when only small sample volumes can be collected, requiring both time and resources to repeat experiments.
Here, we outline a method by which the concentrations of samples may be calculated by deriving a separate standard curve. This method is not recommended as a primary means of data collection, but is a rescue protocol for instances in which there is a need for salvage. This method is applicable when it is determined that the defect is with the standard only. Standard curves are deemed failed if they meet the following criteria: five or more samples have ΔOD 0.5 higher than the most concentrated standard; a 4-parameter regression can not be calculated (ΔOD does not strictly decrease as standard concentration decreases); and r2<0.97. In our experience, technical blunders involving the capture antibody result in little to no color development, while problems with detection antibody results in uniform faint color in all wells, including blanks. As such, experienced ELISA users can determine whether or not sample ΔOD values are usable as they will show a wide range of values. Specific examples of possible mistakes where only the standard has failed would be using mouse IL-6 standard in an ELISA for human IL-6, or selecting the IL-1 standard when the assay was meant to measure IL-10.
In this method, a new standard curve is generated using the ΔOD values of the samples themselves from the original assay. 8–10 samples with maximal range of ΔOD values are chosen and re-run with a verified working standard protein. The concentrations of these samples are then used to generate a new standard curve, which is applied to the original plate in order to determine sample concentrations. Linear regression analysis of these curves showed a 1:1 correlation between concentrations, with r2 values ranging from 0.98–0.99 and slopes ranging from 0.97–1.10 for each cytokine assayed.
Methods
-
Initial Sample Run
Samples are run according to previously optimized standard ELISA protocol (DeForge and Remick, 1991; Nemzek et al., 2001).
Immediately prior to stopping the color reaction, the OD590 is measured.
The reaction is stopped with sulfuric acid and ΔOD values are used for data analysis. At this point, if a working standard curve can be generated, the data may be analyzed normally. If not, the following steps can be taken for preservation of sample data.
-
Troubleshoot Standard Curve
Prepare fresh dilution buffer and rerun standard curve. In order to proceed with the assay, troubleshooting must be successful so that standard curves can be reliably generated.
-
New Standard Run
-
Choose 8–10 samples to rerun to generate the new standard curve.
Samples with the maximum and minimum ΔOD values are always chosen, along with others with ΔOD values that are evenly distributed within this range.
These samples are rerun by standard ELISA protocol.
Prior to addition of sulfuric acid solution, OD590 is monitored. The reaction should not be stopped until the OD590 values are equal to that read in the initial sample run. The plates can be left in a covered plate reader and reread until the desired OD590 is obtained. This is to ensure that differences in extent of color development do not affect sample concentrations calculated using the new standard.
-
A non-linear 4-parameter regression is used to generate a standard curve. Note that any computer program capable of generating a 4-parameter regression can be used. The concentrations of the samples are then used to generate a new standard curve as follows:
Each well corresponding to a sample in the new standard run is re-labeled as a standard and its concentration is entered manually.
Once all samples are renamed and concentrations entered, those wells are used to generate the new standard curve and 4-parameter equation.
The new standard curve is then applied to samples from the initial sample run to interpolate concentrations of all the samples.
-
Results and Discussion
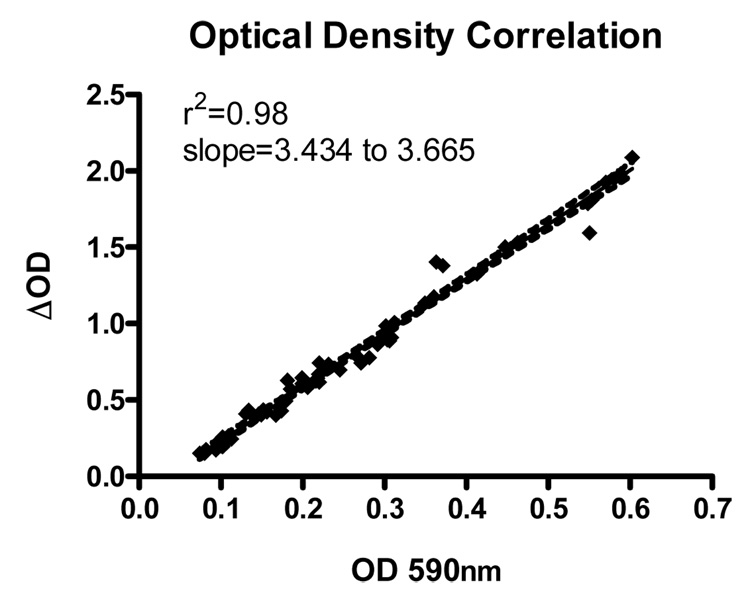
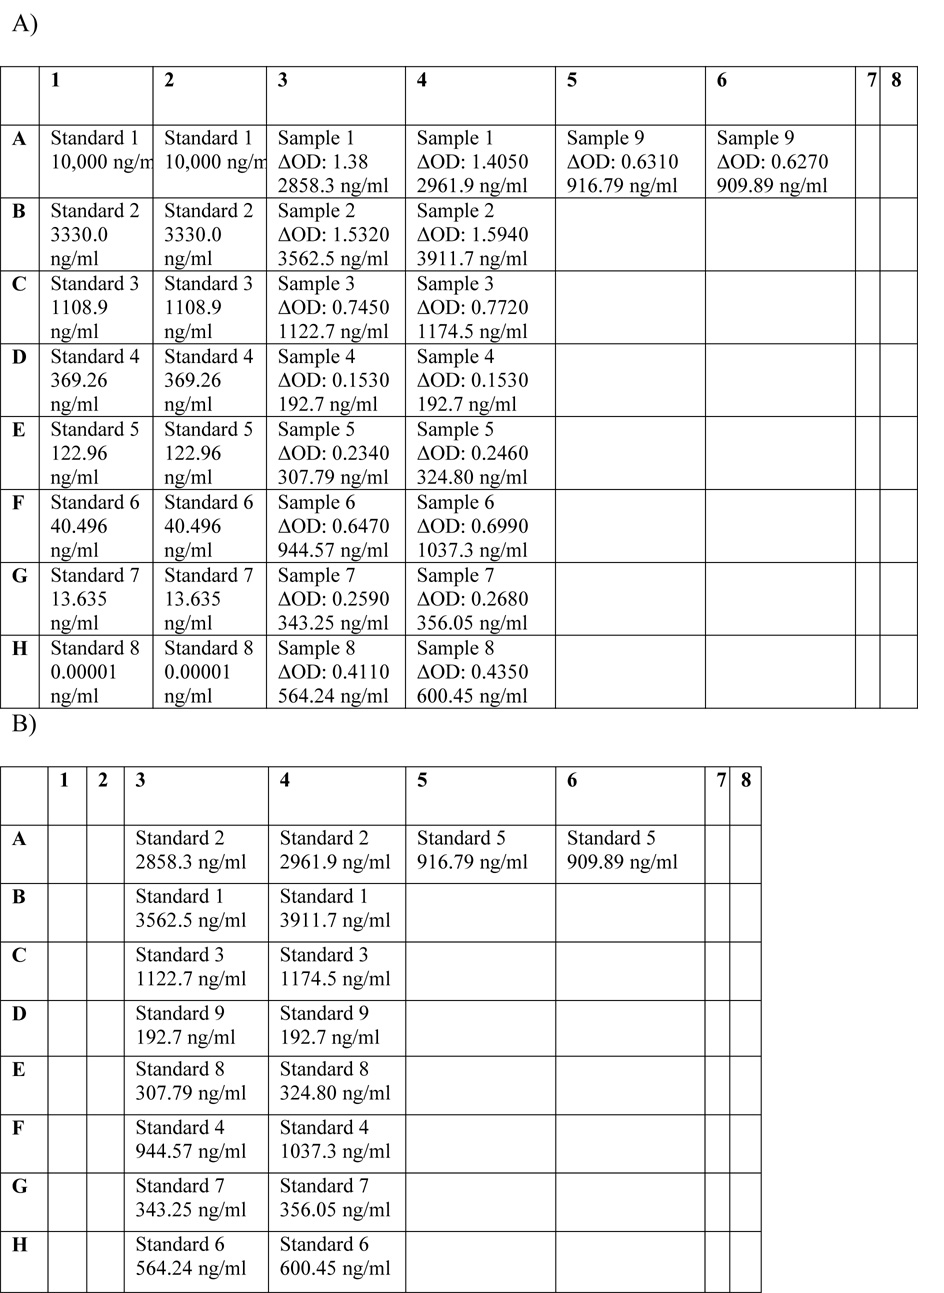
The OD590 is monitored in order to ensure consistent color development in each ELISA run. Plotting of OD590 versus ΔOD resulted in an r2 value of 0.98, indicating that OD590 is an effective method to monitor color development (Figure 1). Once concentrations are determined for the samples in the new standard run, those samples must be re-labeled as standards so they may be applied back to the initial run. In order to illustrate this, a sample 96-well plate layout for the new standard run is shown in Figure 2. The chosen samples are rerun by the same method as the initial sample run. Once these concentrations are determined, these same wells are re-labeled as standards and the measured concentrations are entered manually. This new standard is applied back to the initial sample run to interpolate sample concentrations.
Figure 1.
Correlation of OD590 and ΔOD- Samples were read before and after addition of acid to stop color development. OD 590nm was plotted against ΔOD to reveal a linear relationship.
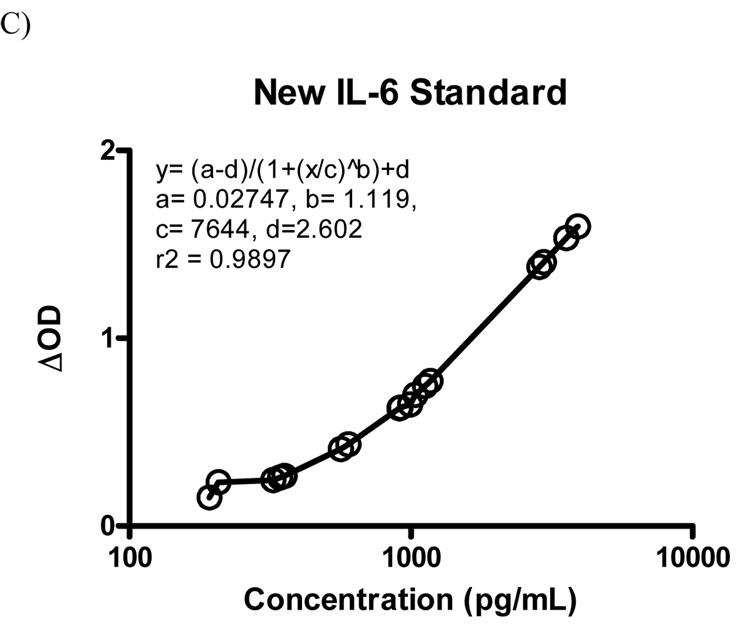
Figure 2.
96-well plate layouts for generation of new standard curve. A) Plate layout with standard curve used to determine chosen sample concentrations. Standard concentrations are entered manually based on 1:3 dilutions of top standard. Sample concentrations are determined using standard curve. B) Re-labeling of sample wells as standards by manually inputting average concentrations of samples determined in the new standard run. C) Example of the new standard curve constructed for mouse IL-6.
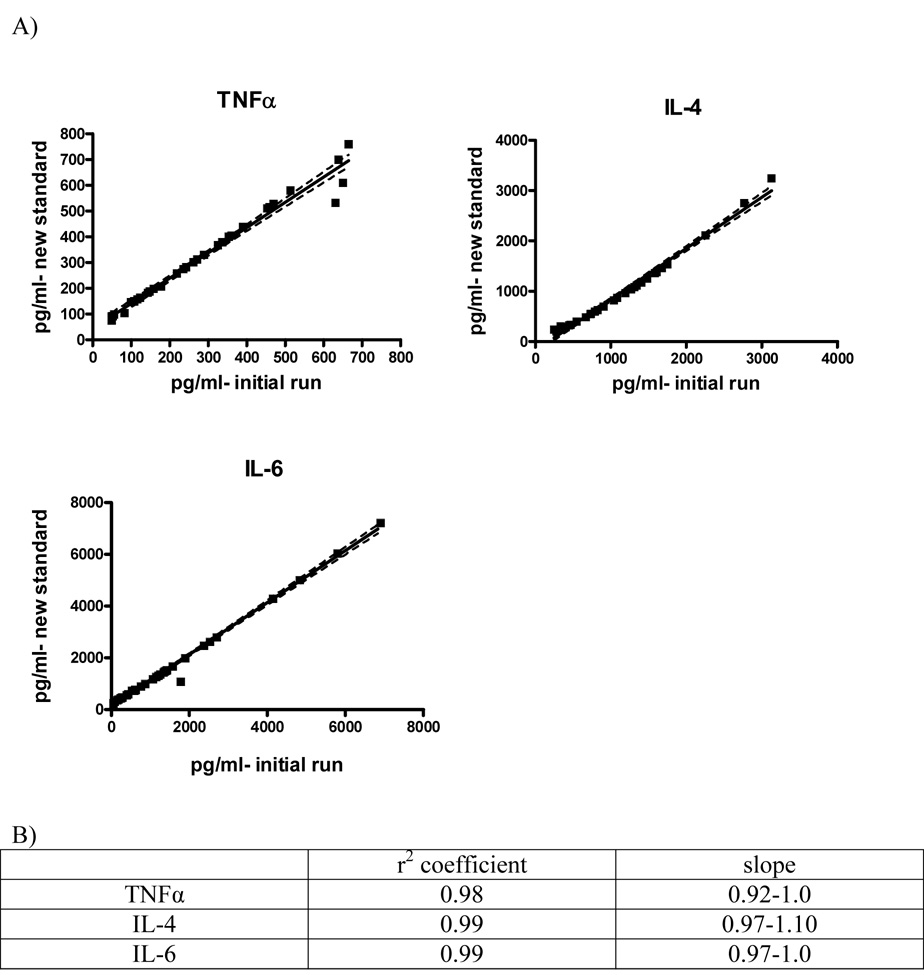
In order to validate this method, 40 samples were prepared by spiking normal mouse plasma with a range of concentrations of the mouse recombinant cytokines TNFα, IL-4 and IL-6. Concentrations of the samples determined in the initial sample run plotted against those determined by applying the newly generated standard results in a linear correlation between the two methods with an r2 ≥ 0.98 for all cytokines (Figure 3). Upon performing linear regression analysis, a slope of 1 indicates perfect agreement between the initial run and the application of the new standard. The slopes of the regression lines for all cytokines used were between 0.92 and 1.10, indicating that the new standard curve is a highly effective means by which to determine sample concentration.
Figure 3.
Validation of the accuracy of the new standard curve. A) Sample concentrations determined by the initial sample run were plotted against those determined using the newly generated standard. The graphs show a nearly 1:1 correlation for all cytokines used, indicating the accuracy of this method. B) r2 values and slopes indicate the new standard correctly calculates the concentration.
This method is based upon the concept that an unsuccessful standard curve does not negate the usefulness of the entire ELISA assay. Additionally, this method is most effective with samples that contain varying concentrations of the protein to be assayed. Samples with a wide range of concentrations will maximize the dynamic range of the new standard curve, making it more robust. We must emphasize the importance of measuring the OD590 for all ELISA assays having greater than 20 samples, as it provides the researcher the option to use this method if the standard curve is not satisfactory. Significant resources may be saved as this method requires only the time needed to rerun 10 or fewer samples, saving both the time and money otherwise required for repeating experiments to collect more sample.
Acknowledgments
This work was supported by NIH grants ES13528 and GM 67189.
Footnotes
Publisher's Disclaimer: This is a PDF file of an unedited manuscript that has been accepted for publication. As a service to our customers we are providing this early version of the manuscript. The manuscript will undergo copyediting, typesetting, and review of the resulting proof before it is published in its final citable form. Please note that during the production process errors may be discovered which could affect the content, and all legal disclaimers that apply to the journal pertain.
References
- Boscato LM, Stuart MC. Heterophilic antibodies: a problem for all immunoassays. Clin Chem. 1988;34:27–33. [PubMed] [Google Scholar]
- DeForge LE, Remick DG. Sandwich ELISA for detection of picogram quantities of interleukin-8. Immunol Invest. 1991;20:89–97. doi: 10.3109/08820139109054928. [DOI] [PubMed] [Google Scholar]
- Nemzek JA, Siddiqui J, Remick DG. Development and optimization of cytokine ELISAs using commercial antibody pairs. J Immunol Methods. 2001;255:149–157. doi: 10.1016/s0022-1759(01)00419-7. [DOI] [PubMed] [Google Scholar]
- O'Connor KA, Holguin A, Hansen MK, Maier SF, Watkins LR. A method for measuring multiple cytokines from small samples. Brain Behav Immun. 2004;18:274–280. doi: 10.1016/j.bbi.2003.09.009. [DOI] [PubMed] [Google Scholar]
- Osuchowski MF, Welch K, Siddiqui J, Remick DG. Circulating cytokine/inhibitor profiles reshape the understanding of the SIRS/CARS continuum in sepsis and predict mortality. J Immunol. 2006;177:1967–1974. doi: 10.4049/jimmunol.177.3.1967. [DOI] [PubMed] [Google Scholar]
- Salonen EM, Vaheri A. Rapid solid-phase enzyme immunoassay for antibodies to viruses and other microbes: effects of polyethylene glycol. J Immunol Methods. 1981;41:95–103. doi: 10.1016/0022-1759(81)90277-5. [DOI] [PubMed] [Google Scholar]


