Abstract
Neuronal dynamics result from the integration of forces developed by molecular motors, especially conventional myosins. Myosin IIC is a recently discovered nonsarcomeric conventional myosin motor, the function of which is poorly understood, particularly in relation to the separate but coupled activities of its close homologues, myosins IIA and IIB, which participate in neuronal adhesion, outgrowth and retraction. To determine myosin IIC function, we have applied a comparative functional knockdown approach by using isoform-specific antisense oligodeoxyribonucleotides to deplete expression within neuronally derived cells. Myosin IIC was found to be critical for driving neuronal process outgrowth, a function that it shares with myosin IIB. Additionally, myosin IIC modulates neuronal cell adhesion, a function that it shares with myosin IIA but not myosin IIB. Consistent with this role, myosin IIC knockdown caused a concomitant decrease in paxillin-phospho-Tyr118 immunofluorescence, similar to knockdown of myosin IIA but not myosin IIB. Myosin IIC depletion also created a distinctive phenotype with increased cell body diameter, increased vacuolization, and impaired responsiveness to triggered neurite collapse by lysophosphatidic acid. This novel combination of properties suggests that myosin IIC must participate in distinctive cellular roles and reinforces our view that closely related motor isoforms drive diverse functions within neuronal cells.
INTRODUCTION
Neuronal dynamics are powered by molecular motors responsible for growth cone motility and cellular locomotion in response to external guidance cues. Although microtubular motors are essential for neuritogenesis and power the vesicular transport of building materials during neurite assembly, considerable evidence has accumulated to suggest that actin-based motility is responsible for many aspects of cell motility, growth cone movement and neurite outgrowth (e.g., Kuczmarski and Rosenbaum, 1978; Letourneau, 1981; Miller et al., 1992; Rochlin et al., 1995; Wylie et al., 1998; Bridgman et al., 2001; Chantler and Wylie, 2003; Ma et al., 2004; Even-Ram et al., 2007).
The myosin superfamily comprises as many as 24 separate classes of molecule (Foth et al., 2007); yet, many aspects of neuronal movement seem to be dependent on the conventional (class II) myosins—two-headed ATP-driven molecular motors that, as a group, are responsible for muscle contraction and many aspects of nonmuscle cell motility (Chantler and Wylie, 2003). The nonsarcomeric conventional motors, myosins IIA and IIB (Katsuragawa et al., 1989; Kawamoto and Adelstein, 1991; Simons et al., 1991), have variously been shown to be involved in cytokinesis (De Lozanne and Spudich, 1987; DeBiasio et al., 1996; Zang et al., 1997; Takeda et al., 2003; Jana et al., 2006), maintenance of cell morphology (Bialik et al., 2004; Ryu et al., 2006; Even-Ram et al., 2007) and cortical tension (Chrzanowska-Wodnicka and Burridge, 1996; van Leeuwen et al., 1999), adhesion (Wylie and Chantler, 2001; Conti et al., 2004; Cai et al., 2006; Giannone et al., 2007; Ma et al., 2007), locomotion (DeBiasio et al., 1996; Svitkina et al., 1997; Even-Ram et al., 2007), exocytosis-dependent membrane repair (Togo and Steinhardt, 2004) as well as cell guidance and migration in neuronal (Schmidt et al., 2002; Ma et al., 2004, 2006; Turney and Bridgman, 2005), glioma (Gillespie et al., 1999), neutrophil (Eddy et al., 2000), fibroblast (Lo et al., 2004; Vicente-Manzanares et al., 2007), and endothelial (Kolega, 2003) cells. A third isoform, myosin IIC, has recently been established after a trawl of genomic databases (Golomb et al., 2004), adding to the functional complexity. The three myosin II isoforms are highly conserved, with 80% identity and 89% similarity between the amino acid sequences of myosins IIA and IIB and 64% identity and ∼80% similarity for myosin IIC and either myosin IIA or IIB (Golomb et al., 2004). Myosins IIA and IIB have been shown to exhibit differential distributions and functions, characteristic of cell type (Rochlin et al., 1995; Simerly et al., 1998; Chantler and Wylie, 2003; Kolega, 2003; Togo and Steinhardt, 2004). In neuronal cells, myosin IIB is required for the outgrowth of neuritic processes (Wylie et al., 1998; Bridgman et al., 2001), whereas myosin IIA has been shown to drive retraction (Amano et al., 1998; Wylie and Chantler, 2003) and is necessary for focal contact formation and cell adhesion (Wylie and Chantler, 2001; Conti et al., 2004). By contrast, the functional roles of myosin IIC have remained obscure. Although the presence of myosin IIC in adult tissues is well documented (Golomb et al., 2004), little is known of its function (Clark et al., 2007). It is well-represented in the organ of Corti within the cochlear (Donaudy et al., 2004) and known point mutations in myosin IIC contribute to the pathophysiology of hereditary hearing loss (Donaudy et al., 2004; Kim et al., 2005). The C1 inserted form of myosin IIC is required for cytokinesis in a tumor cell line (Jana et al., 2006).
Myosin isoform ablation is a powerful and specific approach to assess isoform function. This can be accomplished by breeding knockout mice (Tullio et al., 1997, 2001; Takeda et al., 2003; Conti et al., 2004) and isolating embryonic cells deficient in a particular isoform (Bridgman et al., 2001; Conti et al., 2004; Lo et al., 2004), or by functional knockdown procedures in culture by using antisense DNA oligonucleotides (Wylie et al., 1998; Wylie and Chantler, 2001; Wylie and Chantler, 2003; Chantler and Wylie 2003; Togo and Steinhardt, 2004) or small interfering RNA (siRNA; Bao et al., 2005; Cai et al., 2006; Sandquist et al., 2006; Vicente-Manzanares et al., 2007). An advantage of knockdown techniques is that a specified isoform deficit can be established against a normal protein expression background, whereas knockout cells may possess subtle abnormalities, such as an altered cytoskeleton or functional compensation by other motors, during the development of the knockout animals from which the cells derive. To define the function of myosin IIC in neuronal cells, we have devised antisense knockdown strategies using newly designed sets of isoform-specific oligonucleotides to target myosins IIA, IIB, and IIC, taking into account the latest sequence information for myosins IIA (D'Apolito et al., 2002), IIB (Huang et al., 2003), and IIC (Golomb et al., 2004). Here, we establish, using a functional knockdown approach, the distinctive functions of myosin IIC, which show similarities to, yet key differences from, the roles played by myosins IIA and IIB during neuronal cell dynamics.
MATERIALS AND METHODS
Cells
Cells from the mouse neuroblastoma cell line Neuro-2A were cultured in DMEM (Invitrogen, Paisley, United Kingdom) supplemented with 10% fetal bovine serum (Invitrogen) (Miller et al., 1992; Wylie et al., 1998), conditions that maintained the cells in a rounded, undifferentiated phenotype. To elicit neurite outgrowth, cells were transferred to serum-free media supplemented with 5 μg/ml insulin, 5 μg/ml transferrin, 20 nM progesterone, 100 μM putrescine, and 30 nM sodium selenite before oligonucleotide treatment. Cells were grown and examined on polylysinated (0.1 mg/ml) coverslips coated with 10 μg/ml fibronectin (Wylie and Chantler, 2001).
Molecular Analysis
Total RNA was isolated by use of TRIzol reagent (Invitrogen) through a single-step procedure (Chomczynski and Sacchi, 1987), adding 5–10 μg of RNase-free glycogen (Roche Diagnostics, Mannheim, Germany) to the aqueous phase as a carrier before RNA precipitation, as described previously (Wylie et al., 1998). cDNA production was primed using random hexamers (Clontech, Mountain View, CA) to ensure complete representation of myosin transcripts. The reverse transcriptase-polymerase chain reaction (RT-PCR) was performed as described previously (Wylie et al., 1998), with RNA samples being harvested from ∼3 × 10⁵ Neuro-2A cells at each time point. RT-PCR was performed using 35 cycles of amplification (94°C for 30″; 60°C for 1′; 72°C for 2′, and a final 7′ extension at 72°C). Primers were selected with the aid of Primer3 software (Rozen and Skaletsky, 2000). Primers used for the mouse nonmuscle myosin IIA isoform (NM022410) were 5′-GCTAGCCTCAAGGAGGAGGT-3′ (20-mer upstream primer) and 5′-AGGCCTCTAGGATAGGGTTG-3′ (20-mer downstream primer), giving rise to a 532-bp amplicon. Primers used for myosin IIB (NM175260) were 5′-GGGACTTGAGTGAGGAGCTG-3′ (20-mer upstream primer) and 5′-TTTCTGCCGTGTCTCTTCCT-3′ (20-mer downstream primer) giving rise to a 569-bp amplicon. Primers used for myosin IIC (NM028021) were 5′-GGCTGAGTTCTCCTCACAGG-3′ (20-mer upstream primer) and 5′-CCTGGCTATGCCTCTGTCTC-3′ (20-mer downstream primer), giving rise to a 587-bp amplicon. Primers used for actin (positive control) were 5′-TGTGATGGTGGGAATGGGTCAG-3′ (22-mer upstream primer) and 5′-TTTGATGTCACGCACGATTTCC-3′ (22-mer downstream primer), derived for mouse β-actin (NM007393), giving rise to a 514-bp amplicon. Primers used for glyceraldehyde-3-phosphate dehydrogenase (G3PDH) (positive control) were 5′-TGAAGGTCGGTGTGAACGGATTTGGC-3′ (26-mer upstream primer) and 5′-CATGTAGGCCATGAGGTCCACCAC-3′ (24-mer downstream primer), derived for mouse G3PDH (NM001001303), giving rise to a 983-bp amplicon.
For quantification, three densitometry determinations were made across each of the appropriate antisense bands for each isoform; similar measurements were made across the equivalent bands in the sense lanes. Background values were obtained from adjacent blank areas above and below each relevant lane and the average of these was subtracted from the averages of each sense or antisense group obtained. Reduction in band intensity is reported as a percentage [i.e., (antisense value/sense value) × 100)].
Immunofluorescence
Nonmuscle myosins IIA and IIB were detected by indirect immunofluorescence using isoform-specific primary polyclonal rabbit antibodies (titer range, 1–1.5 mg/ml; Sigma Chemical. Poole, Dorset, United Kingdom). In either case, they were used at 1:300 dilution and detected using a secondary Alexa Fluor 633-conjugated goat anti-rabbit immunoglobulin G (IgG; 1:50 dilution; Sigma Chemical). Nonmuscle myosin IIC was detected by indirect immunofluorescence, by using a primary polyclonal rabbit antibody that recognized the C-terminal end of mouse myosin IIC (titer 1.13 mg/ml; a gift from Dr. Bob Adelstein, National Institutes of Health). These were used at 1:300 dilution and routinely detected with a secondary swine anti-rabbit IgG (1:50 dilution; Dako UK, Ely, Cambridgeshire, United Kingdom) conjugated to either fluorescein isothiocyanate (FITC) or Alexa Fluor 633. In myosin double-labeling experiments, veracity of staining patterns was further established through switching of the dye label on the secondaries. Filamentous actin was detected using rhodamine-phalloidin (Invitrogen, Carlsbad, CA) added at a concentration of 165 nM simultaneously with the secondary antibody. Rabbit polyclonal antibodies specific for paxillin phosphorylated on Tyr118 (Cell Signaling Technology, Danvers, MA) were used at 1:50 dilution and detected using a FITC-conjugated secondary swine anti-rabbit IgG (1:50 dilution; Dako UK). All dilutions of antibodies were made up in 1% horse serum/phosphate-buffered saline (PBS), including 0.1% Triton X-100 and 0.001% sodium azide.
Cells were plated onto polylysinated coverslips and stained at appropriate times. After equilibration of cells and all solutions for 30 min, we used a brief live-cell extraction before fixation in freshly prepared formaldehyde solution (4%), which we have adapted for neuronal cells from a protocol originally developed by Cramer and Mitchison (1995) to enhance myosin staining as seen by immunofluorescence. Specifically, a brief (10-s) extraction step in cytoskeletal buffer [10 mM 2-(N-morpholino)ethanesulfonic acid, pH 6.1, 138 mM KCl, 3 mM MgCl2, and 2 mM EGTA] supplemented with 0.32 M sucrose, 0.1% Triton X-100, and 1 μM/ml phalloidin (Calbiochem, San Diego, CA), was followed by a 30-min fixation in cytoskeletal buffer supplemented with 0.32 M sucrose and 4% formaldehyde. After permeabilization (10 min in PBS plus 0.5% Triton X-100), cells were rinsed in PBS and then immersed in 2% decomplemented horse serum in PBS for 45 min to block nonspecific sites before antibody treatment. Incubation with primary and secondary antibodies was for 2 h and 45 min, respectively. Between incubations, several brief (30 s) rinses in 1% horse serum/PBS were performed, the final rinse lasting for 5 min. After exposure to antibodies and further extensive washing with 1% horse serum/PBS at first, then PBS alone, cells were mounted in a solution of glycerol:PBS (containing 2.5% DABCO [Sigma Chemical], vol/vol = 9:1) to prevent fluorescence quenching, before image acquisition.
Immunoblotting
Homogenates of Neuro-2A cells were processed from four wells (∼5 × 10⁵ cells) for SDS gel electrophoresis (7% acrylamide gels with reduced concentrations of bis-acrylamide) (Murakami and Elzinga, 1992). Proteins were transferred to polyvinylidene difluoride (PVDF) membrane by standard procedures (Towbin et al., 1979), and lanes were cut for subsequent separate incubation with antibodies against myosins IIA, IIB, and IIC. Membranes were blocked in 5% nonfat milk for 90 min before the addition of primary antibody at dilutions of 1:1000 (IIA), 1:200 (IIB), and 1:100 (IIC) overnight. After removal of primary antibodies, immunoblots were incubated for 2 h with secondaries before development using an ECL-Plus kit (GE Healthcare, Little Chalfont, Buckinghamshire, United Kingdom).
For quantification, densitometry of the immunoblots was performed as follows: Measurements were made at right angles to each horizontal band, there being two separate measurements made in each half-lane. Measurements were made on both antisense and sense bands, each being performed in triplicate. All measurements pertaining to a particular band were then averaged. Background values were obtained from adjacent blank regions of the band in question and the average of these was subtracted from the averages of each sense or antisense group obtained. Reduction in band intensity for any isoform was expressed as a percentage [i.e., (antisense value/sense value) × 100].
Confocal Laser Scanning and Differential Interference Contrast (DIC) Microscopy; Image Acquisition and Quantification
Confocal laser scanning (CLS) fluorescence microscopy was performed as described previously (Wylie and Chantler, 2003), by using an LSM 510 confocal laser scanning microscope (Carl Zeiss, Jena, Germany) equipped with both 40× Fluar (numerical aperture [N.A.] 1.3) and 100× Plan-Apochromat (N.A. 1.4) oil immersion objectives, a 63× Plan NeoFluar (N.A. 1.4) water immersion objective, and argon (λex = 488 nm) and He-Ne (λex = 543 nm and λex = 633 nm) lasers. Measurement of individual neurite lengths from the tip of each neurite to the edge of the cell soma, together with the number of neurites per cell, was possible through the use of DIC on an Axiovert 135 inverted microscope (Carl Zeiss). Digitized images were used to measure neurite length using Kontron 300 software (Carl Zeiss).
In the paxillin-phospho-Tyr118 immunofluorescence experiments, levels of immunofluorescence were compared quantitatively by defining regions of interest (n = 4–6) in each of six cells for every experimental grouping, by using Zeiss confocal software. Data were exported to Excel (Microsoft, Redmond, WA), and mean values for the number of pixels at each intensity were calculated to obtain a single intensity histogram for each treatment. Intensity scores for each defined cell area were obtained from summed intensity values, Σ1254(bin#n(nth frequency)), and values are expressed per pixel (Parsons-Wingerter et al., 2005). All scanning parameters were identical for all cell images. Quantitative assessment of the intensity data using the Kolmogorov–Smirnov test indicated that both the sense and antisense intensity data-spread differed significantly from normal. Consequently, differences in overall intensity between treatment groups (sense vs. antisense) were established using the Wilcoxon signed-rank test, by randomly selecting 30 matched sense/antisense pairings from each set of 254 intensity bins.
Determination of Cell Density
Cell density (number of cells per square millimeter) was determined as described previously (Wylie and Chantler, 2001). Cells were counted individually from six to 12 fields (20× objective) per well at each time point. The same patches of plated adherent cells were individually counted (Kontron 300 software) at 24-h intervals, for a total of 168 h. Results were normalized to the combined average of all untreated groups (12 wells in total) at each time point, expressing the final value as a percentage. Statistical analysis was performed as described previously (Wylie et al., 1998; Wylie and Chantler, 2001).
Oligonucleotide Treatment
Protocols for oligonucleotide treatment of Neuro-2A cells in serum-free media were as described previously (Wylie et al., 1998; Wylie and Chantler, 2001; Wylie and Chantler, 2003). Briefly, incubation with oligonucleotide began at a concentration of 50 μM, with supplements being added (25 μM with each addition) every 12 h to compensate for oligonucleotide degradation (Ferreira et al., 1992). However, previously used oligonucleotides targeting myosin IIA or IIB sense (AQ5, A5, BQ5, or B5), antisense (AQ3, A3, BQ3, or B3) or scrambled (AQ3R, A3R, BQ3R, or B3R) sequences were replaced by new sense (AP5: 5′-CAGGCTGCAGACAAGTACCT-3′; BP5: 5′-AATGGCCCAGAGAACTGGA-3′), antisense (AP3: 5′-AGGTACTTGTCTGCAGCCTG-3′; BP3: 5′-TCCAGTTCTCTGGGCCATT-3′) and scrambled (AP3R: 5′-TGCTGACTGATGCGTGACTC-3′; BP3R: 5′-TTACTCTCGCAGTCGGTCT-3′) oligonucleotides. These oligonucleotides are completely compatible with both mouse and rat targeted transcripts, and they are based on recently deposited sequences for myosin IIA (NM022410; D'Apolito et al., 2002) and myosin IIB (NM175260; Huang et al., 2003); furthermore, these sequences do not match equivalent regions within myosin IIC transcripts. Myosin IIC was targeted with the following sense (CP5: 5′-CATCATCTCCAAAGGGCAGG-3′), antisense (CP3: 5′-CCTGCCCTTTGGAGATGATG-3′) and scrambled (CP3R: 5′-GTCTGATTAGCCGCTAGCGT-3′) oligonucleotides, the designs of which were based on the complete mouse myosin IIC sequence (NM028021; Golomb et al., 2004). Computerized searches, made against EMBL and GenBank databases, ensured that the scrambled sequences were unique.
Neurite Retraction: Application of Lysophosphatidic Acid (LPA) and Y27632
Neurite retraction was examined using identical protocols to those described previously (Wylie and Chantler, 2003). Briefly, 1 μM LPA (Sigma Chemical), freshly prepared in media, was added as a 20-μl pulse to the cultured cells located in a preselected quadrant of the coverslip, to initiate retraction. The Rho-kinase inhibitor Y27632 (50 μM; Calbiochem), when required, was added 30 min before the addition of LPA. For serial measures, the same patch of cells was monitored using DIC optics from the start of the timed series, as described previously (Wylie and Chantler, 2003). Digitized images (Kontron KS 300) were obtained at 0, 1, 2, 3, 4, 5, 10, 15, 20, and 30 min after initiation of retraction.
RESULTS
Localization of Myosins IIA, IIB, and IIC
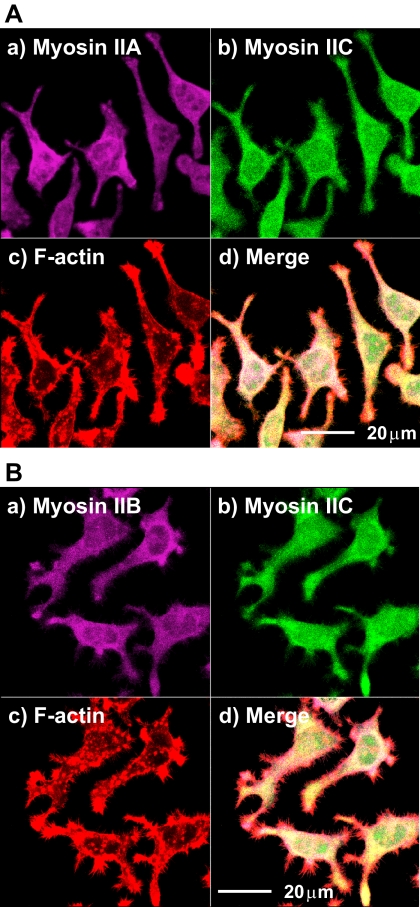
The normal distribution of myosins IIA, IIB, and IIC in mouse Neuro-2A neuroblastoma cells was established relative to the actin cytoskeleton by using isoform-specific antibodies (Figure 1; Supplemental Material, confocal stacks 1–4). Each isoform displays a characteristic organization extending throughout the cytoplasm; the differences are subtle because their localizations overlap significantly, as readily seen in the stack projection images (Figure 1). Although F-actin shows a pronounced peripheral localization within prominent microspikes and discrete puncta, differences in the arrangements of the three myosin isoforms appear distinct when viewed at different heights above the substratum (Supplemental Material, confocal stacks 1–4), and their distributions are described in detail in text accompanying the Supplemental Material. Briefly, myosin IIC immunofluorescence is punctate and distributed throughout the cytoplasm, whereas myosins IIA and IIB tend to be broadly peripheral in their location, although all three isoforms overlap considerably. Normally, myosin IIA immunofluorescence is stronger than either that from myosin IIB or myosin IIC within neuritic shafts. All three isoforms display immunofluorescence within the growth cones. At high magnification (100× lens), some colocalization of myosin IIC with F-actin can be seen (Supplemental Material, confocal stack 4). At cytoplasmic levels >2 μm above the substratum, localization of F-actin and all three conventional myosin isoforms becomes more cortical (Supplemental Material, confocal stacks 1–3).
Figure 1.
Localization of myosins IIA, IIB, and IIC in Neuro-2A cells as seen in projection images of confocal stacks. The normal distribution of myosin IIC in Neuro-2A cells was determined relative to F-actin and myosin IIA (A) or myosin IIB (B) through immunofluorescence by using confocal laser scanning microscopy. In A and B, myosin IIC immunofluorescence is green (FITC-labeled secondary) (b) and rhodamine-phalloidin F-actin, red (c). Both myosin IIA (A) and myosin IIB (B) are violet (Alexa Fluor 633-labeled secondary) (a). Merged images are seen in d. Scale bars are shown in d.
Oligonucleotide Specificity
We designed isoform-specific oligodeoxyribonucleotides to target the recently discovered isoform, myosin IIC (Golomb et al., 2004). In addition, oligonucleotides that had been used to target myosins IIA and IIB (Wylie et al., 1998; Wylie and Chantler, 2001, 2003) were redesigned to take account of mouse-specific sequence differences (D'Apolito et al., 2002; Huang et al., 2003). Sense sequence corresponded to amino acid residues QAADKYL (myosin IIA), MAQRTG (myosin IIB), and ASSPKG (myosin IIC) between residues ∼50 and ∼223 in the N-terminal portion of each myosin head. Scrambled oligonucleotides were also synthesized and corresponded in each case to the base composition of the antisense oligonucleotides except that the sequence was jumbled and had no match to any other entry in the database. Sense and scrambled oligonucleotides served as controls in these experiments.
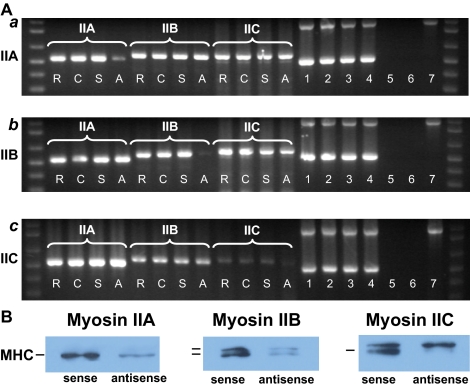
RT-PCR was used to monitor message levels of myosin IIA, IIB, and IIC in Neuro-2A cells subsequent to oligonucleotide treatments (Figure 2A). In all cases, antisense oligonucleotides led to attenuated expression of the targeted myosin isoform transcripts after 96 h of treatment, whereas levels in control cultures, treated with sense or scrambled oligonucleotides, remained unchanged (Figure 2A). These changes were quantified by densitometry: antisense treatments led to a reduction of cognate RNA message by 82% (myosin IIA), 93% (myosin IIB), and 82% (myosin IIC). Our targeting procedure was specific with respect to each of these closely related mRNAs (Figure 2A). Results obtained, after amplification of myosin IIA cDNAs extracted from treated cells, with specific primers designed to recognize either myosin IIB or IIC, indicated no effect on their transcript expression (Figure 2A,a). Similarly, amplicons obtained from cells treated with sense, antisense, or scrambled oligonucleotides targeting either myosins IIB or IIC indicated no effect on message levels of the other two isoforms not targeted during outgrowth (Figure 2A, b and c).
Figure 2.
(A) RT-PCR demonstration that the isoform-specific antisense oligonucleotides targeting myosins IIA, IIB, and IIC attenuate their targets specifically, and do not affect expression of other myosin transcripts. RNA samples were harvested from ∼3 × 10⁵ Neuro-2A cells, which had been exposed to oligonucleotides targeting either myosin IIA (a), IIB (b), or IIC (c) for 96 h after plating and then used to synthesize cDNA. In each case, cDNA was amplified using primers specific for myosin IIA, IIB, or IIC. R, scrambled oligonucleotides; C, no oligonucleotides; S, sense oligonucleotides; A, antisense oligonucleotides. Lanes 1–4, samples from myosin IIA, IIB, or IIC (R, C, S, and A) that were amplified using primers for mouse β-actin and G3PDH, to demonstrate consistency of loading. Markers are seen at the extreme ends of each gel. Negative controls are seen in lanes 5 and 6. Lane 5, total RNA as template (i.e., no reverse transcriptase [Moloney murine leukemia virus, MMLV] added to PCR in the presence of mouse G3PDH primers), which also tests for genomic DNA contamination; lane 6, no functional amplification in the presence of cDNA (i.e., no Taq polymerase added to PCR in the presence of mouse G3PDH primers), to test for general levels of contamination). Lane 7 indicates amplification of human placental RNA for G3PDH as positive control (supplied with kit) producing a 983-bp product. (B) Immunoblot demonstrating that attenuation of myosin IIA, IIB, and IIC expression arising from antisense knockdown. Homogenates from Neuro-2A cells, plated for 96 h in the presence of isoform-specific oligonucleotides, were run on 7.5% SDS-acrylamide gels before electrophoretic blotting on to PVDF membranes. Sister lanes from blots of sense- and antisense-treated materials were probed with isoform-specific antibodies recognizing myosins IIA, IIB, and IIC. The corresponding myosin heavy chains (MHCs) are indicated in the figure by short bars. Note that the upper band in the myosin IIC immunoblot is unrelated to myosin (Buxton et al., 2004). Isoform-specific antisense oligonucleotides used here attenuate expression of all targeted peptides. See text for details.
Attenuation of Protein Expression
Antisense knockdown of isoform-specific transcripts leads to a corresponding decrease in protein expression of the targeted isoform. Neuro-2A cell homogenates were examined by immunoblotting by using isoform-specific antibodies. Homogenates were prepared from ∼1 × 10⁶ Neuro-2A cells after 96 h of treatment with either sense (AP5, BP5, or CP5) or antisense (AP3, BP3, or CP3) oligonucleotides (as described above) and then examined by immunoblotting (Figure 2B). We observed a single myosin heavy chain band for myosin IIA and doublet bands for myosins IIB and IIC, all from sense-treated samples—patterns that have been described previously for untreated homogenates from myosins IIA (Murakami et al., 1993), IIB (Murakami et al., 1993; Itoh and Adelstein, 1995), and IIC (Buxton et al., 2004). The upper band of the myosin IIC doublet has been shown not to be a myosin peptide, but a protein of similar size that cross-reacts with the anti-myosin IIC C-terminal antibody (Buxton et al., 2004). Consistent with this assignation, antisense targeting of myosin IIC eliminated expression of the lower band within this doublet but had no effect on the upper band (Figure 2B). Both myosin IIA and myosin IIB heavy chain expression were attenuated by treatment of Neuro-2A cells with their respective antisense oligonucleotides (Figure 2B). Quantification of the immunoblot results indicate the following reductions in protein expression consequential to antisense action, expressed as a percentage of the corresponding band expressed during sense treatment: 87% (myosin IIA), 81 and 72% (myosin IIB; upper and lower bands, respectively), and 82% (myosin IIC).
Neurite Outgrowth
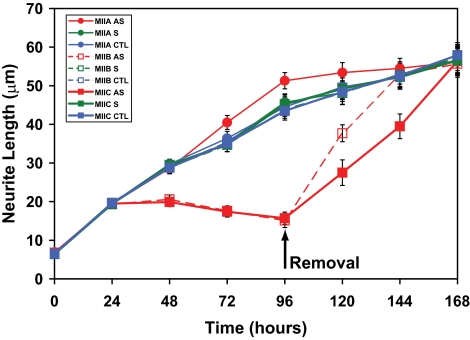
Neuro-2A cells were transferred to serum-free media and treated, separately, with sense (AP5, BP5, or CP5), antisense (AP3, BP3, or CP3), or scrambled (AP3R, BP3R, or CP3R) oligonucleotides every 12 h, for a total of 96 h, when they were removed. Myosin IIA antisense oligonucleotides had no effect upon outgrowth but oligos targeting myosin IIB led to curtailment of outgrowth after 24- to 48-h incubation (Figure 3). Surprisingly, myosin IIC antisense oligonucleotides caused abrogation of neurite outgrowth similar to myosin IIB knockdown (Figure 3); furthermore, rates of recovery upon oligonucleotide removal were somewhat slower. In all cases, application of sense or scrambled oligonucleotides did not alter outgrowth compared with cells grown in the absence of oligonucleotide treatment.
Figure 3.
Effect of oligonucleotides targeting myosins IIA, IIB, and IIC on neurite outgrowth when supplied to Neuro-2A cells at the time of plating. Cells were plated for 96 h in the presence of isoform-specific oligonucleotides before replenishment with oligonucleotide-free media for a further 72 h. Data shown include sense (S), antisense (AS), and control (CTL) (none) time courses for myosin IIA, myosin IIB, and myosin IIC oligonucleotides. Scrambled data, similar to those obtained with sense oligonucleotides, were omitted for clarity. Symbols used are identified within the key (sidebar). Error bars are SEs of the mean from four experiments (>100 cells/time point). Arrow indicates removal of oligonucleotides at 96 h.
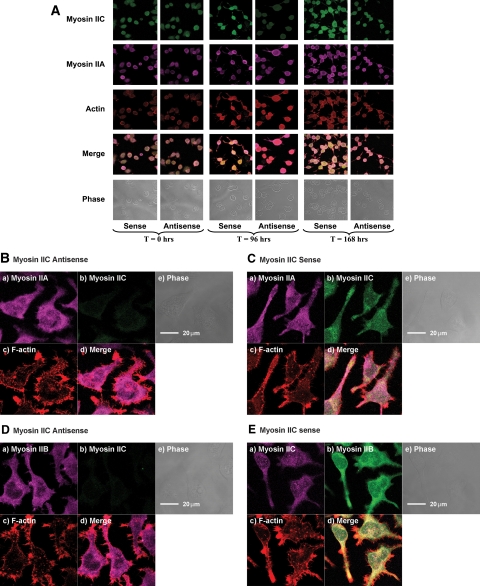
Myosin IIC immunofluorescence was attenuated significantly in cells treated for 96 h with myosin IIC antisense oligonucleotides relative to sense-treated cells (Figure 4A) and cells treated with scrambled oligonucleotides or untreated cells for the same periods. Targeted knockdown of myosin IIC had no apparent effect on the localization of myosin IIA (Figure 4, A–C; Supplemental Material, confocal stacks 5 and 7) or myosin IIB (Figure 4, D and E, and Supplemental Material, confocal stacks 5 and 6) immunofluorescence. Neurite extension was observed for a further 72 h after removal of oligonucleotide by replacement of culture medium at 96 h, demonstrating the reversibility of effects arising from antisense knockdown (Figure 3) and full recovery of immunofluorescence (Figure 4A).
Figure 4.
(A) Immunostaining of Neuro-2A cells during treatment and recovery from oligonucleotides targeting myosin IIC. Cells were observed by confocal laser scanning fluorescence microscopy immediately after addition of (at 0 h), incubation with (after 96 h) or 72 h of recovery from (168 h), isoform-specific oligonucleotides targeting myosin IIC sequence. Cells were triple stained using antibodies that recognize myosin IIC (FITC-labeled secondary; green) and myosin IIA (Alexa Fluor 633-labeled secondary; violet) as well as rhodamine-phalloidin to localize F-actin (red). Results from sense and antisense treatments are shown. Untreated cells and cells treated with scrambled oligonucleotides gave results similar to those seen with sense oligonucleotides (data not shown). Merged images contain information from all three channels (myosin IIA, myosin IIC, and actin). Each frame represents a field ∼153.5 μm2. (B–E). Localization of myosins IIA, IIB, and IIC within Neuro-2A neuroblastoma cells after treatment with oligonucleotides targeting myosin IIC. The distributions of myosin IIA (B and C) or myosin IIB (D and E) relative to F-actin and myosin IIC were observed in Neuro-2A cells subsequent to 96-h exposure to either antisense (B and D) or sense (C and E) oligonucleotides targeting myosin IIC. All images obtained using confocal laser scanning microscopy and are slices taken within 2 μm of the substratum; this ensures inclusion of processes and actin-containing structures thought to be associated with adhesion. Labeling strategies are described in Materials and Methods. In B–D, myosin IIC is localized using a FITC-labeled secondary (green) (b). In all images, rhodamine-phalloidin F-actin is red (c). In B and C, myosin IIA is localized using an Alexa Fluor 633-labeled secondary (violet) (a). In D, myosin IIB is violet (Alexa Fluor 633-labeled secondary) (a). In E, labels are reversed so myosin IIC is violet (Alexa Fluor 633-labeled secondary) (a), whereas myosin IIB is green (FITC-labeled secondary) (b). Remaining frames shown are for merged (d) and phase (e) images. Scale bars are shown in e.
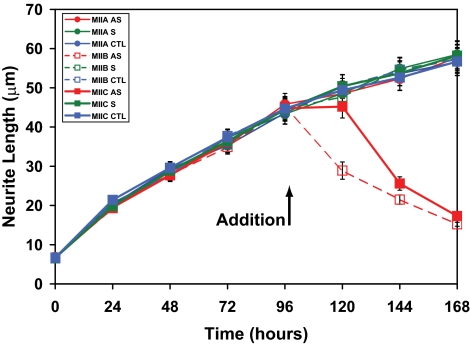
If oligonucleotide applications were delayed for 96 h, so as to allow for significant process outgrowth, it was found that myosin IIC antisense oligonucleotides brought about a slow retraction of neuritic processes (Figure 5), as also seen previously with myosin IIB (Wylie and Chantler, 2003).
Figure 5.
Effect of oligonucleotides targeting myosins IIA, IIB, and IIC on neurite outgrowth when supplied to Neuro-2A cells 96 h after initiation of outgrowth. Cells were plated for 96 h in the absence of isoform-specific oligonucleotides before their application for a further 72 h. Data shown include neurite length measurements from sense (S), antisense (AS), and control (CTL) (none) oligonucleotide regimens targeting myosin IIA, myosin IIB, or myosin IIC. Scrambled data, similar to those obtained with sense oligonucleotides, were omitted for clarity. Symbols used are identified within the key (sidebar). Error bars are SEs of the mean from four experiments (>100 cells/time point). Arrow indicates addition of oligonucleotides at 96 h.
Phenotype
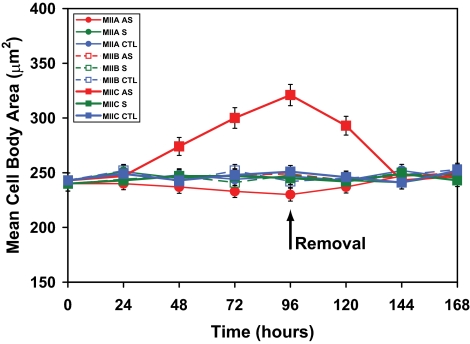
Cells treated with myosin IIC antisense oligonucleotides for 96 h displayed an altered phenotype compared with controls (Figure 6) or cells in which either myosins IIA or IIB had been knocked down (Wylie and Chantler, 2001; Chantler and Wylie, 2003). Significant vacuolization, not seen after 72 h of myosin IIC antisense treatment, would occur abruptly by 96 h. Whereas myosin IIB knockdown had little effect on cell body area and myosin IIA knockdown led to only a small decrease in its size (Wylie and Chantler, 2001), myosin IIC knockdown caused a dramatic expansion in cell body area (∼25%)(Figure 6) and some flattening of the cell body (Supplemental Material, confocal stacks 5–7). These effects could be quantified (Figure 7) and were reversible (Figures 6 and 7).
Figure 6.
Effect of myosin IIC antisense oligonucleotides on the phenotype of Neuro-2A cells. DIC images of Neuro-2A cells treated with oligonucleotides for 96 h that targeted myosin IIC. Whereas control cells (a) exhibited typical profiles of neurite outgrowth, cells treated with antisense oligonucleotides showed a substantial increase in cell body diameter with profuse vacuolization (b). This aberrant phenotype was reversed after a further 72-h recovery period in the absence of oligonucleotide (c). Bar, 60 μm.
Figure 7.
Effect of oligonucleotides targeting myosins IIA, IIB and IIC on the mean cell body area. Cells were plated for 96 h in the presence of isoform-specific oligonucleotides before replenishment with oligonucleotide-free media for a further 72 h. Data shown are measurements of the mean cell body area of Neuro-2A cells subsequent to sense (S), antisense (AS), and control (CTL) (none) oligonucleotide regimens targeting myosin IIA, myosin IIB or myosin IIC. Scrambled data, similar to those obtained with sense oligonucleotides, were omitted for clarity. Symbols used are identified within the key (sidebar). Error bars are SEs of the mean from four experiments (>100 cells/time point). Arrow indicates removal of oligonucleotides at 96 h.
Neurite Number
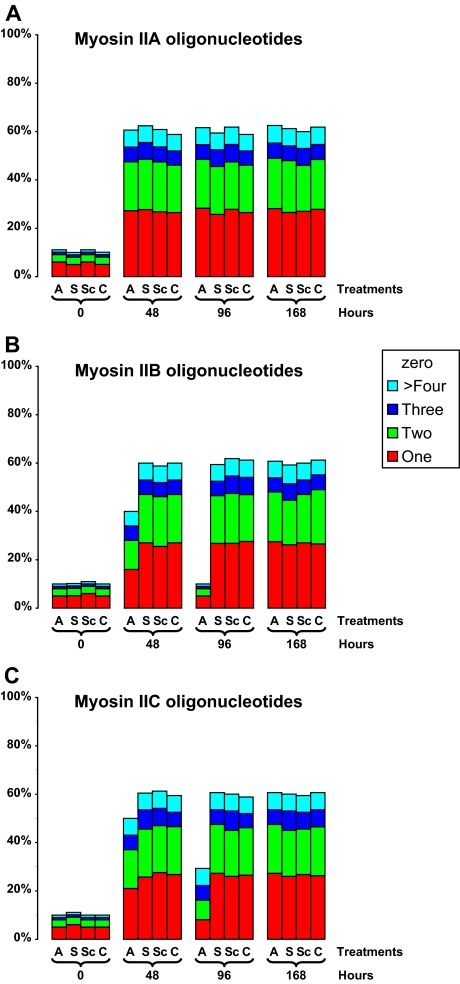
We investigated whether myosin isoform knockdown affected the number of neurites emerging from the neuronal cell body during neuritogenesis. We compared the number of neurites on cells growing in the presence of oligonucleotides directed against myosins IIA, IIB, or IIC for 48 or 96 h, and we determined how this number changed after a 72-h period of recovery. Approximately 60% of plated control cells exhibited neurite outgrowth. Myosin IIA knockdown caused no change in neurite number (Figure 8A): approximately equal numbers of cells (∼25% each) generated either one or two neurites, with ∼5% cells generating three or four neurites apiece. Antisense knockdown of either myosin IIB or IIC led not only to a significant decline in process length (Figure 3) but also to a drop in average neurite number per cell (Figure 8, B and C). Whereas neurite number was diminished in all categories upon myosin IIB knockdown (Figure 8B), cells possessing one or two neurites were disproportionately affected by myosin IIC knockdown (Figure 8C), whereas those with three or more remained unaffected. In all cases, control proportions were reestablished after a recovery period of 72 h (Figure 8, A–C).
Figure 8.
Effect of oligonucleotides targeting myosins IIA, IIB, and IIC on the number of neuritic processes emerging from Neuro-2A cell bodies. Digitized DIC image data sets were evaluated to determine the number of processes arising from each cell body throughout the course of myosin IIA, IIB, and IIC oligonucleotide regimens. The numbers (1 through 4 or more), are tabulated as histograms for each myosin isoform: myosin IIA (A), myosin IIB (B), and myosin IIC (C). Four sets of time point are used: immediately upon plating (0); 48 and 96 h after oligonucleotide administration; 72 h after oligonucleotide removal (168 h in total). For each time point, data are shown for antisense (A), sense (S), or scrambled (Sc) treatments as well as for cells cultured in the absence of oligonucleotide (C). The color coding used is identified within the key (sidebar). Data set comprises 400–800 cells per treatment, except at time zero in which there were 200 cells per treatment. Taken from four experiments in all.
Adhesion
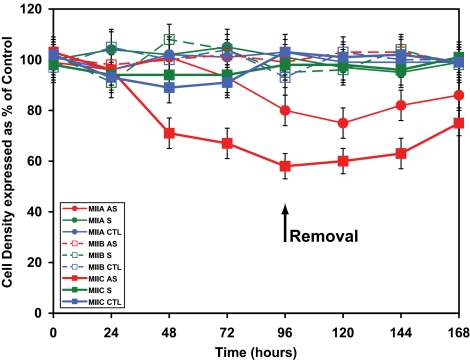
The ability of cells to adhere to the substratum throughout treatment was measured indirectly through determination of adherent cell density. Whereas myosin IIB antisense treatment engendered no change, antisense oligonucleotides targeting both myosin IIA and myosin IIC led to a decline in cell density (Figure 9). Of the two, myosin IIC had the more profound effect, leading to a 40% decrease in cell density after 96-h antisense exposure.
Figure 9.
Effect of oligonucleotides targeting myosins IIA, IIB, and IIC on cell density. Cells were plated for 96 h in the presence of isoform-specific oligonucleotides before replenishment with oligonucleotide-free media for a further 72 h. Plated adherent cells were individually counted using Kontron software at 24-h intervals over the 168-h period. Data shown are determinations of the adherent Neuro-2A cell density after oligonucleotide treatments (sense or antisense regimens that target myosin IIA, myosin IIB, and myosin IIC). Cell densities for each cognate group are expressed as a percentage of the combined density average for all untreated controls (no oligonucleotides). Scrambled data, similar to those obtained with sense oligonucleotides, were omitted for clarity. Cells were counted individually from 6 to 12 fields (20x objective) per well at each time point. Symbols used are identified within the key (sidebar). Error bars are SEs of the mean from four experiments (400–800 cells/time point, except time zero where there were 200 cells/time point). Arrow indicates removal of oligonucleotides at 96 h.
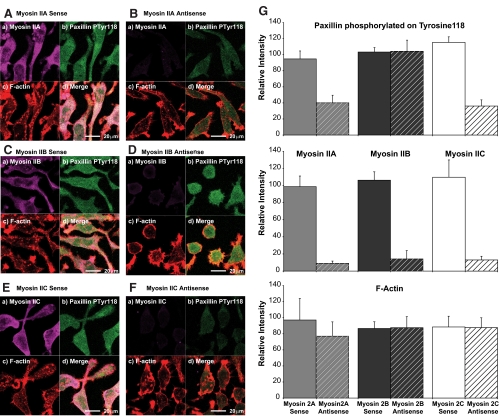
In an effort to gain mechanistic insight into the role of myosin IIC in cell adhesion, we followed myosin antisense knockdown of Neuro-2A cells with a specific antibody that recognizes the focal adhesion protein, paxillin, when phosphorylated on tyrosine-118. Formation of paxillin-phospho-Tyr118 occurs through the action of another focal adhesion component, focal adhesion kinase (FAK) (Bellis et al., 1995, 1997) and is thought to represent an active form of paxillin, its presence correlating with adhesion (Nakamura et al., 2000; Tsubouchi et al., 2002). The distribution of paxillin-phospho-Tyr118 in normal (sense-treated) cells is finely punctate (Figure 10, A, C, and E), the protein being distributed throughout the cell body, processes, and lamellae. Antisense knockdown of either myosin IIA (Figure 10B) or myosin IIC (Figure 10F) led to a coincidental decline in paxillin-phospho-Tyr118 immunofluorescence, whereas a similar knockdown regime for myosin IIB (Figure 10D) left paxillin-phospho-Tyr118 immunofluorescence undiminished. These changes were quantified (Figure 10G), and their statistical significance was verified using the Wilcoxon signed-rank test (see Materials and Methods). Previously, we had shown that myosin oligonucleotides did not have off-target effects on paxillin (Wylie and Chantler, 2001). Together, these data suggest that both myosin IIC and myosin IIA are required for active focal contact assembly.
Figure 10.
Effect of oligonucleotides targeting myosins IIA, IIB, and IIC on the localization of paxillin phosphorylated on Tyr118. The distribution of paxillin phosphorylated on Tyr118 was observed relative to F-actin and myosin IIA (A and B), myosin IIB (C and D), or myosin IIC (E and F) in Neuro-2A cells subsequent to 96-h exposure to either sense (A, C, and E) or antisense (B, D, and F) oligonucleotides targeting myosin IIA (A and B), myosin IIB (C and D), or myosin IIC (E and F). All images were obtained by confocal laser scanning microscopy and are from confocal slices taken within 2 μm of the substratum; this ensures inclusion of all structures associated with adhesion. Labeling strategies are described in Materials and Methods. In all images, myosins are violet (Alexa Fluor 633-labeled secondary) (a), paxillin phosphorylated on Tyr118 is green (FITC-labeled secondary) (b), and rhodamine-phalloidin F-actin is red (c) The merged image and bars are shown in d. Companion 40× Fluar N.A. 1.3 images to the 63× confocal images seen in A–F were used to quantify changes in fluorescence signal intensities. The resultant histograms of summed total intensities (see Materials and Methods for details), expressed as intensity per pixel, are seen in G. An ∼90% knockdown of myosin II immunofluorescence after 96-h exposure to the corresponding antisense oligonucleotide led also to attenuation of paxillin-phospho-Tyr118 immunofluorescence by 57% (myosin IIA antisense) and 68% (myosin IIC antisense), but this did not occur after myosin IIB antisense treatment. Although the error bars shown, generated automatically by our statistical software, are indicative, the intensity data were found not to be normally distributed; consequently, a Wilcoxon signed rank test was used to assess significance, as follows. Pairings displaying significant difference: myosin IIA (sense vs. myosin IIA antisense) W(z) = 2.86, n = 30, p = 0.0042 (2-tailed); myosin IIB (sense vs. myosin IIB antisense) W(z) = 2.37, n = 30, p = 0.0178 (2-tailed); myosin IIC (sense vs. myosin IIC antisense) W(z) = 3.77, n = 30, p = 0.002 (2-tailed); paxillin-phospho-Tyr118 (sense vs. myosin IIA antisense) W(z) = 3.25, n = 30, p = 0.0012 (2-tailed); and paxillin-phospho-Tyr118 (sense vs. myosin IIC antisense) W(z) = 2.93, n = 30, p = 0.0034 (2-tailed). Pairings displaying no significant difference: paxillin-phospho-Tyr118 (sense vs. myosin IIB antisense) W(z) = 0.83, n = 30, p = 0.41 (2-tailed); F-actin (sense vs. myosin IIA antisense) W(z) = 1.14, n = 30, p = 0.254 (2-tailed); F-actin (sense vs. myosin IIB antisense) W(z) = 0.68, n = 30, p = 0.497 (2-tailed); and F-actin (sense vs. myosin IIC antisense) W(z) = 0.03, n = 30, p = 0.976 (2-tailed).
Neurite Retraction
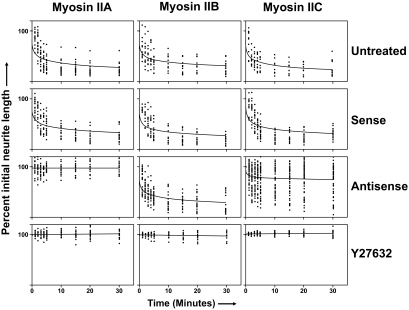
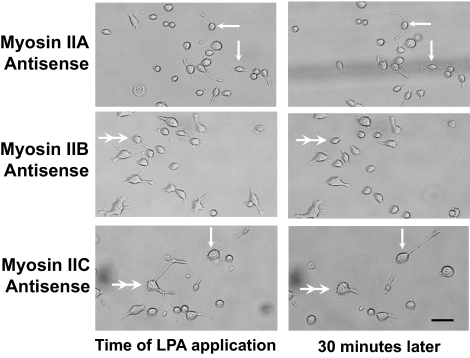
We used LPA to induce rapid retraction of neuritic processes. Application of oligonucleotides 48 h in advance of LPA addition allowed the effect of myosin isoform knockdown on neurite retraction to be assessed. Untreated control cells from each knockdown series exhibited dramatic neurite retraction (collapse) upon addition of LPA, processes withdrawing to ∼30% of the initial length within 30 min (Figure 11, untreated). Some 50% of this retraction occurred within 5 min of LPA application. Similar results were observed if LPA was added after cells had been preincubated for 48 h with sense oligonucleotides corresponding to myosins IIA, IIB, or IIC (Figure 11, sense). However, if LPA was applied after a 48-h treatment with antisense oligonucleotides, the cellular response was strikingly dependent upon the target isoform. Myosin IIA antisense oligonucleotides eliminated retraction, whereas myosin IIB antisense had little effect (Figures 11, antisense, and 12); both sets of results with redesigned oligonucleotides were similar to those obtained previously (Wylie and Chantler, 2003). Although results from oligonucleotides targeting myosins IIA and IIB were clearcut, the outcomes of experiments using myosin IIC antisense oligonucleotides were equivocal. Combined data obtained from 50 cells treated with LPA are shown (Figure 11, myosin IIC antisense) to illustrate the range of observations; in some cases, myosin IIC antisense had little suppressive effect on neurite retraction, whereas in others it seemed to be just as effective as myosin IIA. Such raw normalized data plots (Figure 11, antisense) can be displayed in the form of individual time courses; when this is done (Supplemental Figure S1), the data set is seen to be composed roughly of three components: cells responding to myosin IIC antisense through retraction, those minimally responsive to the stimulus, and those responding by direction reversal or slow extension. In favorable cases, divergent results could sometimes be observed between adjacent cells on the same slide (Figure 12). In all cases, the Rho-kinase inhibitor Y27632 overrode the effect of LPA on neurite retraction (Figure 11, Y27632).
Figure 11.
Effect of oligonucleotides targeting myosins IIA, IIB, and IIC on LPA-induced neurite retraction. Neuro-2A cells were treated with a pulse of 1 μM LPA either alone (untreated) or preceded by 48-h incubation with either sense or antisense oligonucleotides targeting myosin IIA, myosin IIB, or myosin IIC sequence. In a fourth treatment set, 25 μM Y27632 was added 30 min before addition of LPA. Over a 30-min period, subsequent to addition of LPA, DIC images were taken of the same set of cells at various intervals (1, 2, 3, 4, 5, 10, 15, 20, and 30 min), allowing quantification of neurite lengths for up to 50 cells from any one treatment.
Figure 12.
Visualization of the effect of antisense oligonucleotides targeting myosins IIA, IIB, and IIC subsequent to LPA-induced neurite retraction. Neuro-2A cells were treated with a pulse of 1 μM LPA subsequent to 48-h incubation with antisense oligonucleotides targeting myosin IIA, myosin IIB, or myosin IIC sequence. DIC images were obtained at the time of LPA application (LHS) or 30 min later (RHS). Arrows indicate examples of cells with processes that do not seem to have changed in length during the 30-min period. Double arrowheads indicate examples of cells with processes that have undergone a considerable decrease in length during the 30-min period. Examples of each extreme exist side by side following when cells are preincubated with antisense targeting myosin IIC. Bar, 50 μm.
DISCUSSION
Data mining of human and mouse genome sequences recently uncovered the presence of a new conventional motor, “myosin IIC,” of unknown function that is widely distributed within many cell types, including neurons (Buxton et al., 2004; Golomb et al., 2004). Here, we have characterized, for the first time, the functional roles of myosin IIC with respect to neuronal phenotype, adhesion, outgrowth, and retraction, by using an antisense knockdown approach and compare these results to those obtained with myosins IIA and IIB, by using newly designed oligonucleotides for the latter.
The normal distribution of myosin IIC in Neuro-2A cells relative to the F-actin cytoskeleton indicates that myosin IIC is dispersed throughout the cytoplasm, in contrast to the pronounced peripheral localization of F-actin found within the cell cortex, in associated microspikes and within discrete actin punta close to the subtratum (Figure 1 and Supplemental Material, confocal stacks 1–3). Although one might expect one or more of the three myosin isoforms (IIA, IIB, and IIC) to localize to this actin arrangement, each maintains a characteristic organization that is often distinct from this pattern. The three isoforms demonstrate considerable overlap albeit with subtle differences; confocal slices show that all three isoforms fill the entire cytoplasmic space of the cell with no obvious gaps in their distribution. Within this spatial integration, myosin IIC has the more punctate immunofluorescence yet myosin IIC puncta do not colocalize with either of the other two myosin isoforms nor, in general, with actin microfilaments (Confocal stacks 1–3), although some colocalization with actin puncta can be seen in growing processes when observed at high magnification (Supplemental Material, confocal stack 4).
Isoform-specific antisense knockdown of myosin IIC brought about attenuation of myosin IIC expression (Figures 2B and 4) and led to the suppression of neurite outgrowth (Figures 3–5). Other phenotypic changes ensued, including increased vacuolation (Figure 6) and enlarged cell body diameter (Figure 7) compared with untreated (Figure 1) and control (Figures 2–5) cells. Despite some flattening of the cell body accompanied by spreading, the locations of the remaining two myosin isoforms remained substantially unchanged (Supplementary Material, confocal stacks 5–7). All antisense-induced effects on neurite outgrowth were reversible (Figures 3 and 4A). The effects of targeted knock-down of either myosin IIC or myosin IIB on neurite outgrowth were similar (Figure 3), although restoration of outgrowth, after removal of the former, was somewhat retarded. Delayed application of antisense oligonucleotides led to slow retraction of preformed neurites (Figure 5) as observed previously (Wylie and Chantler, 2003), although the effect brought about by myosin IIC antisense was somewhat slower than that observed for a similar treatment with myosin IIB oligonucleotides.
Exposure of Neuro-2A cells to myosin IIC antisense oligonucleotides led to a dramatic enhancement of cell detachment (∼40% at 96 h), which was more pronounced than that seen when myosin IIA was selectively removed (∼20% at 96 h) (Figure 9). It is possible that the ensuing 30% increase in cell body area (Figure 7) upon exposure to myosin IIC antisense oligonucleotides and increased vacuolation (Figure 6), are contributory events to detachment. However, it may be noted that detachment is well underway by 72-h exposure (Figure 9), whereas vacuolization does not become apparent until 96 h.
Using an antibody specific for paxillin-phospho-Tyr118, we were able to further refine the role played by myosin IIC in cell adhesion (Figure 10). Previously, we found that myosin IIA knockdown led to a substantial decline in overall paxillin immunofluorescence after isoform-specific knockdown of myosin IIA (Wylie and Chantler, 2001). Extending these results to correlate with the active phosphorylated form of paxillin, we find that although antisense knockdown of myosin IIB (Figure 10, D and G) had no effect on paxillin-phospho-Tyr118 immunofluorescence, knockdown of either myosin IIA (Figure 10, B and G) or myosin IIC (Figure 10, F and G) led to a corresponding decrease in paxillin-phospho-Tyr118 immunofluorescence. Given that the presence of phosphoTyr118 paxillin, an integrin assembly adaptor protein, is a functional correlate of adhesion (Bellis et al., 1997; Nakamura et al., 2000; Tsubouchi et al., 2002), these data reinforce our conclusions that both myosin IIA and myosin IIC are required for adhesion and may require their involvement in recruitment of component parts for focal contact assembly.
Myosin IIA antisense oligonucleotides had no effect on the relative number of neuritic processes arising from the cell body, reinforcing our earlier view (Wylie et al., 1998; Wylie and Chantler, 2001) (Figure 8A). By contrast, antisense knockdown of either myosin IIB or IIC led to a drop in the average number of neurites produced per cell (Figure 8, B and C). Myosin IIC knockdown appeared not to affect neurite number in cells with three or more neuritic processes but suppressed the number of cells exhibiting one or two processes, in direct contrast to knockdown of myosins IIA or IIB (Figure 8C).
The requirement of myosin IIA for LPA-induced neurite retraction, and the substantial independence of this process from myosin IIB action (Wylie and Chantler, 2003), was confirmed using our redesigned oligonucleotides (Figure 11). However, results observed with oligonucleotides directed against myosin IIC were ambiguous. Although control responses were comparable for all these isoforms, the outcome of IIC antisense treatments varied conspicuously from cell to cell (Figures 11 and 12). At the extremes, myosin IIC antisense oligonucleotides either suppressed retraction as much as myosin IIA oligonucleotides or had no effect, facilitating LPA-induced collapse. Such extremes could be identified by examining the individual time courses of cell treatments that make up the myosin IIC data set shown in Figure 11 (see Supplementary Figure S1) and on occasion were easily visible, as in Figure 12, where a Neuro-2A cell exhibiting complete collapse subsequent to myosin IIC antisense oligonucleotide treatment is adjacent to one in which LPA-induced collapse has been prevented. Clearly, other factors must be required that selectively determine the susceptibility of each neuron to neurite collapse after myosin IIC knockdown. In all instances, LPA-induced neurite retraction could be suppressed by the presence of the Rho-kinase inhibitor Y27632 (Figure 11).
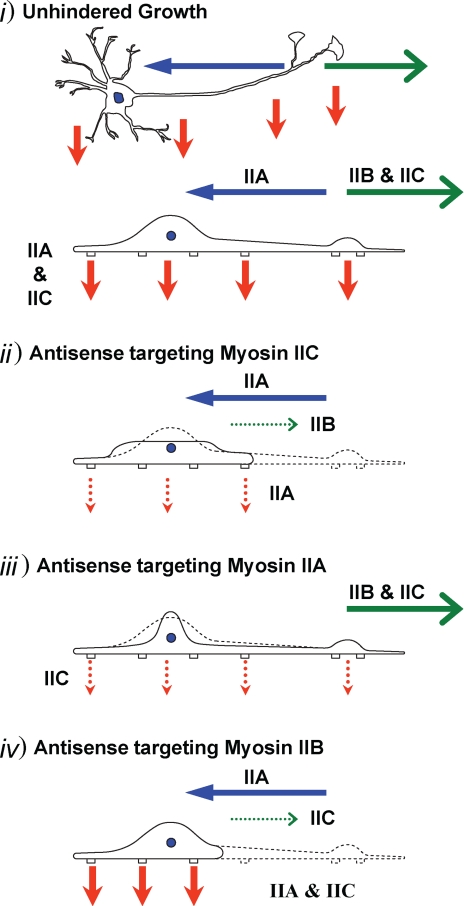
Previously, we proposed a mechanism (Chantler and Wylie, 2003) to explain neuronal process dynamics based on the actions of the two molecular motors known to be involved at that time, namely, myosins IIA and IIB. As with all three-body problems, incorporation of a third component to any conceptual mechanism increases, rather than resolves, the level of complexity. Myosin IIC is unique because it shares some features with myosin IIB (neurite outgrowth) (Figures 3–5) and some with myosin IIA (modulation of adhesion) (Figure 9); in addition, there are some features that seem distinct from either isoform, such as its indeterminate role in neurite retraction (Figures 11 and 12) and a possible role in cell spreading (Figure 7). A cartoon depicting the separate roles we propose for the three conventional myosin isoforms in neuronal cells and the consequences elicited by specific isoform knockdown, is seen in Figure 13. Although myosin IIB and myosin IIC are both important drivers of neurite outgrowth, it is unlikely that they act in identical ways given the diffuse, punctate subcellular distribution of myosin IIC in comparison with myosin IIB. Furthermore, myosin IIC can modulate adhesion (Figures 9 and 10). This combined effect of myosin IIC knockdown on both outgrowth and adhesion is well suited to the properties of the elusive conventional motor powering retrograde actin flow (Lin et al., 1996; Medeiros et al., 2006), there being an inverse relationship between myosin activation and process outgrowth (Lin and Forscher, 1995; Lin et al., 1996; Betapudi et al., 2006; Cai et al., 2006).
Figure 13.
Cartoon illustrating the separate roles of the three conventional myosin isoforms in neuronal dynamics, and the consequences of isoform-specific knockdown. In all diagrams, green arrows indicate process outgrowth, blue arrows indicate process retraction, and red arrows illustrate adhesion at cellular “feet.” Bold, solid arrows indicate normal action; thin, dotted arrows indicate diminished action through the loss of either myosin IIC (ii), myosin IIA (iii), or myosin IIB (iv). i, unhindered growth. A neuron with associated dendrites and a single main process terminating in a branch-point with two growth cones is drawn as seen from above (top cartoon) and in profile (bottom cartoon). The actions of myosins IIA, IIB, and IIC are indicated. ii, antisense targeting myosin IIC. The effect of myosin IIC knockdown is illustrated here. Continuous cell profile shows the consequence of myosin IIC knockdown; myosins IIA and IIB remain active and their roles are indicated. Normal cell profile, as seen in i, is illustrated in dotted outline. iii, antisense targeting myosin IIA. The effect of myosin IIA knockdown is illustrated here. Continuous cell profile shows the consequence of myosin IIA knockdown; myosins IIB and IIC remain active and their roles are indicated. Normal cell profile, as seen in i, is illustrated in dotted outline. iv, antisense targeting myosin IIB. The effect of myosin IIB knockdown is illustrated here. Continuous cell profile shows the consequence of myosin IIB knockdown; myosins IIA and IIC remain active and their roles are indicated. Normal cell profile, as seen in i, is illustrated in dotted outline.
It is likely that myosin II isoforms can take on differing roles in different cell types. In endothelial cells, for example, there is a differential distribution whereby myosin IIA takes up an anterior position and myosin IIB is located in the posterior aspect of the cell (Kolega, 2003) during wound healing. It may be that the rear end of an endothelial cell is analogous to the central domain of a neuronal growth cone. Indeed, the greater processivity and longer cycle time of myosin IIB (Rosenfeld et al., 2003; Wang et al., 2003) relative to either myosin IIA (Kovács et al., 2003) or myosin IIC (Kim et al., 2005) make it an ideal motor for force generation within the relatively dense actin networks present at these different locations. The distinctive kinetic parameters of myosins IIA, IIB, and IIC are indicative of discrete functions for these motors (Kim et al., 2005) and their actions will, in turn, depend on cell type, cytoplasmic location, and surrounding cytoarchitecture. Myosin isoforms in different cell types may also be differently targeted by Rac and Rho. In migrating endothelial cells, myosin IIB is under Rho control and pulls the rear of the cell forward (Kolega, 2003) whereas in the neuronal growth cone, myosin IIA-driven retraction is under Rho control (Wylie and Chantler, 2003). Given the ability of myosin IIC to participate in overlapping functions with myosin IIA and myosin IIB, it will be of considerable interest to establish the upstream control pathways regulating myosin IIC activity. Our present observations suggest a unique multi-tasking role for myosin IIC in neuronal cells.
Supplementary Material
ACKNOWLEDGMENTS
We gratefully acknowledge receipt of antibodies targeting myosin IIC from Dr. Bob Adelstein. We thank Drs. Kim Jonas and Rob Fowkes for assistance with the immunoblots, Helen Smith for advice on confocal microscopy, Brian Cox for assistance with figure preparation, Jack Sisterson for converting our confocal stacks into Quicktime movies, and Professor Walter Gratzer and Dr. Imelda McGonnell for improving earlier drafts of this manuscript. This work was supported by a project grant from the Biotechnology and Biological Sciences Research Council and an instrumentation grant from the Wellcome Trust (to P.D.C.).
Footnotes
This article was published online ahead of print in MBC in Press (http://www.molbiolcell.org/cgi/doi/10.1091/mbc.E07-08-0744) on July 9, 2008.
REFERENCES
- Amano M., Chihara K., Nakamura N., Fukata Y., Yano T., Shibata M., Ikebe M., Kaibuchi K. Myosin II activation promotes neurite retraction during the action of Rho and Rho-kinase. Genes Cells. 1998;3:177–188. doi: 10.1046/j.1365-2443.1998.00181.x. [DOI] [PubMed] [Google Scholar]
- Bao J., Jana S. S., Adelstein R. S. Vertebrate nonmuscle myosin II isoforms rescue siRNA-induced defects in COS-7 cell cytokinesis. J. Biol. Chem. 2005;280:19594–19599. doi: 10.1074/jbc.M501573200. [DOI] [PubMed] [Google Scholar]
- Bellis S. L., Miller J. T., Turner C. E. Characterization of tyrosine phosphorylation of paxillin in vitro by focal adhesion kinase. J. Biol. Chem. 1995;270:17437–17441. doi: 10.1074/jbc.270.29.17437. [DOI] [PubMed] [Google Scholar]
- Bellis S. L., Perrotta J. A., Curtis M. S., Turner C. E. Adhesion of fibroblasts to fibronectin stimulates both serine and tyrosine phosphorylation of paxillin. Biochem. J. 1997;325:375–381. doi: 10.1042/bj3250375. [DOI] [PMC free article] [PubMed] [Google Scholar]
- Betapudi V., Licate L. S., Egelhoff T. T. Distinct roles of nonmuscle myosin II isoforms in the regulation of MDA-MB-231 breast cancer cell spreading and migration. Cancer Res. 2006;66:4725–4733. doi: 10.1158/0008-5472.CAN-05-4236. [DOI] [PubMed] [Google Scholar]
- Bialik S., Bresnick A. R., Kimchi A. DAP-kinase-mediated morphological changes are localization dependent and involve myosin II phosphorylation. Cell Death Differ. 2004;6:631–644. doi: 10.1038/sj.cdd.4401386. [DOI] [PubMed] [Google Scholar]
- Bridgman P. C., Dave S., Asnes C. F., Tullio A. N., Adelstein R. S. Myosin IIB is required for growth cone motility. J. Neurosci. 2001;21:6159–6169. doi: 10.1523/JNEUROSCI.21-16-06159.2001. [DOI] [PMC free article] [PubMed] [Google Scholar]
- Buxton D. B., Golomb E., Adelstein R. S. Induction of nonmuscle myosin heavy chain IIC by butyrate in RAW 264.7 mouse macrophages. J. Biol. Chem. 2004;279:15449–15455. doi: 10.1074/jbc.M210145200. [DOI] [PubMed] [Google Scholar]
- Cai Y., et al. Nonmuscle myosin IIA-dependent force inhibits cell spreading and drives F-actin flow. Biophys. J. 2006;15:3907–3920. doi: 10.1529/biophysj.106.084806. [DOI] [PMC free article] [PubMed] [Google Scholar]
- Chantler P. D., Wylie S. R. Elucidation of the separate roles of myosins IIA and IIB during neurite outgrowth, adhesion and retraction. IEE Proc. Nanobiotechnol. 2003;150:111–125. doi: 10.1049/ip-nbt:20031076. [DOI] [PubMed] [Google Scholar]
- Chomczynski P., Sacchi N. Single-step method of RNA isolation by acid guanidinium thiocyanate-phenol-chloroform extraction. Anal. Biochem. 1987;162:156–159. doi: 10.1006/abio.1987.9999. [DOI] [PubMed] [Google Scholar]
- Chrzanowska-Wodnicka M., Burridge K. Rho-stimulated contractility drives the formation of stress fibers and focal adhesions. J. Cell Biol. 1996;133:1403–1415. doi: 10.1083/jcb.133.6.1403. [DOI] [PMC free article] [PubMed] [Google Scholar]
- Clark K., Langeslag M., Figdor C. G., van Leeuwen F. N. Myosin II and mechanotransduction: a balancing act. Trends Cell Biol. 2007;17:178–186. doi: 10.1016/j.tcb.2007.02.002. [DOI] [PubMed] [Google Scholar]
- Conti M. A., Even-Ram S., Liu C., Yamada K. M., Adelstein R. S. Defects in cell adhesion and the visceral endoderm following ablation of nonmuscle myosin heavy chain II-A in mice. J. Biol. Chem. 2004;279:41263–41266. doi: 10.1074/jbc.C400352200. [DOI] [PubMed] [Google Scholar]
- Cramer L. P., Mitchison T. J. Myosin is involved in postmitotic cell spreading. J. Cell Biol. 1995;131:179–189. doi: 10.1083/jcb.131.1.179. [DOI] [PMC free article] [PubMed] [Google Scholar]
- D'Apolito M., Guarnieri V., Boncristiano M., Zelante L., Savoia A. Cloning of the murine non-muscle myosin heavy chain IIA gene ortholog of human MYH9 responsible for May-Hegglin, Sebastian, Fechtner, and Epstein syndromes. Gene. 2002;286:215–222. doi: 10.1016/s0378-1119(02)00455-9. [DOI] [PubMed] [Google Scholar]
- DeBiasio R., LaRocca , Post G. M., P. L., Taylor D. L. Myosin II transport, organization, and phosphorylation: evidence for cortical flow/solation-contraction coupling during cytokinesis and cell locomotion. Mol. Biol. Cell. 1996;7:1259–1282. doi: 10.1091/mbc.7.8.1259. [DOI] [PMC free article] [PubMed] [Google Scholar]
- De Lozanne A., Spudich J. A. Disruption of the Dictyostelium myosin heavy chain gene by homologous recombination. Science. 1987;236:1086–1091. doi: 10.1126/science.3576222. [DOI] [PubMed] [Google Scholar]
- Donaudy F., et al. Nonmuscle myosin heavy-chain gene MYH14 is expressed in cochlea and mutated in patients affected by autosomal dominant hearing impairment (DFNA4) Am. J. Hum. Genet. 2004;74:770–776. doi: 10.1086/383285. [DOI] [PMC free article] [PubMed] [Google Scholar]
- Eddy R. L., Pierini L. M., Matsumura F., Maxfield F. R. Ca2+-dependent myosin II activation is required for uropod retraction during neutrophil migration. J. Cell Sci. 2000;113:1287–1298. doi: 10.1242/jcs.113.7.1287. [DOI] [PubMed] [Google Scholar]
- Even-Ram S., Doyle A. D., Conti M. A., Matsumoto K., Adelstein R. S., Yamada K. M. Myosin IIA regulates cell motility and actomyosin-microtubule crosstalk. Nat. Cell Biol. 2007;9:299–309. doi: 10.1038/ncb1540. [DOI] [PubMed] [Google Scholar]
- Ferreira A., Niclas J., Vale R. D., Banker G., Kosik K. S. Suppression of kinesin expression in cultured hippocampal neurons using antisense oligonucleotides. J. Cell Biol. 1992;117:595–606. doi: 10.1083/jcb.117.3.595. [DOI] [PMC free article] [PubMed] [Google Scholar]
- Foth B. J., Goedecke M. C., Soldati D. New insights into myosin evolution and classification. Proc. Natl. Acad. Sci. USA. 2007;103:3681–3686. doi: 10.1073/pnas.0506307103. [DOI] [PMC free article] [PubMed] [Google Scholar]
- Giannone G., et al. Lamellipodial actin mechanically links myosin activity with adhesion-site formation. Cell. 2007;128:561–575. doi: 10.1016/j.cell.2006.12.039. [DOI] [PMC free article] [PubMed] [Google Scholar]
- Gillespie G. Y., Soroceanu L., Manning T. J., Gladson C. L., Rosenfeld S. S. Glioma migration can be blocked by nontoxic inhibitors of myosin II. Cancer Res. 1999;59:2076–2082. [PubMed] [Google Scholar]
- Golomb E., Ma X., Jana S. S., Preston Y. A., Kawamoto S., Shoham N. G., Goldin E., Conti M. A., Sellers J. R., Adelstein R. S. Identification and characterization of nonmuscle myosin II-C, a new member of the myosin II family. J. Biol. Chem. 2004;279:2800–2808. doi: 10.1074/jbc.M309981200. [DOI] [PubMed] [Google Scholar]
- Huang H., Paliouras M., Rambaldi I., Lasko P., Featherstone M. Nonmuscle myosin promotes cytoplasmic localization of PBX. Mol. Cell Biol. 2003;23:3636–3645. doi: 10.1128/MCB.23.10.3636-3645.2003. [DOI] [PMC free article] [PubMed] [Google Scholar]
- Itoh K., Adelstein R. S. Neuronal cell expression of inserted isoforms of vertebrate nonmuscle myosin heavy chain II-B. J. Biol. Chem. 1995;270:14533–14540. doi: 10.1074/jbc.270.24.14533. [DOI] [PubMed] [Google Scholar]
- Jana S. S., Kawamoto S., Adelstein R. S. A specific isoform of nonmuscle myosin IIC is required for cytokinesis in a tumor cell line. J. Biol. Chem. 2006;281:24662–24670. doi: 10.1074/jbc.M604606200. [DOI] [PubMed] [Google Scholar]
- Katsuragawa Y., Yanagisawa Y., Inoue A., Masaki T. Two distinct nonmuscle myosin heavy chain mRNAs are differentially expressed in various chicken tissues. Eur. J. Biochem. 1989;184:611–616. doi: 10.1111/j.1432-1033.1989.tb15057.x. [DOI] [PubMed] [Google Scholar]
- Kawamoto S., Adelstein R. S. Chicken nonmuscle myosin heavy chains: differential expression of two mRNAs and evidence for two different polypeptides. J. Cell Biol. 1991;112:915–924. doi: 10.1083/jcb.112.5.915. [DOI] [PMC free article] [PubMed] [Google Scholar]
- Kim K.-Y., Kovacs M., Kawamoto S., Sellers J. R., Adelstein R. S. Disease-associated mutations and alternative splicing alter the enzymatic and motile activity of nonmuscle myosins IIB and IIC. J. Biol. Chem. 2005;280:22769–22775. doi: 10.1074/jbc.M503488200. [DOI] [PubMed] [Google Scholar]
- Kolega J. Asymmetric distribution of myosin IIB in migrating endothelial cells is regulated by a rho-dependent kinase and contributes to tail retraction. Mol. Biol. Cell. 2003;14:4745–4757. doi: 10.1091/mbc.E03-04-0205. [DOI] [PMC free article] [PubMed] [Google Scholar]
- Kovács M., Wang F., Hu A., Zhang Y., Sellers J. R. Functional divergence of human cytoplasmic myosin II: kinetic characterization of the non-muscle IIA isoform. J. Biol. Chem. 2003;278:38132–38140. doi: 10.1074/jbc.M305453200. [DOI] [PubMed] [Google Scholar]
- Kuczmarski E., Rosenbaum J. L. Studies on the organization and localization of myosin in neurons. J. Cell Biol. 1978;80:356–371. doi: 10.1083/jcb.80.2.356. [DOI] [PMC free article] [PubMed] [Google Scholar]
- Letourneau P. C. Immunocytochemical evidence for colocalization in neurite growth cones of actin and myosin and their relationship to cell-substratum adhesions. Dev. Biol. 1981;85:113–122. doi: 10.1016/0012-1606(81)90240-2. [DOI] [PubMed] [Google Scholar]
- Lin C.-H., Forscher P. Growth cone advance is inversely proportional to retrograde actin flow. Neuron. 1995;14:763–771. doi: 10.1016/0896-6273(95)90220-1. [DOI] [PubMed] [Google Scholar]
- Lin C.-H., Espreafico E. M., Mooseker M. S., Forscher P. Myosin drives retrograde F-actin flow in neuronal growth cones. Neuron. 1996;16:769–782. doi: 10.1016/s0896-6273(00)80097-5. [DOI] [PubMed] [Google Scholar]
- Lo C.-M., Buxton D. B., Chua G. C., Dembo M., Adelstein R. S., Wang Y. L. Nonmuscle myosin IIB is involved in the guidance of fibroblast migration. Mol. Biol. Cell. 2004;15:982–989. doi: 10.1091/mbc.E03-06-0359. [DOI] [PMC free article] [PubMed] [Google Scholar]
- Ma X., Kawamoto S., Hara Y., Adelstein R. S. A point mutation in the motor domain of nonmuscle myosin IIB impairs migration of distinct groups of neurons. Mol. Biol. Cell. 2004;15:2568–2579. doi: 10.1091/mbc.E03-11-0836. [DOI] [PMC free article] [PubMed] [Google Scholar]
- Ma X., Kawamoto S., Uribe J., Adelstein R. S. Function of the neuron-specific alternatively spliced isoforms of nonmuscle myosin IIB during mouse brain development. Mol. Biol. Cell. 2006;17:2138–2149. doi: 10.1091/mbc.E05-10-0997. [DOI] [PMC free article] [PubMed] [Google Scholar]
- Ma X., Bao J., Adelstein R. S. Loss of cell adhesion causes hydrocephalus in nonmuscle myosin II-B ablated and mutated mice. Mol. Biol. Cell. 2007;18:2305–2312. doi: 10.1091/mbc.E07-01-0073. [DOI] [PMC free article] [PubMed] [Google Scholar]
- Medeiros N. A., Burnette D. T., Forscher P. Myosin II functions in actin-bundle turnover in neuronal growth cones. Nat. Cell Biol. 2006;8:215–226. doi: 10.1038/ncb1367. [DOI] [PubMed] [Google Scholar]
- Miller M., Bower E., Levitt P., Li D., Chantler P. D. Myosin II distribution in neurons is consistent with a role in growth cone motility but not synaptic vesicle mobilization. Neuron. 1992;8:25–44. doi: 10.1016/0896-6273(92)90106-n. [DOI] [PubMed] [Google Scholar]
- Murakami N., Elzinga M. Immunohistochemical studies on the distribution of cellular myosin II isoforms in brain and aorta. Cell Motil. Cytoskeleton. 1992;22:281–295. doi: 10.1002/cm.970220408. [DOI] [PubMed] [Google Scholar]
- Murakami N., Trenkner E., Elzinga M. Changes in expression of nonmuscle myosin heavy chain isoforms during muscle and nonmuscle tissue development. Dev. Biol. 1993;157:19–27. doi: 10.1006/dbio.1993.1108. [DOI] [PubMed] [Google Scholar]
- Nakamura K., Yano H., Uchida H., Hashimoto S., Schaefer E., Sabe H. Tyrosine phosphorylation of paxillin alpha is involved in temporospatial regulation of paxillin-containing focal adhesion formation and F-actin organization in motile cells. J. Biol. Chem. 2000;275:27155–27164. doi: 10.1074/jbc.M000679200. [DOI] [PubMed] [Google Scholar]
- Parsons-Wingerter P., et al. Uniform overexpression and rapid accessibility of α5β1 integrin on blood vessels in tumors. Am. J. Pathol. 2005;167:193–211. doi: 10.1016/s0002-9440(10)62965-3. [DOI] [PMC free article] [PubMed] [Google Scholar]
- Rochlin M. W., Itoh K., Adelstein R. S., Bridgman P. C. Localization of myosin IIA and IIB isoforms in cultured neurons. J. Cell Sci. 1995;108:3661–3670. doi: 10.1242/jcs.108.12.3661. [DOI] [PubMed] [Google Scholar]
- Rosenfeld S. S., Xing J., Chen L. Q., Sweeney H. L. Myosin IIB is unconventionally conventional. J. Biol. Chem. 2003;278:27449–27455. doi: 10.1074/jbc.M302555200. [DOI] [PubMed] [Google Scholar]
- Rozen S., Skaletsky H. J. Primer3 on the WWW for general users and for biologist programmers. In: Krawetz S., Misener S., editors. Bioinformatics Methods and Protocols: Methods in Molecular Biology. Totowa, NJ: Humana Press; 2000. pp. 365–386. [DOI] [PubMed] [Google Scholar]
- Ryu J., Liu L., Wong T. P., Wu D. C., Burette A., Weinberg R., Wang Y. T., Sheng M. A critical role for myosin IIB in dendritic spine morphology and synaptic function. Neuron. 2006;49:175–182. doi: 10.1016/j.neuron.2005.12.017. [DOI] [PubMed] [Google Scholar]
- Sandquist J. C., Swenson K. I., Demali K. A., Burridge K., Means A. R. Rho kinase differentially regulates phosphorylation of nonmuscle myosin II isoforms A and B during cell rounding and migration. J. Biol. Chem. 2006;281:35873–35883. doi: 10.1074/jbc.M605343200. [DOI] [PubMed] [Google Scholar]
- Schmidt J. T., Morgan P., Dowell N., Leu B. Myosin light chain phosphorylation and growth cone motility. J. Neurobiol. 2002;52:175–188. doi: 10.1002/neu.10083. [DOI] [PubMed] [Google Scholar]
- Simerly C., Nowak G., de Lanerolle P., Schatten G. Differential expression and functions of cortical myosin IIA and IIB isotypes during meiotic maturation, fertilization and mitosis in mouse oocytes and embryos. Mol. Biol. Cell. 1998;9:2509–2525. doi: 10.1091/mbc.9.9.2509. [DOI] [PMC free article] [PubMed] [Google Scholar]
- Simons M., Wang M., McBride O., Kawamoto S., Gdula D., Adelstein R. S., Weir L. Human nonmuscle myosin heavy chains are encoded by two genes located on different chromosomes. Circ. Res. 1991;69:530–539. doi: 10.1161/01.res.69.2.530. [DOI] [PubMed] [Google Scholar]
- Svitkina T. M., Verkhovsky A. B., McQuade K. M., Borisy G. G. Analysis of the actin-myosin II system in fish epidermal keratocytes: mechanism of cell body translocation. J. Cell Biol. 1997;139:397–415. doi: 10.1083/jcb.139.2.397. [DOI] [PMC free article] [PubMed] [Google Scholar]
- Takeda K., Kishi H., Ma X., Yu Z.-X., Adelstein R. S. Ablation and mutation of nonmuscle myosin heavy chain II-B results in a defect in cardiac myocyte cytokinesis. Circulation Res. 2003;93:330–337. doi: 10.1161/01.RES.0000089256.00309.CB. [DOI] [PubMed] [Google Scholar]
- Togo T., Steinhardt R. A. Nonmuscle myosin IIA and IIB have distinct functions in the exocytosis-dependent process of cell membrane repair. Mol. Biol. Cell. 2004;15:688–695. doi: 10.1091/mbc.E03-06-0430. [DOI] [PMC free article] [PubMed] [Google Scholar]
- Towbin H., Staehelin T., Gordan J. Electrophoretic transfer of proteins from polyacrylamide gels to nitrocellulose sheets: procedure and some applications. Proc. Natl. Acad. Sci. USA. 1979;76:4350–4354. doi: 10.1073/pnas.76.9.4350. [DOI] [PMC free article] [PubMed] [Google Scholar]
- Tsubouchi A., Sakakura J., Yagi R., Mazaki Y., Schaefer E., Yano H., Sabe H. Localized suppression of RhoA activity by Tyr31/118-phosphorylated paxillin in cell adhesion and migration. J. Cell Biol. 2002;159:673–683. doi: 10.1083/jcb.200202117. [DOI] [PMC free article] [PubMed] [Google Scholar]
- Tullio A. N., Accili D., Ferrans V. J., Yu Z. X., Takeda K., Grinberg A., Westphal H., Preston Y. A., Adelstein R. S. Nonmuscle myosin II-B is required for normal development of the mouse heart. Proc. Natl. Acad. Sci. USA. 1997;94:12407–12412. doi: 10.1073/pnas.94.23.12407. [DOI] [PMC free article] [PubMed] [Google Scholar]
- Tullio A. N., Bridgman P. C., Tresser N. J., Chan C.-C., Conti M. A., Adelstein R. S., Hara Y. Structural abnormalities develop in the brain following ablation of the gene encoding nonmuscle myosin II-B heavy chain. J. Comp. Neurol. 2001;433:62–74. doi: 10.1002/cne.1125. [DOI] [PubMed] [Google Scholar]
- Turney S. G., Bridgman P. C. Laminin stimulates and guides axonal outgrowth via growth cone myosin II activity. Nat. Neurosci. 2005;8:717–719. doi: 10.1038/nn1466. [DOI] [PubMed] [Google Scholar]
- van Leeuwen F. N., van Delft S., Kain H. E., van der Kammen R. A., Collard J. G. Rac regulates phosphorylation of the myosin II heavy chain, actinomyosin disassembly and cell spreading. Nat. Cell Biol. 1999;1:242–248. doi: 10.1038/12068. [DOI] [PubMed] [Google Scholar]
- Vicente-Manzanares M., Zareno J., Whitmore L., Choi C. K., Horwitz A. F. Regulation of protrusion, adhesion dynamics, and polarity by myosins IIA and IIB in migrating cells. J. Cell Biol. 2007;176:573–580. doi: 10.1083/jcb.200612043. [DOI] [PMC free article] [PubMed] [Google Scholar]
- Wang F., Kovacs M., Hu A., Limouze J., Harvey E. V., Sellers J. R. Kinetic mechanism of non-muscle myosin IIB: functional adaptations for tension generation and maintenance. J. Biol. Chem. 2003;278:27439–27448. doi: 10.1074/jbc.M302510200. [DOI] [PubMed] [Google Scholar]
- Wylie S. R., Chantler P. D. Separate but linked functions of conventional myosins modulate adhesion and neurite outgrowth. Nat. Cell Biol. 2001;3:88–92. doi: 10.1038/35050613. [DOI] [PubMed] [Google Scholar]
- Wylie S. R., Chantler P. D. Myosin IIA drives neurite retraction. Mol. Biol. Cell. 2003;14:4654–4666. doi: 10.1091/mbc.E03-03-0187. [DOI] [PMC free article] [PubMed] [Google Scholar]
- Wylie S. R., Wu P.-J., Patel H., Chantler P. D. A conventional myosin motor drives neurite outgrowth. Proc. Natl. Acad. Sci. USA. 1998;95:12967–12972. doi: 10.1073/pnas.95.22.12967. [DOI] [PMC free article] [PubMed] [Google Scholar]
- Zang J.-H., Cavet G., Sabry J. H., Wagner P., Moores S. L., Spudich J. A. On the role of myosin II in cytokinesis: division of Dictyostelium cells under adhesive and nonadhesive conditions. Mol. Biol. Cell. 1997;8:2617–2629. doi: 10.1091/mbc.8.12.2617. [DOI] [PMC free article] [PubMed] [Google Scholar]
Associated Data
This section collects any data citations, data availability statements, or supplementary materials included in this article.


