
Figure 3.
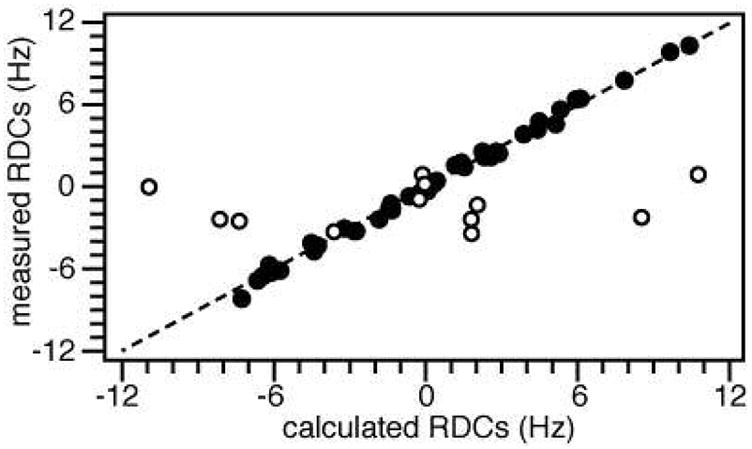
Correlation between HN RDCs measured experimentally and HN RDCs back-calculated from the refined structure of FXYD1. The RDCs from the flexible linker and termini (white circles) correlate poorly with those from the helical region of the protein (black circles; RMSD = 0.31; R factor = 0.07).