Abstract
We report the lateral diffusion properties of 2,2′-di-O-decyl-3,3′-di-O-(eicosanyl)-bis-(rac-glycero)-1,1′-diphosphocholine (C20BAS) using pulsed-field gradient NMR (PFG-NMR) and fluorescence recovery after photobleaching (FRAP). C20BAS membranes display a melting transition at Tm = 15.7 °C as determined by differential scanning calorimetry and 31P NMR chemical shift anisotropy. The lateral diffusion coefficient of C20BAS, as determined by PFG-NMR and FRAP, at 25 °C, were DPFG-NMR = 1.9 ± 0.6 × 10⁻⁸ cm2/s and DFRAP C20BAS = 1.2 ± 0.1 × 10⁻⁸ cm2/s, respectively. In comparison, the lateral diffusion coefficient of the monopolar phospholipid, 1-palmitoyl-2-oleoyl-sn-glycero-3-phosphocholine (POPC), was 1.8 ± 0.9 × 10⁻⁸ and 2.5 ± 0.9 × 10⁻⁸ cm2/s using PFG-NMR and FRAP, respectively.
INTRODUCTION
Archae are a family of single cell organisms that are widely distributed, occurring in environments as diverse as oceanic thermal vents, caldera, and cold pelagic waters [1–5]. Phylogenetic classification of these organisms is based on their 16S ribosomal RNA sequence, which is distinctly different from those of prokaryotes and eukaryotes [6]. Archae also possess unique membrane lipids based on membrane-spanning polyisoprenoid chains that join two glyceryl headgroups into bipolar acyclic and macrocyclic structures (a.k.a. bolaamphiphiles or bolalipids) [7,8]. The unusual physical and chemical stability of these lipids is attributed to their resistance toward hydrolysis as a result of their chemically robust ether linkage. Slow efflux of hydrophilic materials across synthetic- and naturally-occurring variants of these lipids, attributed to the presence of membrane spanning alkyl chains, has also been reported [9–14]. These unique features have stimulated their use in vaccine and drug delivery systems [5], in supported membrane devices [13,15,16], as design elements for coupled electron/ion transport across vesicle membranes [17,18], as paleobiological markers (i.e., molecular fossils) [19,20], and a host of other applications [21].
Naturally-occurring bolalipids have been characterized with respect to their membrane permeability [10], capacitance [22], and lateral diffusion/correlation times [23–26], however, there are very few systematic studies of the influence of lipid structure on membrane function in synthetic bolalipid systems [9–11]. Studies of this type are of particular interest since they may reveal the underlying structural features that are most important for the formation of stable and fluid bolalipid membranes for supported membrane sensor applications. A long-term goal of our research is the elucidation of structure-property relationships in bolalipid membranes to enable the correlation of bolalipid membrane dynamics with their physical stability and permeability.
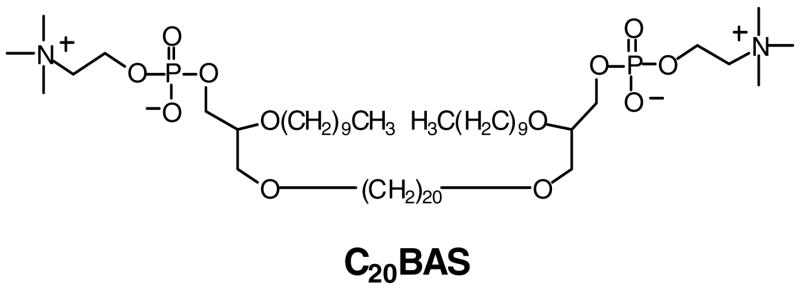
This paper reports the lateral diffusion coefficients (D) of a synthetic bolalipid using two techniques, pulsed-field gradient NMR (PFG-NMR) and fluorescence recovery after photobleaching (FRAP). PFG-NMR is a label-free method that enables diffusion coefficient measurements of lipids in multilamellar vesicles in bulk solution or as oriented, planar supported membranes on solid supports. Diffusion coefficients determined by PFG-NMR and FRAP of 2,2′-di-O-decyl-3,3′-di-O-(eicosanyl)-bis-(rac-glycero)-1,1′-diphosphocholine (C20BAS, Figure 1) were compared with D values measured for a well-known monopolar lipid standard, 1-palmitoyl-2-oleoyl-sn-glycero-3-phosphocholine (POPC), to enable direct comparisons with literature precedent. The bipolar pulse pair longitudinal eddy current delay sequence (BPPS-LED) [27], a method that stores the magnetization along the z-axis during the pulse sequence, was applied to generate spectra that produced lateral diffusion coefficients similar to those reported for solid state NMR measurements. We observed that the lateral diffusion coefficients of bolalipid C20BAS measured using FRAP were comparable to those determined by PFG-NMR and were similar to the D values of the monopolar lipid, POPC.
Figure 1.
Structure of the synthetic bolalipid, 2,2′-di-O-decyl-3,3′-di-O-(eicosanyl)-bis-(rac-glycero)-1,1′-diphosphocholine (C20BAS).
MATERIALS AND METHODS
Materials
C20BAS was synthesized as described elsewhere [28–30]. POPC was purchased from Avanti Polar Lipids (Alabaster, AL). Deuterium oxide (D2O, 99.9%) was obtained from Cambridge Isotope Laboratories, Inc. (Andover, MA). HPLC grade chloroform (CHCl3) and methanol (MeOH) were supplied by Mallinckrodt-Baker (Paris, KY). 1-Oleoyl-2-[6-[(7-nitro-2-1,3-benzoxadiazol-4-yl)amino]hexanoyl]-sn-glycero-3-phosphocholine (NBD-OPPC) was obtained from Avanti Polar Lipids (Alabaster, AL). All other materials were purchased from Aldrich (Milwaukee, WI).
Vesicle Preparation for PFG-NMR Experiments
C20BAS powder (8.6 mg, 8 μmol) was dissolved in CHCl3:MeOH in a cryovial and a thin film formed by evaporating the solvent under a gentle stream of Ar gas. The solvent was further removed under a 100 μm Hg vacuum for at least 2 h. After addition of 1 mL D2O, the solution was subjected to five cycles of freeze (liquid N2 bath), thaw (water bath at 65°C for 5 min), and vortex (30 s) to give a polydisperse multilamellar vesicle (MLV) suspension as described by DiMeglio et al. [31]. Approximately 0.5 mL of the vesicle solution was transferred by pipette into a 5 mm NMR tube and the samples analyzed immediately after preparation.
Freeze-fracture Transmission Electron Microscopy (TEM)
Samples for freeze-fracture TEM were prepared by extrusion of an MLV dispersion (20 mg/mL) ten times through two stacked 200 nm nominal diameter track-etch polycarbonate membranes until an almost transparent solution was produced [31]. A drop of extruded solution was placed between copper planchets, frozen in liquid nitrogen, fractured and the exposed vitrified sample surface shadowed at 30° with Pt, followed by carbon deposition at 90°. The replicas were then sequentially washed with deionized water, 2N HNO3, and deionized water before transferring onto TEM grids. The grids were then visualized using a Phillips Model 400 TEM instrument operating at 80 kV.
Dynamic Light Scattering (DLS)
Liposome sizes after extrusion were determined by quasielastic light scattering using a Coulter N4-Plus instrument. Mean size and distributions were calculated using the manufacturer’s supplied software.
Differential Scanning Calorimetry (DSC)
Calorimetric experiments were performed on a TA DSC-2920 instrument using 5 mg of extruded vesicle sample (19.8 mg/mL) in stainless steel pans. All thermograms were run using the same volume of water as reference. The instrument was calibrated using the In Tm as standard. Thermograms were collected in heating mode over a range of -20 to 80°C at a scan rate of 20°C/min. Three thermograms were collected and the average values for the transition temperature and transition enthalpy reported.
31P NMR chemical shift anisotropy
Proton-decoupled 31P NMR spectra were acquired at temperatures from −15 to 65°C to determine the chemical shift anisotropy of the 31P powder pattern lineshape for C20BAS. The sample was prepared as discussed above at a concentration of 19.8 mg/mL in D2O. Spectra were obtained using a Bruker DRX 500 spectrometer equipped with a 5 mm probe. The following sample cooling procedure was used: The probe was cooled to −15°C with a methanol standard inside. The C20BAS dispersion was transferred into the NMR tube and inserted into an ethylene glycol/dry ice bath for 5 min while spinning the sample manually. The C20BAS sample was then exchanged for the methanol sample inside the instrument. A period of 15 min was allowed for temperature equilibration before spectral acquisition at the desired temperature. For each temperature studied, 3000 transients were collected using a relaxation delay of 3 s, a 90° pulse duration of 12 μs, and an acquisition time of 0.5 s. Line broadening of 100 Hz was applied. The width at half the peak height was measured for each spectrum and the results plotted in ppm vs. temperature.
PFG-NMR Diffusion Measurements
The instrument used was a Bruker DRX 500 spectrometer equipped with an Acustar II 1*10 gradient amplifier and a TXI_HCN_Z single-axis gradient probe. The probe had a maximum gradient output of 551 G/m·A (5.51 × 10 −2 T/m·A). D2O was used as a reference with an experimental D value of 1.74 × 10⁻⁵ cm2/s at 25°C (cf., D = 1.87 × 10⁻⁵ cm2/s at 25°C [32]). Data sets were obtained using the BPPS-LED pulse sequence shown in Figure 2 [27, 33, 34]. The use of half-sine gradient pulses reduces the generation of phase-based artifacts by decreasing the rate of change of the magnetic field when the gradient pulse is switched on or off [35]. The fourth 90° pulse stores magnetization in the longitudinal direction, allowing the eddy currents to decay during the period Te; the use of a bipolar sequence further reduces the effects of eddy currents. The duration (σ) of the applied gradient (p30) was set to 0.006–0.01 s for POPC and 0.002–0.006 s for C20BAS. The amplitude of the applied gradient (g) was varied from 5% to 95% of the maximum field strength at 25 °C. The diffusion time, Δ(D20), was set to 0.3–0.5 s for POPC and 0.05–0.1 s for C20BAS. The values of p30 and D20 were modified in the experiments to obtain a reduction in signal intensity of 70% or greater at 95% of the gradient strength. The PFG-NMR experiment was done in 10 steps, from 5% to 95% of the maximum gradient field strength. A 1H spectrum was obtained for every step and the peak area for the phosphocholine PO-CH2CH2-N and N(CH3)3+ signals integrated. The exponential decay curve was plotted as the signal intensity (normalized by the peak area at 5% gradient) versus K (K= (γδg)2[((4Δ-δ)/π 2)-τ/2]) and fitted as a biexponential decay, where τ is the correction for the time between the bipolar gradients, γ is the proton magnetogyric ratio (2.68 × 10⁸ rad/T·s), and the fast component was attributed particle tumbling. Origin 6.0 was used for curve fitting to determine the decay constant, 1/D, where D is the lateral diffusion coefficient in cm2/s. PFG-NMR was performed 16 and 14 times each on the same samples of POPC and C20BAS, respectively. The average D is reported along with the standard deviation for each data set.
Figure 2.
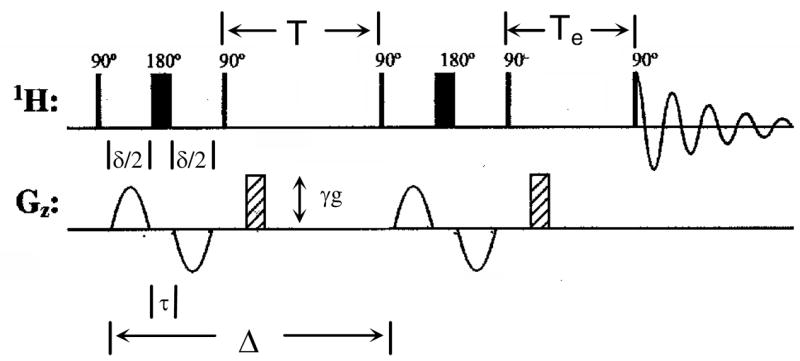
BPPS-LED pulse sequence used in our PFG-NMR diffusion measurements.
FRAP experiments
Two sets of cover slips were prepared using the vesicle casting method for production of supported lipid bilayers, briefly described as follows. The first set of cover slips was cleaned with warm Triton® X100 detergent (Sigma, MO) for 10 min, rinsed extensively with deionized H2O, dried under a stream of N2 and baked at 400 °C for 5 h. The second set was cleaned with piranha solution (7:3 H2SO4:H2O2) for 1 h, rinsed extensively with 18 MΩ H2O and dried under a stream of pure Ar. NOTE: Piranha solutions are potentially explosive! They should be handled with extreme caution. POPC and C20BAS vesicles were prepared by extrusion of MLV dispersions as described above. Total lipid concentrations were 5 μmol/mL, with lipid ratios of 99.5 mol% lipid + 0.5 mol% NBD-OPPC. The vesicle solutions were mixed with 300 mM NaCl in water (1:1 vol:vol ratio) and transferred to a perfusion chamber mounted on the cover glass. After approximately 1 min, the cover slips were submerged in an 18 MΩH2O bath and the excess vesicles removed by swirling the cover glass inside the bath. A cover slip sandwich was prepared, removed from the bath and quickly placed on a microscope holder that maintained the hydration inside the sandwich at all times by incorporating pools filled with 18 MΩ H2O on both sides. All FRAP measurements were conducted at 25 °C.
A Nikon TE200U fluorescence microscope, coupled to a silicon avalanche photodiode, was used for FRAP detection. A continuous wave argon ion laser (488 nm emission, 25 mW) was used to both bleach and excite the NBD-OPPC fluorophore (NBD λex = 460 nm, λem = 534 nm). A neutral density filter (NDF) was placed in the beam path to lower the laser intensity to 250 nW to avoid constant photobleaching of the probe. A shutter was pulsed to allow the laser to monitor the initial counts of the sample for ~40 s. Upon removal of the NDF from the beam path, a single photobleaching laser pulse was sent for ≤1 s (bleach radius = 13 μm). Diffusion coefficients of NBD-OPPC in POPC and C20BAS supported membranes were determined by measuring the half-time to recovery using a modified Bessel function as described by Soumpasis [37]. The diffusion coefficients determined in this manner are accurate to ±15 %.
RESULTS AND DISCUSSION
Vesicle size and morphology
DLS experiments showed that freshly extruded samples of C20BAS have a mean particle diameter of 133 nm ± 43 nm, however, the average vesicle diameter and sample polydispersity increased with time. This behavior is consistent with previously reported behavior for bolalipid vesicles that undergo extensive vesicle aggregation and membrane-membrane fusion in the absence of cholesterol to produce very large vesicles of varying diameter [31].
The morphology of the C20BAS bolalipid dispersions 2–3 days after extrusion was analyzed by freeze-fracture TEM (Figure 3). These dispersions contained a mixture of multilamellar lipid, oligolamellar vesicles and large unilamellar vesicles of different sizes, with cross-fractured features that are characteristic of bipolar lipid phases [9,18,38]. The observed mean particle sizes determined by TEM were larger than the values determined by DLS. This difference is attributed to vesicle aggregation and fusion processes that are induced by the propensity of the centrosymmetric bolalipids to adopt a transmembrane conformation [9,31,38–40], thus biasing the sample towards the formation of less highly curved membrane structures in solution.
Figure 3.
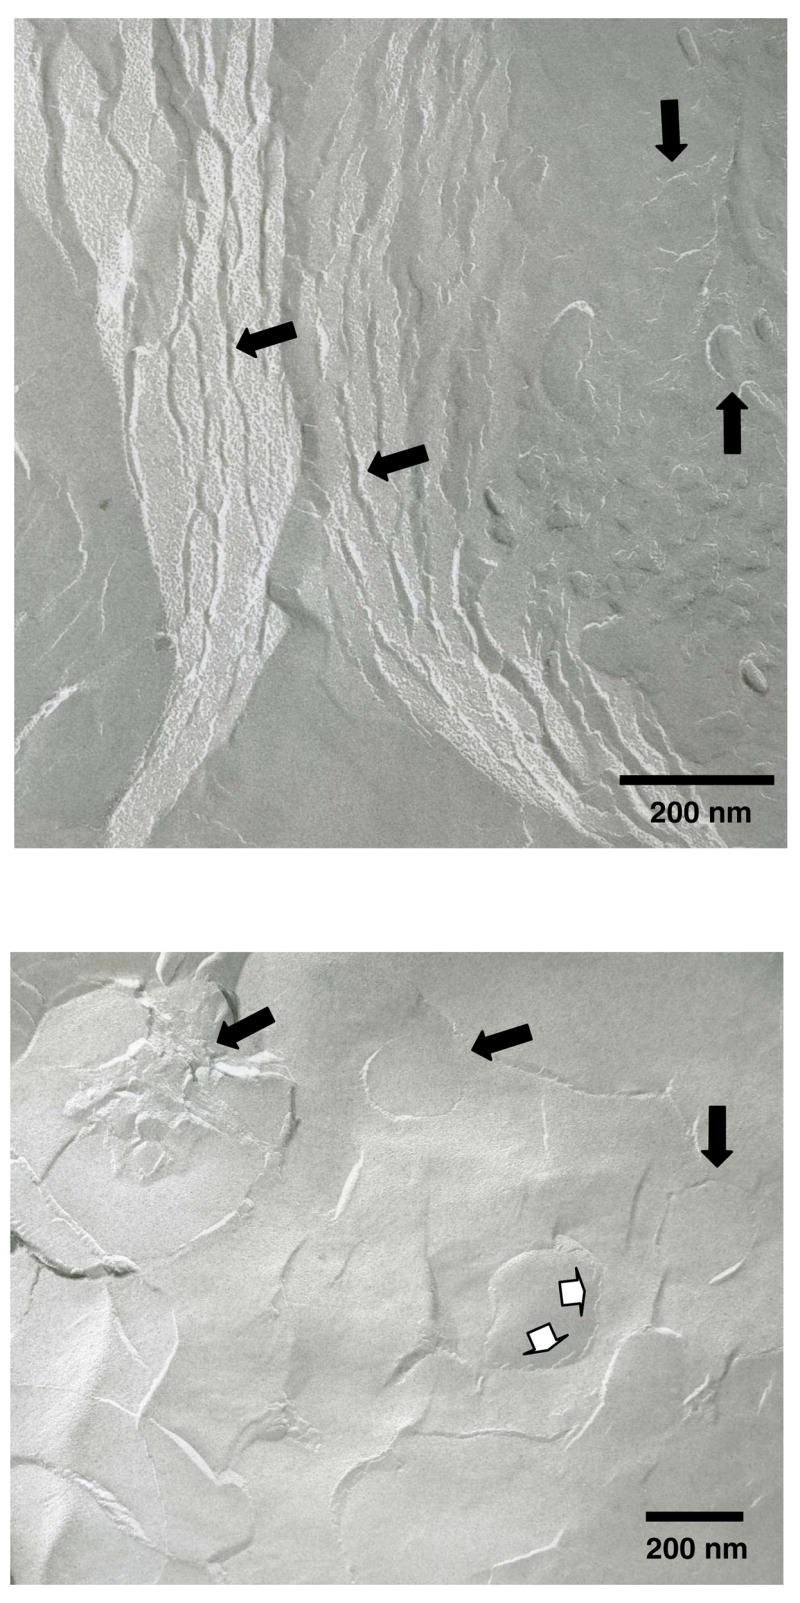
Freeze-fracture TEM images of C20BAS vesicles after extrusion ten times through 200 nm track-etch membranes. Filled arrows: Cross-fractured multilamellar lipid structures, oligolamellar vesicles and unilamellar vesicles. Open arrows: Remnants of cross-fractured oligolamellar vesicle membrane.
Phase transition behavior of C20BAS dispersions
DSC analyses of freshly extruded C20BAS samples (Figure 4A) indicated that the main melting transition temperature of this lipid is 15.7 °C, in good agreement with the value determined by 31P NMR (Tm = 15.8 °C, Figure 3B) and in modest agreement with temperature-dependent Raman analysis (Tm = 19 °C) [31]. These data indicate that the bolalipid membranes are in their liquid crystalline lamellar phase under the experimental conditions employed in this study. 31P NMR chemical shift anisotropy (CSA) of C20BAS, obtained over a range of temperatures from −15 to 65°C, were used as an additional probe for lipid phase transitions (Figure 4B). No other phase transitions were noted over this temperature range using either technique.
Figure 4.
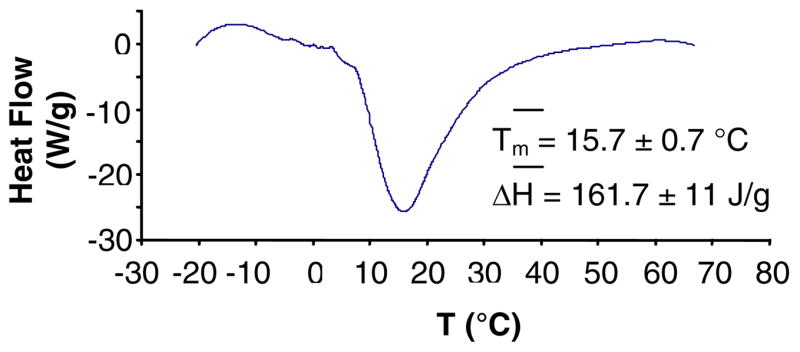
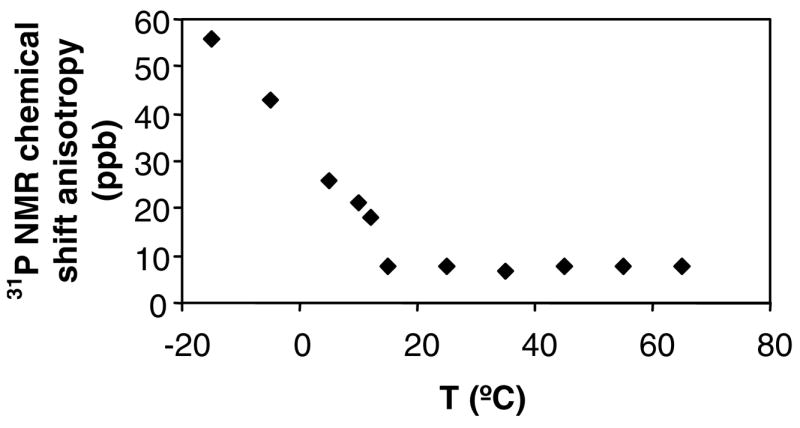
A: DSC of C20BAS dispersion (19.8 mg/mL), 5 mg of extruded vesicle solution in sealed stainless steel pans, heating rate of 20°/min. Average values (three runs) for the phase transition temperature and transition enthalpy are shown. B: 31P NMR chemical shift anisotropy of C20BAS as a function of temperature.
Lateral diffusion rates of C20BAS dispersions
PFG-NMR Diffusion Measurements
PFG-NMR was used to measure the lateral diffusion coefficients of POPC and C20BAS in MLV dispersions. 1H NMR spectra were obtained while applying 5%–95% field gradient strengths using the BPPS-LED pulse sequence (Figure 2). The duration of the applied gradient and the diffusion time were adjusted for each sample to ensure that approximately 15% of the initial peak area remained at 95% of the maximum gradient strength. The phosphocholine trimethylammonium and phosphoethanolamine signals were integrated and the normalized peak intensity plotted versus K (K= (γδ g)2[((4Δ- δ)/π 2)-τ/2)). Treatment of these data typically produced a biexponential decay with respect to K, where the slope of the fast component is attributed to diffusion of the bolalipid by particle tumbling and the second slower decay gives the observed lateral diffusion coefficient for the lipids.
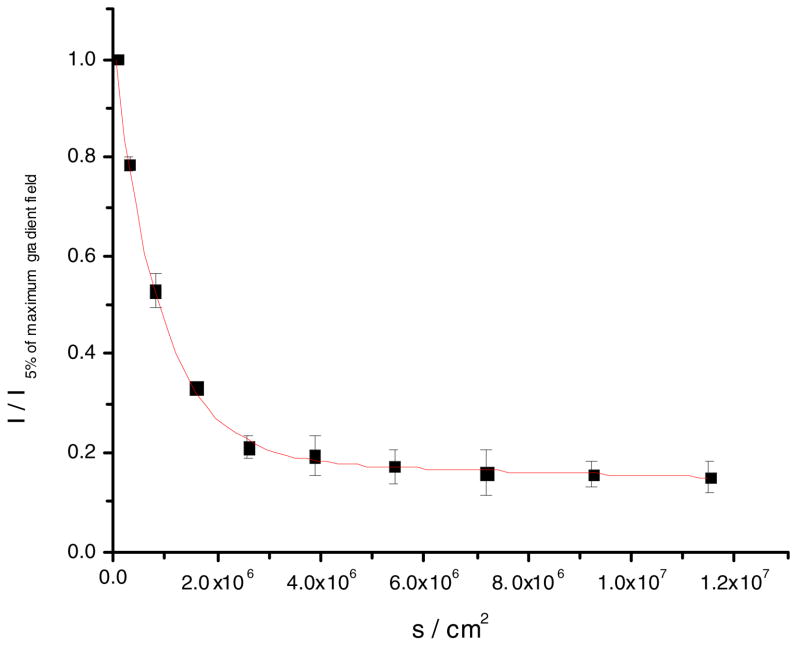
Our PFG-NMR methods were standardized using POPC MLV at 25° C as a benchmark (Figure 5). The lateral diffusion coefficient of POPC at 25° C using this method, 1.8 ± 0.9 × 10− 8 cm2/s (average of six measurements), is within a factor of five of the value reported by Lindblom and coworkers [41] (8.9 × 10− 8 cm2/s) at the same temperature using PFG-NMR with aligned POPC multilayers. Our value for the lateral diffusion coefficient of POPC using PFG-NMR is also in good agreement with the reported diffusion coefficient (4 × 10− 8 cm2/s [42]) of POPC using FRAP.
Figure 5.
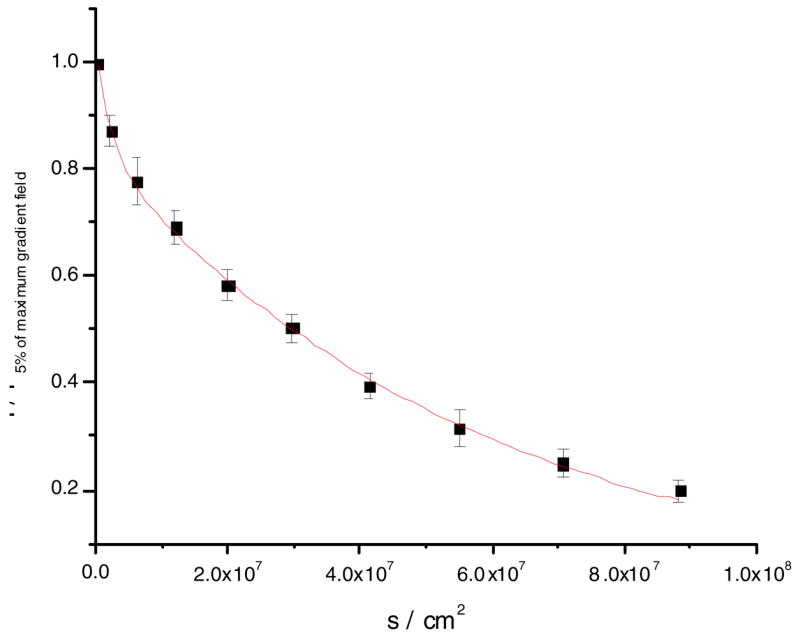
Fit to an average of six PFG-NMR diffusion measurements for POPC MLV at 25 °C. The 5–95% gradient strength data is shown. D = 1.8 × 10⁻⁸ cm2/s, R2 = 0.998.
The lateral diffusion coefficient of C20BAS in D2O at 25 ° C (Figure 6) was determined to be 1.9 ± 0.6 ×10− 8 cm/s2 (average of five measurements). It is noteworthy that the lateral diffusion coefficient of this synthetic bolalipid was in poor agreement with the diffusion coefficients determined for the mixture of naturally-occurring main tetraether phospholipids (MPL) from Thermoplasma acidophilum. The reported diffusion coefficients of MPL extract are: 5-6 × 10− 9 cm2/s at 30 °C, 1 × 10− 8 cm2/s at 40 °C, and 2 × 10− 8 cm2/s at 55 °C (determined by 2D exchange 31P NMR) [24]. Since MPL contains nearly 46% of a macrocyclic diglyceryl tetraether bolalipid with two chemically-distinct headgroups (β-L-gulose and sn-3-phosphoglycerol) and two C40 isoprenoid-based hydrocarbon chains bearing multiple cyclopentane rings [43], it was expected to have a much slower rate of lateral diffusion than the C20BAS analog described in this study that has a shorter transmembrane alkyl chain and unbranched sn-2 alkyl chains. Rotational correlation times of the MPL lipid mixture have also been determined using EPR [23] and found to be at least three orders of magnitude slower than those of conventional monopolar lipids. These PFG-NMR experiments yield the surprising finding that the lateral diffusion coefficients are similar for two lipids with dramatically different structures (i.e. bipolar vs. monopolar with 28 Å vs. 40 Å thick membranes [44]). It was expected that C20BAS would have a smaller diffusion coefficient relative to POPC since its lateral diffusion requires correlated motion of the headgroups pinned at opposing membrane interfaces [43], however, this phenomenon may be counterbalanced by the thinner membranes formed by C20BAS [31] that may undergo less chain entanglement due to the absence of macrocyclization and alkyl chain branching as is found in the natural product MPL. Additional experiments using structural analogs will be required to resolve this question.
Figure 6.
Fit to an average of five PFG-NMR diffusion measurements for C20BAS (8 mM) vesicles at 25 °C. The 5–95% gradient strength data is shown. D = 1.9 × 10⁻⁸ cm2/s, R2 = 0.996.
FRAP Measurements
Lipid lateral diffusion coefficients, determined using the FRAP technique for supported membrane samples, are summarized in Table 1. Our observed lateral diffusion coefficient of 2.5 ± 0.9 × 10− 8 cm2/s for POPC on detergent cleaned slides was in reasonable agreement with the reported literature value of 4 × 10− 8 cm2/s at 25°C [42]. Upon treating the glass surface with detergent prior to the experiment instead of piranha solution, the diffusion coefficient for POPC increased by a factor of three, however, no such change was observed with C20BAS. An extensive literature search did not reveal previous work on the investigation of the effect of substrate preparation on the lateral diffusion of supported lipid layers by FRAP. When the FRAP results on detergent-cleaned glass are compared with the PFG-NMR diffusion measurements, the latter method was found to produce slightly larger lateral diffusion coefficients for both POPC and C20BAS. This observation is consistent with the findings of Cafiso et al. for lipid diffusion in vesicles vs. planar or multilamellar systems [45]. These differences could be explained by the fact that FRAP monitors the macroscopic diffusion of probe molecules that are doped into the lipid matrix of interest over large distances, whereas PFG-NMR tracks the motion of individual molecular segments of an ensemble of the lipid molecules themselves. Since short-range motion of the molecules or individual segments may be sufficient to prevent refocusing of the PFG-NMR signal, these processes may effectively produce a faster observed diffusion rate.
Table 1.
Diffusion coefficients of lipid vesicles determined by PFG-NMR and of supported membranes using FRAP on detergent- or piranha-treated slides. T = 25°C. The number of measurements performed to generate the average values reported is shown in parentheses (n)
| Lipid | PFG-NMR(× 108 cm2/s) | FRAP(× 108 cm2/s) detergent | FRAP(× 108 cm2/s) piranha |
|---|---|---|---|
| POPC | 1.8 ± 0.9 (6) | 8.0 ± 2.2 (3) | 2.5 ± 0.1 (3) |
| C20BAS | 1.9 ± 0.6 (5) | 1.5 ± 0.1 (3) | 1.2 ± 0.1 (3) |
CONCLUSIONS
We present the first PFG-NMR data describing the lateral diffusion coefficient of a synthetic tetraether bolalipid. The lateral diffusion coefficients for pure C20BAS dispersions were found to be DPFG-NMR = 1.9 ±0.6 × 10− 8 cm2/s and DFRAP = 1.2 ±0.1 × 10− 8 cm2/s at 25 °C, providing good agreement between the two methods. The observed lateral diffusion coefficient for C20BAS is surprisingly similar to POPC, a lipid with a fundamentally different structure (i.e. monopolar vs. bipolar) that forms ultrathin membranes. The measured diffusion coefficients of C20BAS were also found to be significantly faster—by an order of magnitude—than the lateral diffusion rates determined for the naturally-occurring bipolar lipid extract MPL obtained from Thermoplasma acidophilum. These findings demonstrate that synthetic bipolar phospholipids can form membranes with similar fluidity characteristics of POPC membranes, which is relevant when considering these membranes for potential supported membrane applications.
Acknowledgments
The authors would like to acknowledge the assistance of Dr. Jong-Mok Kim (TEM), the Purdue NMR Facility (T-dependent 31P NMR and PFG-NMR), and Kalani Seu & Prof. Jennifer Hovis (FRAP measurements). We would also like to thank Prof. John B. Grutzner and Dr. John S. Harwood for helpful discussions regarding the PFG-NMR experiments. The generous support of the Indiana 21st Century Fund and the NIH “Diversity in Biomedical Science Program” at Purdue University are also greatly appreciated.
List of Abbreviations
- BPPS-LED
bipolar pulse pair longitudinal eddy current delay sequence
- C20BAS
2,2′-di-O-decyl-3,3′-di-O-(eicosanyl)-bis-(rac-glycero)-1,1′-diphosphocholine
- CHCl3
chloroform
- CSA
chemical shift anisotropy
- D
diffusion coefficient
- DLS
dynamic light scattering
- DSC
differential scanning calorimetry
- EPR
electron paramagnetic resonance
- FRAP
fluorescent recovery after photobleaching, MLV, multilamellar vesicle
- MPL
main tetraether phospholipids
- NBD-POPC
1-oleoyl-2-[6-[(7-nitro-2-1,3-benzoxadiazol-4-yl)amino]hexanoyl]-sn-glycero-3-phosphocholine
- NDF
neutral density filter
- PFG
pulse field gradient
- POPC
1-palmitoyl-2-oleoyl-sn-glycero-3-phosphocholine
- PPM
parts per million
- TEM
transmission electron microscopy
Footnotes
SUPPLEMENTARY INFORMATION
Temperature-dependent 31P NMR spectra, stacked 1H-PFG-NMR plots and kinetic analyses of C20BAS samples appear as supplementary material.
References
- 1.Langworthy TA. In: The Bacteria. Woese CR, Wolfe RS, editors. VIII. Academic Press; New York, NY: 1985. pp. 459–497. [Google Scholar]
- 2.Damsté JSS, Schouten S, Hopmans EC, van Duin ACT, Geenevasen JAJ. J Lipid Res. 2002;43:1641–1651. doi: 10.1194/jlr.m200148-jlr200. [DOI] [PubMed] [Google Scholar]
- 3.De Rosa M, Gambacorta A. Prog Lipid Res. 1988;27:153–175. doi: 10.1016/0163-7827(88)90011-2. [DOI] [PubMed] [Google Scholar]
- 4.Kates M. Biochem Soc Symp. 1993;58:51–72. [PubMed] [Google Scholar]
- 5.Patel GB, Sprott GD. Crit Rev Biotech. 1999;19:317–357. doi: 10.1080/0738-859991229170. [DOI] [PubMed] [Google Scholar]
- 6.Winker S, Woese CR. Syst Appl Microbiol. 1991;14:305–310. doi: 10.1016/S0723-2020(11)80303-6. [DOI] [PubMed] [Google Scholar]
- 7.Gräther O, Arigoni D. Chem Comm. 1995:405–406. [Google Scholar]
- 8.Hopmans EC, Schouten S, Pancost RD, van der Meer MTJ, Damsté JSS. Rapid Comm Mass Spec. 2000;14:585–589. doi: 10.1002/(SICI)1097-0231(20000415)14:7<585::AID-RCM913>3.0.CO;2-N. [DOI] [PubMed] [Google Scholar]
- 9.Thompson DH, Wong K, Humphry-Baker R, Wheeler J, Kim JM, Rananavare SB. J Am Chem Soc. 1992;114:9035–9042. [Google Scholar]
- 10.Elferink MGL, de Wit JG, Driessen AJM, Konings WN. Biochim Biophys Acta. 1994;1193:247–254. doi: 10.1016/0005-2736(94)90160-0. [DOI] [PubMed] [Google Scholar]
- 11.Arakawa K, Kano H, Eguchi T, Nishiyama Y, Kakinuma K. Bull Chem Soc Jpn. 1999;72:1575–1581. [Google Scholar]
- 12.Arakawa K, Eguchi T, Kakinuma K. Chem Lett. 2001:440–441. [Google Scholar]
- 13.Kim JM, Patwardhan A, Bott A, Thompson DH. Biochim Biophys Acta. 2003;1617:10–21. doi: 10.1016/j.bbamem.2003.08.011. [DOI] [PubMed] [Google Scholar]
- 14.Thompson DH, Patwardhan AP, Di Meglio C, Kim J-M, Febo-Ayala W, Haynes R, Burden DLSB. Rananavare. unpublished results. [Google Scholar]
- 15.Cornell BA, Braach-Maksvytis VLB, King LG, Osman PDJ, Raguse B, Wieczorek L, Pace RJ. Science. 1997;387:580–583. doi: 10.1038/42432. [DOI] [PubMed] [Google Scholar]
- 16.Wiess-Wichert C, Smetazko M, Valina-Saba M, Schalkhammer T. J Biomol Screening. 1997;2:11–18. [Google Scholar]
- 17.Thompson DH, Kim JM. MRS Symp. 1992;277:93–98. [Google Scholar]
- 18.Thompson DH, Kim JM, Di Meglio C. SPIE Proc. 1993;1853:142–147. [Google Scholar]
- 19.Schouten S, Hopmans EC, Schefuss E, Damsté JSS. Earth Planet Sci Lett. 2002 ;204:265–274. ibid 211, 205-206. [Google Scholar]
- 20.Schouten S, Hopmans EC, Forster A, van Breugel Y, Kuypers MMM, Damsté JSS. Geology. 2003;31:1069–1072. [Google Scholar]
- 21.Fuhrhop JH, Wang T. Chem Rev. 2004;104:2901–2938. doi: 10.1021/cr030602b. [DOI] [PubMed] [Google Scholar]
- 22.Gabrielli G, Gliozzi A, Sanguineti A, D’Agata A. Coll Surf. 1989;35:261–273. [Google Scholar]
- 23.Bruno S, Gliozzi A, Cannistraro S. J Physique. 1986;47:1555–1563. [Google Scholar]
- 24.Jarrell HC, Zukotynski DA, Sprott GD. Biochim Biophys Acta. 1998;1369:259–266. doi: 10.1016/s0005-2736(97)00228-9. [DOI] [PubMed] [Google Scholar]
- 25.Baba T, Minamikawa H, Hato M, Handa T. Biophys J. 2001;81:3377–3386. doi: 10.1016/S0006-3495(01)75970-X. [DOI] [PMC free article] [PubMed] [Google Scholar]
- 26.Vaz WLC, Hallmann D, Clegg RM, Gambacorta A, DeRosa M. Eur Biophys J. 1985;12:19–24. doi: 10.1007/BF00254091. [DOI] [PubMed] [Google Scholar]
- 27.Gibbs SJ, Johnson CS. J Mag Reson. 1991;93:395–402. [Google Scholar]
- 28.Kim JM, Thompson DH. Langmuir. 1992;8:637–644. [Google Scholar]
- 29.Patwardhan AP, Thompson DH. Org Lett. 1999;1:241–244. doi: 10.1021/ol990567o. [DOI] [PubMed] [Google Scholar]
- 30.Patwardhan AP, Thompson DH. Langmuir. 2001;16:10340–10350. [Google Scholar]
- 31.Di Meglio C, Rananavare S, Svenson S, Thompson DH. Langmuir. 2000;16:128–133. [Google Scholar]
- 32.Holz M, Weingartner H. J Magn Reson. 1991;92:115–125. [Google Scholar]
- 33.Johnson CS. Prog NMR Spec. 1999;34:203–256. [Google Scholar]
- 34.Altieri AS, Hinton DP, Byrd RA. J Am Chem Soc. 1995;117:7566–7567. [Google Scholar]
- 35.Price WS, Hayamizu K, Ide H, Arata Y. J Mag Res. 1999;139:205–212. doi: 10.1006/jmre.1999.1789. [DOI] [PubMed] [Google Scholar]
- 36.Wassall SR. Biophys J. 1996;71:2724–2732. doi: 10.1016/S0006-3495(96)79463-8. [DOI] [PMC free article] [PubMed] [Google Scholar]
- 37.Soumpasis DM. Biophys J. 1983;41:95–97. doi: 10.1016/S0006-3495(83)84410-5. [DOI] [PMC free article] [PubMed] [Google Scholar]
- 38.Lecollinet G, Gulik A, Mackenzie G, Goodby JW, Benvegnu T, Plusquellec D. Chem Eur J. 2002;8:585–593. doi: 10.1002/1521-3765(20020201)8:3<585::AID-CHEM585>3.0.CO;2-5. [DOI] [PubMed] [Google Scholar]
- 39.Cuccia LA, Morin F, Beck A, Hébert N, Just G, Lennox RB. Chem Eur J. 2000;6:4379–4383. doi: 10.1002/1521-3765(20001201)6:23<4379::aid-chem4379>3.0.co;2-m. [DOI] [PubMed] [Google Scholar]
- 40.Quesada E, Acuña AU, Amat-Guerri F. Angew Chem Int Ed. 2001;40:2095–2097. [PubMed] [Google Scholar]
- 41.Lindblom G, Johansson LBA, Arvidson G. Biochemistry. 1981;20:2204–2207. doi: 10.1021/bi00511a020. [DOI] [PubMed] [Google Scholar]
- 42.Vaz WLC, Hallmann D, Clegg RM, Gambacorta A, De Rosa M. Eur Biophys J. 1985;12:19–24. doi: 10.1007/BF00254091. [DOI] [PubMed] [Google Scholar]
- 43.Schuster B, Weigert S, Pum D, Sara M, Sleytr UB. Langmuir. 2003;19:2392–2397. [Google Scholar]
- 44.Febo-Ayala W, Morera-Felix S, Hrycyna CA, Thompson DH. Biochemistry. 2006;45:14683–14694. doi: 10.1021/bi061159c. [DOI] [PMC free article] [PubMed] [Google Scholar]
- 45.Ellena JF, Lepore LS, Cafiso DS. J Phys Chem. 1993;97:2952–2957. [Google Scholar]


