Abstract
Activation of glomerular mesangial cells (MCs) by angiotensin II (Ang II) leads to hypertrophy and extracellular matrix accumulation. Here, we demonstrate that, in MCs, Ang II induces an increase in PDK-1 (3-phosphoinositide-dependent protein kinase-1) kinase activity that required its phosphorylation on tyrosine 9 and 373/376. Introduction into the cells of PDK-1, mutated on these tyrosine residues or kinase-inactive, attenuates Ang II-induced hypertrophy and fibronectin accumulation. Ang II-mediated PDK-1 activation and tyrosine phosphorylation (total and on residues 9 and 373/376) are inhibited in cells transfected with small interfering RNA for Src, indicating that Src is upstream of PDK-1. In cells expressing oxidation-resistant Src mutant C487A, Ang II-induced hypertrophy and fibronectin expression are prevented, suggesting that the pathway is redox-sensitive. Ang II also up-regulates Nox4 protein, and siNox4 abrogates the Ang II-induced increase in intracellular reactive oxygen species (ROS) generation. Small interfering RNA for Nox4 also inhibits Ang II-induced activation of Src and PDK-1 tyrosine phosphorylation (total and on residues 9 and 373/376), demonstrating that Nox4 functions upstream of Src and PDK-1. Importantly, inhibition of Nox4, Src, or PDK-1 prevents the stimulatory effect of Ang II on fibronectin accumulation and cell hypertrophy. This work provides the first evidence that Nox4-derived ROS are responsible for Ang II-induced PDK-1 tyrosine phosphorylation and activation through stimulation of Src. Importantly, this pathway contributes to Ang II-induced MC hypertrophy and fibronectin accumulation. These data shed light on molecular processes underlying the oxidative signaling cascade engaged by Ang II and identify potential targets for intervention to prevent renal hypertrophy and fibrosis.
Cellular hypertrophy and extracellular matrix accumulation in glomeruli contributes to the pathogenesis of glomerulosclerosis in fibrotic renal diseases (1-5). The octapeptide hormone angiotensin II (Ang II)2 is the dominant renin-angiotensin system effector (5-7) and is implicated in the pathogenesis of fibrosis of the glomerular microvascular bed. Up-regulation of the renin-angiotensin system plays a key role in the initiation and the progression of glomerular injury via induction of hypertrophy and extracellular matrix expansion in glomerular mesangial cells (MCs) (6-13).
Ang II-induced oxidative stress has emerged as a critical pathogenic factor in the development of renal and vascular diseases (13-16). NAD(P)H oxidases of the Nox family are major sources of reactive oxygen species (ROS) in many nonphagocytic cells, including renal cells (17-21). The Nox proteins correspond to homologues of gp91phox (or Nox2), the catalytic moiety found in phagocytes (17, 18). Seven members of the Nox family have been identified in the human genome: Nox1 to -5 and the dual oxidases Duox1 and -2 (17, 18, 22). The isoform Nox4 (NAD(P)H oxidase 4) is abundant in the vascular system and kidney cortex (16, 17, 19-22). We have previously demonstrated a role for Nox4 as the major source of ROS in the kidneys during early stages of diabetes and that the oxidase mediates renal hypertrophy and increased fibronectin expression (23). We have also reported that Nox4-derived ROS mediate Ang II-induced Akt/protein kinase B (PKB) activation and protein synthesis in MCs (21, 24).
The serine/threonine kinase PDK-1 (3-phosphoinositide-dependent protein kinase-1) is the upstream activator of Akt/PKB (25, 26). PDK-1 is constitutively active. The enzyme is further activated following treatment with agonists and oxidative stress (27-30). Constitutive autophosphorylation of PDK-1 on serine 241 is critical for kinase activity (31). Recent evidence indicates that PDK-1 is also phosphorylated on tyrosine residues, leading to further increase in activity (32-35). Three tyrosine residues, tyrosine 9, tyrosine 373, and tyrosine 376, are phosphorylated by insulin, Ang II, high glucose, and the oxidants pervanadate and hydrogen peroxide (28, 30, 32, 33, 35-37). Importantly, tyrosine 373/376 phosphorylation of PDK-1 is important for its catalytic activity and appears to be dependent on tyrosine 9 phosphorylation (28, 32). The protein kinase Src has also been implicated in tyrosine phosphorylation of PDK-1 in vitro and in vivo (28, 32, 33, 35). Interestingly, in MCs, Ang II activates Src as well as many of the known substrates of PDK-1, such as Akt/PKB, protein kinase C, and p70S6K (38-41). Furthermore, all these kinases are implicated in the hypertrophic or fibrotic response to Ang II (38, 39, 41, 42).
This study indicates that PDK-1 is tyrosine-phosphorylated and activated by Ang II in a redox-dependent manner. We identify Nox4 NAD(P)H oxidase as a critical mediator of PDK-1 tyrosine phosphorylation and activation through Src oxidation. We also demonstrate that Ang II up-regulates Nox4. Furthermore, we establish for the first time that the tyrosine phosphorylation/activation of PDK-1 contributes to MC hypertrophy and fibronectin expression, indicating that this cascade involving PDK-1 plays a central role in the control of the signaling events implicated in Ang II-induced cell injury.
EXPERIMENTAL PROCEDURES
Cell Culture, Transfections, and Adenovirus Infection—Rat glomerular MCs were isolated and characterized as described (23). These cells were used between 15th and 30th passages. Selected experiments were performed in primary and early passaged MCs to confirm the data obtained with late passages. Cells were maintained in Dulbecco's modified Eagle's medium supplemented with antibiotic/antifungal solution and 17% fetal bovine serum.
Transient transfection of MCs with plasmid DNA (15 μg of vector alone or Myc epitope-tagged mammalian expression construct with PDK-1 mutated at tyrosine 373 (Myc-PDK-1Y373F) or redox-insensitive mutant of Src (SrcC487A)) was performed by electroporation (Gene Pulser; Bio-Rad), as previously described (41). Construction of mutant expression vector Myc-PDK-1Y373F was described previously (28). SrcC487A was a generous gift from Dr. P. Chiarugi (University of Florence, Italy) (43). For the RNA interference experiments, a SMART-pool consisting of four short or small interfering RNA (siRNA) duplexes specific for rat Nox4, Src, PDK-1, Pyk-2 (proline-rich tyrosine kinase-2), or p70S6K was obtained from Dharmacon. The SMARTpool of siRNAs was introduced into the cells by double transfection using Oligofectamine or Lipofectamine as described (24). The siRNAs for Nox4, Src, PDK-1, Pyk-2, or p70S6K were used at a concentration of 100 nm. Scrambled siRNAs (nontargeting siRNA) (100 nm) served as controls to validate the specificity of the siRNAs (42). Adenovirus encoding a kinase-inactive form of PDK-1 (AdPDK-1K11N), adenovirus encoding PDK-1 mutated at tyrosine 9 (AdPDK-1Y9F), and adenovirus encoding for wild type PDK-1 (AdWTPDK-1) were described previously (28, 44, 45). MCs were infected with adenovirus vectors at the indicated multiplicity of infection as previously described (46). As a control for the effects of adenovirus infection alone, an adenovirus encoding green fluorescent protein lacking an insert (AdGFP) was used.
RNA Extraction, Reverse Transcription (RT)-PCR—Primers for rat Nox4 were designed as described previously (24, 46): 5′-GATGTTGGGCCTAGGATTGTGT-3′ (forward primer) and 5′-CAGCCAGGAGGGTGAGTGTCTAA-3′ (reverse primer). Total RNA was isolated from MCs, and the RT-PCR was carried out using the SuperScript One-Step RT-PCR kit (Invitrogen) as described. Amplification was carried out for 35 cycles at 93 °C for 1 min, 85 °C for 1 min, and 72 °C for 1 min. The expected size of the PCR product for Nox4 is 534 bp. End products were resolved on agarose gel, stained with ethidium bromide, and visualized and photographed under UV light.
Immunoprecipitation and PDK-1 Activity Assay—MCs grown to near confluence were made quiescent by serum deprivation for 48 h and exposed to serum-free Dulbecco's modified Eagle's medium at 37 °C for the specified duration. The cells were lysed in radioimmune precipitation buffer (20 mm Tris-HCl, pH 7.5, 150 mm NaCl, 5 mm EDTA, 1 mm Na3VO4, 1 mm phenylmethylsulfonyl fluoride, 20 μg/ml aprotinin, 20 μg/ml leupeptin, and 1% Nonidet P-40) at 4 °C for 30 min. The cell lysates were centrifuged at 10,000 × g for 30 min at 4 °C. Protein was determined in the cleared supernatant using the Bio-Rad protein assay reagent. For immunoprecipitation, equal amounts of protein (100-500 μg) were incubated with sheep anti-PDK-1 antibody (Upstate Biotechnology, Inc., Lake Placid, NY) for 4 h. Protein G-Sepharose beads were added, and the resulting mixture was further incubated at 4 °C for 1 h on a rotating device. The beads were washed three times with radioimmune precipitation buffer and twice with phosphate-buffered saline. The kinase reaction was carried out by incubating the immunobeads in kinase assay buffer (50 mm Tris-HCl, pH 7.4, 10 nm MgCl2, 25 mm β-glycerophosphate, 1 mm dithiothreitol, 10 mm microcystin, and 1 mm Na3VO4) in the presence of 1 μg/ml purified unactivated Akt1/PKBα (Upstate Biotechnology), and 20 μm cold ATP plus 5 μCi of [γ-32P]ATP for 30 min at 30 °C (47). This reaction was stopped by the addition of 2× sample buffer, after which the samples were subjected to 12.5% SDS-polyacrylamide gel electrophoresis, and phosphorylated unactivated Akt/PKB was visualized by autoradiography or using a PhosphorImager. The bands were quantitated by densitometry and/or PhosphorImager analysis. In other experiments, PDK-1 activity was measured with a PDK-1 assay kit (Upstate Biotechnology) according to the manufacturer's recommendations. The immunoprecipitates were prepared as described above, and after washing, the immunobeads were incubated with PDK-1 assay dilution buffer containing inactive SGK1 (serum- and glucocorticoid-regulated protein kinase-1) for 30 min at 30 °C. Then an Akt/SGK substrate peptide and 5 μCi of [γ-32P]ATP was added, and a second kinase reaction was allowed to continue for an additional 10 min at 30 °C. The reactions were spotted on P81 phosphocellulose paper and washed four times with 1% phosphoric acid followed by an acetone rinse. The amount of radioactivity incorporated into the substrate was determined by scintillation counting.
Western Blotting Analysis—MC lysates were prepared as described above for the PDK-1 activity assay. For immunoblotting, proteins were separated using SDS-PAGE and transferred to polyvinylidene difluoride membranes. The membranes were blocked with 5% low fat milk in Tris-buffered saline and then incubated with a rabbit polyclonal Nox4 antibody (catalog number ab41886; Abcam) (dilution 1:500), a rabbit polyclonal anti-phospho-PDK-1 (Tyr9) (catalog number PP1431; ECM Biosciences) (1:1,000), a rabbit polyclonal anti-phospho-PDK-1 (Tyr373/376) (catalog number 1901-1; Epitomics Inc.) (1:1,000), a rabbit anti-phospho-Src (Tyr416) antibody or a rabbit polyclonal anti-Src (catalog numbers 2101 and 2108; Cell Signaling Technology Inc.) (1:1,000), a rabbit polyclonal anti-p70S6K (catalog number 9202; Cell Signaling Technology Inc.) (1:1,000), a rabbit polyclonal anti-Pyk-2 (catalog number 07-437; Upstate/Millipore) (1:500), a rabbit polyclonal anti-fibronectin antibody (catalog number F3648; Sigma) (1:2,500), or a mouse monoclonal anti-β-actin (1:4,000) (catalog number A2066; Sigma). The appropriate horseradish peroxidase-conjugated secondary antibodies were added, and bands were visualized by enhanced chemiluminescence. Densitometric analysis was performed using NIH Image software.
For the detection of PDK-1 total tyrosine phosphorylation, MCs lysates were subjected to immunoprecipitation with anti-PDK1 antibody, and blots were incubated with mouse monoclonal antiphosphotyrosine antibody clone 4G10 (Upstate Biotechnology) or rabbit anti-PDK-1 (Cell Signaling Technology) (1:1,000).
Immunofluorescence Confocal Microscopy—MCs grown on 4-well chamber slides were fixed with 4% paraformaldehyde for 15 min and permeabilized with 0.2% Triton X-100 for 5 min. The cells were then blocked with 5% normal goat serum or 5% normal donkey serum in phosphate-buffered saline for 30 min and incubated with appropriate primary antibodies (anti-phospho-Src or anti-fibronectin) for 30 min. Cyanin-3- or fluorescein isothiocyanate-conjugated secondary antibodies were then applied to the appropriate cells for 30 min. The cells were washed 3 times with phosphate-buffered saline, mounted with antifade reagent with 4′,6-diamidino-2-phenylindole, and visualized on an Olympus FV-500 confocal laser scanning microscope. As requested by the reviewer, to estimate the brightness intensity of phospho-Src and fibronectin signals, groups of cells randomly selected from the digital image were outlined (at least five groups for each sample), and the average brightness of the enclosed area was semiquantified using either the Image-Pro Plus 4.5 software (Media Cybernetics) or NIH Image/ImageJ software, as described (23). The data shown represent three separate experiments and are expressed as relative fluorescence intensity.
Detection of Intracellular ROS—The peroxide-sensitive fluorescent probe 2′,7′-dichlorodihydrofluorescin diacetate (Invitrogen/Molecular Probes) was used to assess the generation of intracellular ROS, as described previously (23, 41). This compound is converted by intracellular esterases to 2′,7′-dichlorodihydrofluorescin, which is then oxidized by hydrogen peroxide to the highly fluorescent 2′,7′-dichlorodihydrofluorescein (DCF). Differential interference contrast images were obtained simultaneously using an Olympus inverted microscope with ×40 Aplanfluo objective and an Olympus Fluoview confocal laser-scanning attachment. The DCF fluorescence was measured with an excitation wavelength of 488-nm light, and its emission was detected using a 510-550-nm bandpass filter. Semiquantification of DCF fluorescence was performed as described above. Alternatively, cells were grown in 12- or 24-well plates and serum-deprived for 48 h. Immediately before the experiments, cells were washed with Hank's balanced salt solution and loaded with 50 μm 2′,7′-dichlorodihydrofluorescin diacetate dissolved in Hanks' balanced salt solution for 30 min at 37 °C. They were then incubated with the selected agonist or vehicle for various time periods. Subsequently, DCF fluorescence was detected at excitation and emission wavelengths of 488 and 520 nm, respectively, and measured with a multiwell fluorescence plate reader (Wallac 1420 Victor2; PerkinElmer Life Sciences), as described (42, 46).
Protein Synthesis—[3H]Leucine incorporation into trichloroacetic acid-insoluble material was used to assess protein synthesis, as described (23, 24, 41).
Statistical Analysis—Results are expressed as mean ± S.E. Statistical significance was assessed by Student's unpaired t test. Significance was determined as probability (p) less than 0.05.
RESULTS
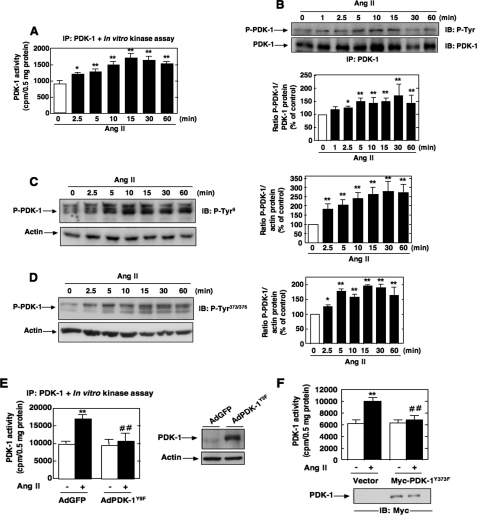
Ang II Induces PDK-1 Tyrosine Phosphorylation and Kinase Activity—We have recently shown that Akt/PKB is required for Ang II-induced cell hypertrophy and fibronectin expression in MCs (41, 46). There have been only few reports examining the role of PDK-1, the upstream activator of Akt/PKB, in Ang II signaling. None have explored the potential involvement of PDK-1 in hypertrophy and fibrosis induced by Ang II. To investigate the effect of Ang II on the activity of PDK-1, cultured MCs were incubated with 1 μm Ang II for different periods of time. PDK-1 activity was examined using an immune complex kinase assay in an in vitro two-step kinase reaction, where immunoprecipitated PDK-1 is first incubated with inactive SGK1 as a substrate and then with a peptide fragment of a SGK substrate. As shown in Fig. 1A, Ang II caused a rapid increase of PDK-1 kinase activity in a time-dependent manner, an effect that started at 2.5 min and peaked at 10-15 min (∼1.65-1.8-fold increase over control), remaining above the base line for at least 60 min. There is recent evidence that PDK-1 can be phosphorylated on tyrosine residues, particularly on tyrosines 9, 373, and 376, leading to an increase in activity (28, 30, 32, 33, 35-37). PDK-1 tyrosine phosphorylation was tracked by immunoprecipitating PDK-1, followed by Western blotting with anti-phosphotyrosine antibodies or by an immunologic approach with anti-PDK-1-phosphotyrosine 9 or 373/376 phosphorylation site-specific antibodies. We found that Ang II increased PDK-1 tyrosine phosphorylation at 2.5 min and that this response is sustained for at least another 60 min of agonist stimulation (Fig. 1, B-D). Note the striking parallel existing between the time courses of Ang II-induced PDK-1 kinase activity and Ang II-induced tyrosine phosphorylation. These data indicate that the increase in PDK-1 activity is accompanied by an increase in tyrosine phosphorylation of PDK-1 and is more likely a reflection of PDK-1 activation. In order to assess the relationship between PDK-1 tyrosine phosphorylation and PDK-1 activation, we tested the effect of site-specific PDK-1 mutants in which individual tyrosines were replaced with phenylalanine (Y373F PDK-1 and Y9F PDK-1) on Ang II-induced PDK-1 activation. The data indicate that infection of MCs with adenovirus encoding PDK-1 mutated at tyrosine 9 (AdPDK-1Y9F) or transfection with a Myc-tagged expression construct with PDK-1 mutated at tyrosine 373 (Myc-PDK-1Y373F) significantly inhibited the ability of Ang II to enhance PDK-1 kinase activity (Fig. 1, E and F). These findings demonstrate that activation of PDK-1 is dependent on phosphorylation of tyrosine 9 and 373/376. Adenovirus encoding green fluorescent protein lacking an insert (AdGFP) or an empty vector was used as control.
FIGURE 1.
Effects of Ang II on PDK-1 kinase activity and tyrosine phosphorylation in MCs. Serum-deprived MCs were stimulated with 1 μm Ang II for the indicated time periods. A, equivalent amounts of protein were immunoprecipitated (IP) with anti-PDK-1 antibody and assayed for PDK-1 activity in an in vitro two-step kinase assay using inactive SGK1 and SGK1 substrate peptide as described under “Experimental Procedures.” Data are expressed as cpm/protein concentration. Values are the means ± S.E. from three independent experiments. *, p < 0.05; **, p < 0.01 versus control. B, immunoprecipitates were prepared as described in A, and PDK-1 total tyrosine phosphorylation was analyzed by Western blot (IB) using anti-phosphotyrosine antibodies. C and D, MCs were treated with Ang II (1 μm) for the time periods indicated, and PDK-1 tyrosine phosphorylation was assessed by direct immunoblotting using anti-phospho-specific antibodies recognizing phosphorylated tyrosine 9 (P-Tyr9) or tyrosine 373/376 (P-Tyr373/376). E, MCs were infected with adenovirus encoding PDK-1 mutated at tyrosine 9 (AdPDK-1Y9F) or a green fluorescent protein vector control lacking an insert (AdGFP) and treated with Ang II (10 min), and PDK-1 immunoprecipitates were assayed for PDK-1 activity as described in A. The right panel shows expression of PDK-1 from the adenovirus vector. Actin was used as a loading control. F, MCs were transfected by electroporation with the Myc-tagged expression vector encoding PDK-1 mutated at tyrosine 373 (Myc-PDK-1Y373F) or an empty vector, treated with Ang II (10 min), and PDK-1 activity was assessed in PDK-1 immunoprecipitates as in A. Immunoblotting of lysates with anti-Myc antibody shows the expression of Myc-tagged PDK-1 proteins (bottom). In B-D, the top panels are representative immunoblots of Ang II-induced tyrosine phosphorylation of PDK-1. Each histogram at the bottom represents the ratio of the intensity of tyrosine-phosphorylated PDK-1 bands quantified by densitometry factored by the densitometric measurement of total PDK-1 or actin band. The data are expressed as percentage of control (GFP- or vector-transfected cells without Ang II), where the ratio in the control was defined as 100%. Values are the means ± S.E. from three independent experiments. *, p < 0.05; **, p < 0.01 versus control. In E and F, values are the means ± S.E. from three independent experiments. **, p < 0.01 versus control; ##, p < 0.01 versus Ang II in GFP- or vector-transfected cells.
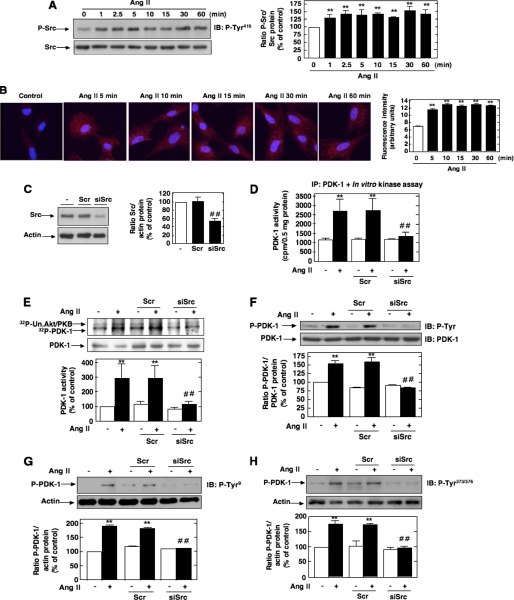
Involvement of Src in Ang II-induced PDK-1 Tyrosine Phosphorylation and Activation—It has been previously documented that the tyrosine phosphorylation of PDK-1 could be linked to the nonreceptor protein-tyrosine kinase Src that has been implicated in the PDK-1 tyrosine 9 and tyrosine 373/376 phosphorylation pathway (28, 32, 35). To test this hypothesis, we first evaluated whether Ang II activates Src. Src activation was assessed by measuring its phosphorylation on tyrosine 416. Indeed, it is known that tyrosine phosphorylation of the autophosphorylation site (tyrosine 416) and Src homology 2 domain of Src reflects its activation. As shown in Fig. 2A, stimulation with Ang II results in activation of Src tyrosine kinase in a time-dependent manner, an effect that occurred as early as 1 min and peaked at 5 min and remained sustained up to 30-60 min. The Western blot analysis was confirmed by immunofluorescence studies (Fig. 2B). Next, we investigated whether Src is positioned upstream of PDK-1 tyrosine phosphorylation and subsequent activation. The cells were transfected with siRNA for Src. Fig. 2C shows that the transfection of siRNA for Src (siSrc) but not nontargeting siRNA (Scr) effectively down-regulates Src protein expression. Ang II-induced PDK-1 kinase activity was significantly inhibited in MCs transfected with siSrc (Fig. 2, D and E). To assess the protein kinase activity of PDK-1, cell lysates were immunoprecipitated using an antibody to PDK-1, and activity in the immunoprecipitates was measured by an immune complex kinase assay using either the in vitro two-step kinase reaction described above (Fig. 2D) or unactivated Akt/PKB as substrate (Fig. 2E). Importantly, siSrc also blocked the stimulatory effect of Ang II on PDK-1 tyrosine phosphorylation (total, on tyrosine 9, and on tyrosine 373/376) (Fig. 2, F-H). In contrast, nontargeting siRNA (Scr) did not alter the actions of Ang II. Taken together, these data demonstrate that Src mediates Ang II-stimulated PDK-1 tyrosine phosphorylation and activation in MCs.
FIGURE 2.
Role of Src in Ang II-induced PDK-1 tyrosine phosphorylation and activation. A, serum-deprived MCs were treated with 1 μm Ang II for the time periods indicated, and Src phosphorylation was assessed using anti-phospho-specific antibodies recognizing phosphorylated tyrosine 416 (P-Tyr416), an indicator of its activation. Right, histogram representing the ratio of the intensity of tyrosine-phosphorylated Src bands quantified by densitometry factored by the densitometric measurement of total Src bands. The data are expressed as percentage of control where the ratio in the control was defined as 100%. Values are the means ± S.E. from three independent experiments. **, p < 0.01 versus control. B, MCs grown on coverslips were treated with Ang II (1 μm) for the indicated time and fluorescently stained for Src phosphorylated on tyrosine 416 and imaged with a confocal laser-scanning fluorescence microscope. The photomicrographs are representative of three individual experiments. Right, fluorescence intensity was semiquantified as described under “Experimental Procedures.” Values are the means ± S.E. from three independent experiments. **, p < 0.01 versus control. C, MCs were untransfected (-) and transfected with nontargeting siRNA (Scr) or with siSrc, and Src protein expression was determined by Western blot analysis. Right, histogram representing the ratio of the intensity of Src bands quantified by densitometry factored by the densitometric measurement of actin bands. The data are expressed as percentage of control (untransfected cells), where the ratio in the control was defined as 100%. Values are the means ± S.E. from three independent experiments. ##, p < 0.01 versus untransfected cells. D-H, cells were untransfected, transfected with nontargeting Scr or with siSrc, and stimulated with Ang II (1 μm) for 10 min. D, cell lysates were immunoprecipitated (IP) with anti-PDK-1 antibodies. Kinase activity was measured and expressed as described in the legend to Fig. 1A. E, cell lysates were immunoprecipitated with anti-PDK-1 antibodies, and kinase activity was determined by measuring [γ-32P]ATP-labeled phosphorylation of the substrate unactivated Akt/PKB (Un. Akt/PKB), as described under “Experimental Procedures” (note that PDK-1 autophosphorylation is also detected). The histogram represents the ratio of the radioactivity incorporated into the substrate quantified by PhosphorImager analysis factored by the densitometric measurement of PDK-1 band. The data are expressed as percentage of control, where the ratio in the untreated cells was defined as 100%. F, cell lysates were immunoprecipitated with anti-PDK-1 antibodies, and PDK-1 tyrosine phosphorylation was determined as in Fig. 1B. G and H, PDK-1 phosphorylation on tyrosine 9 (P-Tyr9) and 373/376 (P-Tyr373/376) was determined by direct immunoblotting (IB) of cell lysates. F-H, the top panels are representative immunoblots, and the histograms represent the ratio of the intensity of tyrosine phosphorylated PDK-1 bands quantified by densitometry factored by the densitometric measurement of total PDK-1 or actin bands. The data are expressed as percentage of control (untransfected cells without Ang II), where the ratio in the control was defined as 100%. Values are the means ± S.E. from three independent experiments. **, p < 0.01 versus control; ##, p < 0.01 versus untransfected cells treated with Ang II.
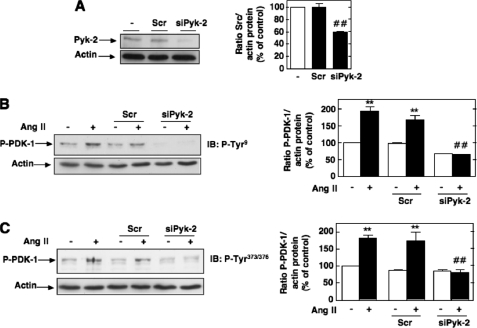
A crucial role for the proline-rich tyrosine kinase-2 (Pyk-2) in phosphorylation of tyrosine residues 9, 373, and 376 of PDK-1 and its interaction with Src has been described (28). Pyk-2/Src/PDK-1 form a complex with Pyk-2 as a scaffold, allowing Src to phosphorylate and activate PDK-1 (28). Down-regulation of Pyk-2 with specific siRNAs (siPyk-2) significantly reduced Ang II-induced PDK-1 phosphorylation on tyrosine 9 and 373/376 (Fig. 3). Nontargeting siRNA (Scr) had no effect. Our data demonstrate that Pyk-2 and PDK-1 are in the same axis of signal transduction and suggest that Pyk-2 plays a role in Src-dependent PDK-1 tyrosine phosphorylation.
FIGURE 3.
Role of Pyk-2 in Ang II-induced PDK-1 tyrosine phosphorylation. A, MCs were untransfected or transfected with nontargeting siRNA (Scr) or with siRNA for Pyk-2 (siPyk-2), and Pyk-2 protein expression was determined by Western blot analysis. Right, histogram representing the ratio of the intensity of Pyk-2 bands quantified by densitometry factored by the densitometric measurement of actin bands. The data are expressed as percentage of control (untransfected cells), where the ratio in the control was defined as 100%. Values are the means ± S.E. from three independent experiments. ##, p < 0.01 versus untransfected cells. B and C, cells were untransfected, transfected with nontargeting Scr or with siPyk-2, and stimulated with 1 μm Ang II for 10 min. PDK-1 phosphorylation on tyrosine 9 (P-Tyr9) and 373/376 (P-Tyr373/376) was determined by direct immunoblotting (IB) of cell lysates. The left panels are representative immunoblots, and the histograms represent the ratio of the intensity of tyrosine-phosphorylated PDK-1 bands quantified by densitometry factored by the densitometric measurement of total PDK-1 or actin bands. The data are expressed as percentage of control (untransfected cells without Ang II), where the ratio in the control was defined as 100%. Values are the means ± S.E. from three independent experiments. **, p < 0.01 versus control; ##, p < 0.01 versus untransfected cells treated with Ang II.
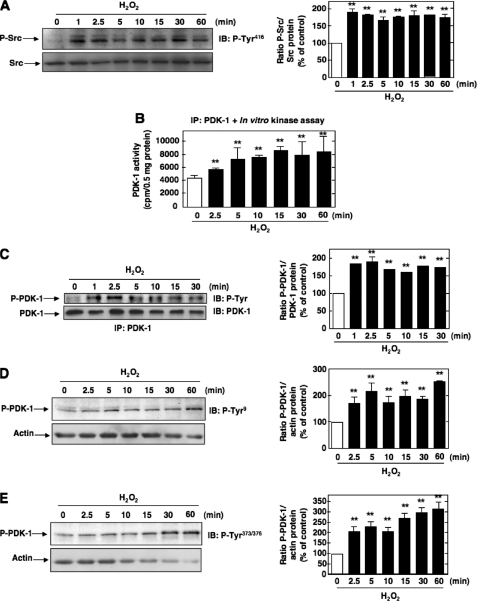
Effect of Exogenous Hydrogen Peroxide on Src and PDK-1 Activation in MCs—We next sought to identify the upstream mediators implicated in Src-dependent activation of PDK-1 in response to Ang II. Src has been shown to be activated by G-protein-coupled receptors, including Ang II receptors, in a ROS-dependent manner (48-50). Furthermore, it has been proposed that ROS can directly target Src via an oxidative modification of specific cysteine residues, leading to activation of the tyrosine kinase (43, 51). Therefore, ROS are potential proximal mediators of Ang II-induced Src and PDK-1 activation. The redox sensitivity of Src and PDK-1 was studied using hydrogen peroxide (H2O2) as a model oxidant. The concentration used (200 μm) is similar to those previously reported for H2O2-induced activation of a known redox-sensitive kinase in MCs, Akt/PKB. As seen in Fig. 4, A-E, exogenously applied H2O2 induced Src tyrosine 416 phosphorylation (an indicator of its activation), PDK-1 kinase activity, and tyrosine phosphorylation (total and on residues 9 or 373/376) with time courses similar to those obtained with Ang II. PDK-1 kinase activity was assessed as described above. This confirms that Src and PDK-1 are potential target of oxidants in MCs and suggests that ROS may play a role in the effects of Ang II on these kinases. Studies using exogenously added H2O2 should be interpreted with caution. Therefore, the next experiments focused on exploring the role of endogenous ROS and identifying the source of ROS generation to study their role in Src-dependent activation of PDK-1.
FIGURE 4.
Effects of hydrogen peroxide on Src and PDK-1 tyrosine phosphorylation and activation. A, serum-deprived MCs were treated with 200 μm hydrogen peroxide (H2O2) for the time periods indicated, and Src phosphorylation on tyrosine 416 was assessed. The data were expressed as in Fig. 2A. B, time course of PDK-1 activation by H2O2. PDK-1 kinase activity was assessed and expressed as in Fig. 1A. C-E, time course of PDK-1 tyrosine phosphorylation by H2O2. C, total tyrosine phosphorylation of PDK-1 was determined and expressed as in Fig. 1B. D and E, phosphorylation on tyrosine 9 (P-Tyr9) or tyrosine 373/376 (P-Tyr373/376) was determined as described in the legend to Fig. 1. A and C-E, histograms represent the ratio of the intensity of P-Src or P-PDK-1 bands quantified by densitometry factored by the densitometric measurement of Src, PDK-1, or actin bands. The data are expressed as percentage of control, where the ratio in the control was defined as 100%. In each panel, values are the means ± S.E. from three independent experiments. **, p < 0.01 versus control. IB, immunoblot; IP, immunoprecipitation.
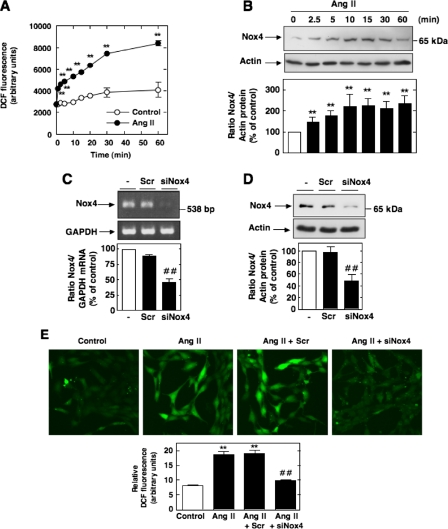
The Up-regulation of Nox4 Mediates Ang II-induced ROS Generation in MCs—Since NAD(P)H oxidase Nox4 is highly expressed and plays a role in Ang II redox signaling in MCs (21, 23, 24), we hypothesized that Nox4-derived ROS are required for Src/PDK-1 pathway activation. We first examined the temporal effects of Ang II on ROS generation and Nox4 protein expression. Ang II elicited a rapid and sustained time-dependent increase in DCF fluorescence, a peroxide-sensitive fluorophore that detects intracellular ROS (Fig. 5A). Quantification of DCF fluorescence was performed with a multiwell fluorescence plate reader. These experiments also showed that after stimulation with Ang II, Nox4 protein expression increased within 2.5 min with a maximum up-regulation of Nox4 occurring at 10-15 min and maintained up to 60 min. Importantly, the time course of ROS generation by Ang II correlated well with the kinetics of Nox4 protein expression by Ang II with significant increase seen as early as 2.5 min after treatment (Fig. 5, compare A and B). Note that induction of Nox4 expression slightly preceded the release of ROS by Ang II. These observations are consistent with the contention that Nox4 contributes to ROS generation in response to Ang II. Identification of Nox4 protein was performed by Western blot analysis using a commercially available rabbit polyclonal antibody. This antibody detected a 65 kDa band that corresponded to the predicted molecular weight of the oxidase and was inhibited by depleting MCs of Nox4 using siRNA (Fig. 5D). These observations were confirmed using an anti-Nox4 antibody that we have generated in our laboratory (23, 46) (see supplemental Fig. S1). Interestingly, there was no change in Nox4 mRNA levels in cells treated with Ang II for the same time period.
FIGURE 5.
Nox4 is up-regulated by Ang II and mediates Ang II-induced ROS production in MCs. A, serum-starved MCs were stimulated with 1 μm Ang II for the indicated time periods, and intracellular ROS generation was measured using the peroxide-sensitive probe DCF with a multiwell fluorescence plate reader as described under “Experimental Procedures.” Values are the means ± S.E. of three independent experiments. **, p < 0.001 versus control. B, serum-starved MCs were treated for the indicated time with Ang II (1 μm), and Nox4 protein expression was evaluated by Western blot analysis. The histogram at the bottom represents the ratio of the intensity of Nox4 bands quantified by densitometry factored by the densitometric measurement of actin band. The data are expressed as percentage of control, where the ratio in the control was defined as 100%. Values are the means ± S.E. from three independent experiments. **, p < 0.01 versus control. C and D, MCs were untransfected (-) or transfected with nontargeting siRNA (Scr) or siRNA for Nox4 (siNox4). Nox4 mRNA or protein knockdown with siNox4, but not Scr, was confirmed by RT-PCR or Western blot analysis. Bottom, histograms representing the ratio of the intensity of Nox4 bands quantified by densitometry factored by the densitometric measurement of glyceraldehyde-3-phosphate dehydrogenase (GAPDH) or actin bands. The data are expressed as percentage of control, where the ratio in the control was defined as 100%. Values are the means ± S.E. from three independent experiments. ##, p < 0.01 versus untransfected cells. E, top, representative photomicrographs of DCF fluorescence imaged with a confocal laser-scanning fluorescence microscope in MCs after exposure or no exposure to Ang II for 10 min with or without Scr and siNox4. Bottom, relative DCF fluorescence (arbitrary units) was semiquantified. Values are the means ± S.E. from three independent experiments. **, p < 0.01 versus control (no Ang II); ##, p < 0.01 versus Ang II in untransfected cells.
In order to establish that Nox4 is necessary for Ang II-induced ROS production, Nox4 expression was down-regulated with specific siRNA. First, we confirmed that transfection of siRNA for Nox4 (siNox4), but not nontargeting siRNA (Scr), reduces Nox4 mRNA (Fig. 5C) and protein abundance (Fig. 5D and supplemental Fig. S1). Note that for every RNA interference experiment described in this report, the siRNAs transfected obtained from Dharmacon corresponded to a SMARTpool consisting of four siRNA specific for the protein of interest. Importantly, siNox4 abolished the increase in DCF fluorescence caused by Ang II (Fig. 5E). In these experiments, DCF fluorescence was measured using laser-scanning confocal microscopy. These findings indicate that Nox4 is responsible for the increased generation of ROS in response to Ang II and that this increase is most likely due to an acute up-regulation of Nox4 protein expression.
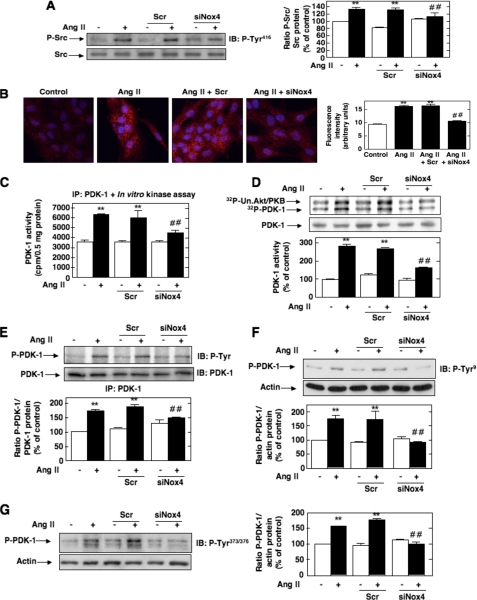
Nox4 Is Required for Ang II-induced Src and PDK-1 Tyrosine Phosphorylation and Activation in MCs—Down-regulation of Nox4 protein by siNox4 almost totally inhibits Ang II-induced activation of Src assessed by its phosphorylation on tyrosine 416 by Western blotting and immunofluorescence analyses (Fig. 6, A and B). Transfection of MCs with siNox4 also dramatically reduced the stimulatory effect of Ang II on PDK-1 kinase activity (Fig. 6, C and D) and tyrosine phosphorylation (total, on residue 9, and on residue 373/376) (Fig. 6, E, F and G). In contrast, nontargeting siRNA (Scr) did not influence the effects of Ang II on Src and PDK-1. It was predictable that Nox4 controls both PDK-1 tyrosine phosphorylation and activation, since the data shown in Fig. 1E indicated that the induction of PDK-1 activity by Ang II is dependent on tyrosine 9 and tyrosine 373/376 phosphorylation. These results demonstrate that Nox4-derived ROS are critical for activation of Src as well as tyrosine phosphorylation and activation of PDK-1 in response to Ang II in MCs. To validate the presence of a linear pathway of Nox4, Src activation, and PDK-1 tyrosine phosphorylation/activation, we used the phosphotyrosine mutants of PDK-1. Infection with AdPDK-1Y9F or transfection with Myc-PDK-1Y373F did not alter Ang II-induced ROS generation or Src activation, indicating that phosphorylation on tyrosine 9 and 373/3736 is not required for these events (data not shown). This clearly implicates Nox4 and Src as upstream mediators of PDK-1 tyrosine phosphorylation and activation.
FIGURE 6.
Role of Nox4 in Ang II-induced Src and PDK-1 tyrosine phosphorylation and activation. A-G, cells were untransfected, transfected with nontargeting siRNA (Scr) or siNox4, and stimulated with Ang II (1 μm) for 10 min. A and B, Src phosphorylation on tyrosine 416 (P-Tyr416) was detected by Western blot analysis or immunofluorescence, respectively. B, the right panel represents the semiquantification of the fluorescence intensity. C and D, PDK-1 kinase activity was determined as described in the legends to Figs. 1A and 2E, respectively. E, PDK-1 total tyrosine phosphorylation was assessed as described in the legend to Fig. 1B. F and G, PDK-1 phosphorylation on tyrosine 9 (P-Tyr9) or tyrosine 373/376 (P-Tyr373/376) was detected by direct immunoblotting. In A and D-G, the histograms represent the ratio of the intensity of tyrosine-phosphorylated PDK-1 bands quantified by densitometry factored by the densitometric measurement of total Src, PDK-1, or actin bands. The data are expressed as percentage of control (untransfected cells without Ang II), where the ratio in the control was defined as 100%. In each panel, values are the means ± S.E. from three independent experiments. **, p < 0.01 versus control; ##, p < 0.01 versus untransfected cells treated with Ang II. IB, immunoblot; IP, immunoprecipitation.
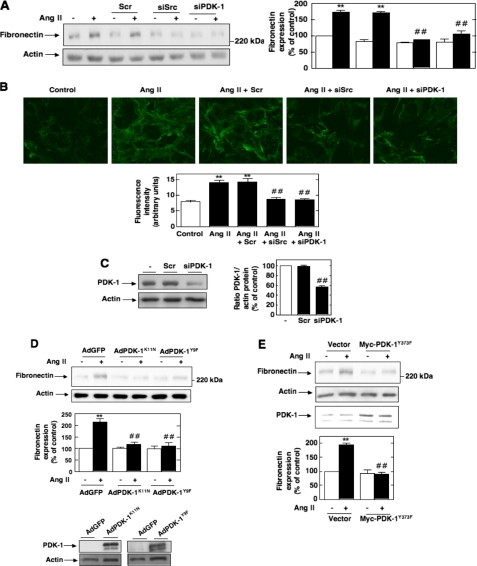
Nox4-derived ROS, Src, and PDK-1 Are Required for the Expression of Fibronectin in Response to Ang II—Using MCs as a model to study the mechanism of abnormal matrix accumulation by kidney cells, we have recently shown that Ang II induced chronic fibronectin expression through a redox-dependent pathway (42). In order to establish the link between the various signal transducers identified above and the fibrotic response of MCs to Ang II, we examined the effect of siSrc or siPDK-1 on Ang II-mediated fibronectin protein expression by Western blot and immunofluorescence analyses. Transfection of MCs with siSrc or siPDK-1, but not nontargeting siRNA, prevented the increase in fibronectin synthesis and deposition stimulated by prolonged exposure of MCs to Ang II (Fig. 7, A and B). Fig. 6C confirmed the reduction in PDK-1 protein expression by siPDK-1, but not nontargeting siRNA (Scr). To confirm that the inhibition by siPDK-1 is due to compromised kinase activity, we showed that infection of MCs with an adenovirus encoding a kinase-inactive form of PDK-1, AdPDK-1K11N, significantly reduced Ang II-induced fibronectin expression (Fig. 7D). Since PDK-1 activation is associated with its phosphorylation on tyrosines 9, 373, and 376, we also tested the role of these events in Ang II-induced fibronectin synthesis by expressing in MCs the site-specific PDK-1 mutants AdPDK-1Y9F or Myc-PDK-1Y373F. As shown in Fig. 7, D and E, expression in the cells of PDK-1 mutated at tyrosine 9 or mutated at tyrosine 373 reduced Ang II-induced fibronectin expression, indicating that the tyrosine phosphorylation of PDK-1 is crucial for extracellular matrix protein synthesis in response to Ang II. Adenovirus encoding green fluorescent protein lacking an insert (AdGFP) or an empty vector was used as control.
FIGURE 7.
Roles of Src and PDK-1 tyrosine phosphorylation and activation in Ang II-induced fibronectin expression in MCs. A and B, MCs were untransfected; transfected with nontargeting siRNA (Scr), siSrc, or siPDK-1; and exposed or not to Ang II (1 μm) for 24 h. A, fibronectin protein expression was determined by direct immunoblotting of cell lysates. B, MCs grown on coverslips were fluorescently stained for fibronectin and imaged with a confocal laser-scanning fluorescence microscope. The photomicrographs are representative of three individual experiments. Bottom, semiquantification of fluorescence intensity. C, PDK-1 knockdown with siPDK-1, but not Scr, was confirmed by Western blot analysis. Right, histogram representing the ratio of the intensity of PDK-1 bands quantified by densitometry factored by the densitometric measurement of actin bands. The data are expressed as percentage of control (untransfected cells), where the ratio in the control was defined as 100%. Values are the means ± S.E. from three independent experiments. ##, p < 0.01 versus untransfected cells. D, after infection with adenovirus encoding kinase-inactive PDK-1 (AdPDK-1K11N), AdPDK-1Y9F, or AdGFP, fibronectin protein expression in response to Ang II (1 μm, 24 h) was evaluated by Western blot analysis. The bottom panel shows expression of PDK-1 from the adenovirus vectors. Actin was used as a loading control. E, MCs were transfected by electroporation with Myc-PDK-1Y373F, exposed to 1 μm Ang II for 24 h, lysed, and immunoblotted with fibronectin antibody. Actin was used as a loading control. A, D, and E, the histograms represent the ratio of the intensity of fibronectin bands quantified by densitometry factored by the densitometric measurement of the actin band. The data are expressed as percentage of control (untransfected or GFP- or vector-transfected cells without Ang II), where the ratio in the control was defined as 100%. Values are the means ± S.E. from three independent experiments. **, p < 0.01 versus control; ##, p < 0.01 versus untransfected or GFP- or vector-transfected cells treated with Ang II.
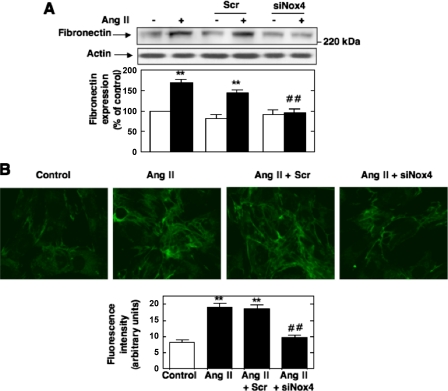
Although there is evidence that in MCs Ang II stimulates synthesis of the extracellular matrix protein fibronectin through activation of a p22phox-containing NAD(P)H oxidase (42), the nature of the catalytic subunit involved in this response remains unknown. To assess the role of Nox4 in fibronectin synthesis, we tested the consequence of the oxidase depletion by siNox4 on Ang II-induced fibronectin protein expression and deposition by Western blot analysis and immunofluorescence. As shown in Fig. 8, A and B, siNox4, but not nontargeting siRNA (Scr), significantly reduced the stimulation of fibronectin synthesis and deposition by Ang II.
FIGURE 8.
Role of Nox4 in Ang II-induced fibronectin expression in MCs. A and B, MCs were untransfected, transfected with nontargeting 100 nm Scr or siNox4, and exposed or not to Ang II (1 μm) for 24 h. A, fibronectin protein expression was determined by direct immunoblotting of cell lysates. Bottom, the histogram represents the ratio of the intensity of fibronectin bands quantified by densitometry factored by the densitometric measurement of actin band. The data are expressed as percentage of control (untransfected cells without Ang II), where the ratio in the control was defined as 100%. B, MCs grown on coverslips were fluorescently stained for fibronectin and imaged with a confocal laser-scanning fluorescence microscope. The photomicrographs are representative of three individual experiments. Bottom, semiquantification of fluorescence intensity. In each panel, values are the means ± S.E. from three independent experiments. **, p < 0.01 versus control (no Ang II); ##, p < 0.01 versus untransfected cells treated with Ang II.
Finally, in order to further explore the functional link between ROS generation by Ang II and subsequent stimulation of Src/PDK-1-mediated fibronectin synthesis, we used a redox-insensitive mutant of Src. It has been reported that Src tyrosine kinase undergoes activation via oxidation of cysteine 245 located in the kinase domain (43). The mutant C487A in which the cysteine 487 was replaced by an alanine residue (SrcC487A) is known to behave as an oxidation-resistant mutant of the kinase (43). Ang II-induced fibronectin accumulation is significantly reduced in cells transfected with SrcC487A (Fig. 9), but not vector control, indicating a critical role for direct Src oxidation in the fibrotic pathway engaged by Ang II. These data support a role for Nox4, Src, and PDK-1 in the redox signaling cascade triggered by Ang II and leading to extracellular matrix protein production in MCs.
FIGURE 9.
Role of Src oxidation by ROS in Ang II-induced fibronectin expression. MCs were transfected by electroporation with a cysteine to alanine oxidation-resistant mutant of Src (SrcC487A) and exposed to 1 μm Ang II for 24 h. Fibronectin protein expression was determined by direct immunoblotting of cell lysates. The immunoblot at the bottom shows increased expression of Src protein in SrcC487A-transfected cells as compared with vector-transfected cells. Right panel, the histogram represents the ratio of the intensity of fibronectin bands quantified by densitometry factored by the densitometric measurement of the actin band. The data are expressed as percentage of control (untransfected cells without Ang II), where the ratio in the control was defined as 100%. Values are the means ± S.E. from three independent experiments. **, p < 0.01 versus control; ##, p < 0.01 versus untransfected cells treated with Ang II.
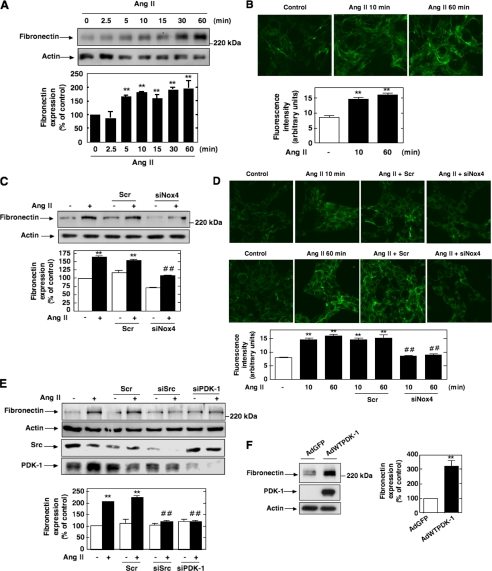
Acute Effects of Ang II on Fibronectin Synthesis and Deposition—It has been proposed that recurrent acute stimulation of extracellular matrix protein synthesis by renal cells participates in the significant expansion of matrix leading to fibrosis in kidney disease (52). This observation prompted us to investigate the effect of short term exposure of MCs to Ang II on the fibronectin synthesis and deposition. Western blot analysis showed that stimulation of MCs with Ang II resulted in a robust time-dependent increase in fibronectin synthesis, apparent 5-10 min after treatment and with maximal effect at 30-60 min (Fig. 10A). As illustrated Fig. 10B, immunofluorescence studies confirmed these acute effects of Ang II on fibronectin production and deposition in MCs. The comparison of the different time courses demonstrated that the effects of Ang II on Nox4-dependent ROS generation as well as Src and PDK-1 activation were more rapid (maximum at 5 min) than the effects of Ang II (maximum at 30 min) on fibronectin synthesis, consistent with the concept that the oxidase and the two protein kinases may also act as upstream mediators of the acute regulation of fibronectin synthesis by Ang II. We found that depletion of Nox4, Src, or PDK-1 protein by specific siRNA significantly inhibited Ang II-induced acute increase in fibronectin synthesis as measured by Western blotting and immunofluorescence (Fig. 10, C-E). In additional experiments, we introduced in MCs an active form of PDK-1 using an adenovirus encoding for wild type PDK-1 (AdWTPDK-1) (28). The data show that basal fibronectin protein expression was increased in MCs infected by AdWTPDK-1 (Fig. 10F), indicating a role for PDK-1 for the increase in fibronectin expression observed. Collectively, these data indicate that the Nox4/Src/PDK-1 signal transduction axis mediates both the acute and chronic actions of Ang II on fibronectin synthesis in MCs.
FIGURE 10.
Roles of Nox4, Src, and PDK-1 in the acute effect of Ang II on fibronectin expression and deposition. MCs were treated for the indicated times with Ang II (1 μm), and fibronectin protein expression was evaluated by Western blot analysis (A) or by immunofluorescence (B). C and D, MCs were untransfected, transfected with 100 nm nontargeting Scr or siNox4, and treated or not with Ang II (1 μm) for the indicated time periods (10 or 60 min). Fibronectin protein expression was evaluated by Western blot analysis (B) or by immunofluorescence (C). E, MCs were untransfected; transfected with nontargeting Scr, siSrc, or siPDK-1; and exposed or not to Ang II (1 μm for 10 or 60 min), and fibronectin expression was assessed by direct immunoblotting. The knockdown of Src and PDK-1 protein by their respective siRNA is shown in the middle panels. F, MCs were infected with AdGFP or virus expressing wild type PDK-1 (AdWTPDK-1), lysed, and immunoblotted with fibronectin antibody. Immunoblotting with PDK-1 antibody confirmed the overexpression of the kinase from the adenovirus vector. InA, C, E, and F, each histogram represents the ratio of the intensity of fibronectin bands quantified by densitometry factored by the densitometric measurement of actin band. The data are expressed as percentage of control (untransfected or GFP-transfected cells without Ang II), where the ratio in the control was defined as 100%. B and D, the photomicrographs are representative of three individual experiments. B and D, the photomicrographs are representative of three individual experiments, and the bottom panels represent the semiquantification of fluorescence intensity. For all panels, values are the means ± S.E. from three independent experiments. **, p < 0.01 versus control (untransfected or GFP-transfected cells without Ang II); ##, p < 0.01 versus untransfected cells treated with Ang II.
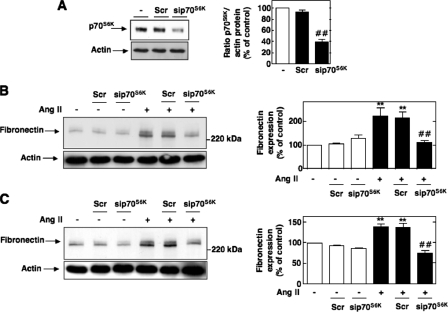
Downstream Effectors of PDK-1 Involved in Ang II-induced Fibronectin Synthesis—Since the primary function of PDK-1 is to phosphorylate and modulate the activity of other protein kinases, we next sought to define the potential downstream target of PDK-1. We have previously reported that the principal substrate of PDK-1, Akt/PKB, is required for Ang II-mediated fibronectin accumulation in MCs (42). We now investigated the role of p70S6K, another well known downstream substrate of PDK-1. Knockdown of p70S6K (Fig. 10A) inhibits the up-regulation of fibronectin expression induced by exposure to Ang II (Fig. 11, B and C). This strongly suggests that p70S6K is a potential downstream effector of PDK-1 in the pathway linking Ang II to fibronectin accumulation.
FIGURE 11.
Role of p70S6K in Ang II-induced fibronectin. A, MCs were untransfected or transfected with nontargeting Scr or with siRNA for p70S6K (sip70S6K), and p70S6K protein expression was determined by Western blot analysis. Right, histogram representing the ratio of the intensity of p70S6K bands quantified by densitometry factored by the densitometric measurement of actin bands. The data are expressed as percentage of control (untransfected cells), where the ratio in the control was defined as 100%. Values are the means ± S.E. from three independent experiments. ##, p < 0.01 versus untransfected cells. B and C, cells were untransfected or transfected with nontargeting Scr or with sip70S6K and stimulated with Ang II (1 μm) for 10 or 60 min, respectively. Fibronectin was determined by direct immunoblotting of cell lysates. The left panels are representative immunoblots, and the histograms represent the ratio of the intensity of tyrosine fibronectin bands quantified by densitometry factored by the densitometric measurement of actin bands. The data are expressed as percentage of control (untransfected cells without Ang II), where the ratio in the control was defined as 100%. Values are the means ± S.E. from three independent experiments. **, p < 0.01 versus control; ##, p < 0.01 versus untransfected cells treated with Ang II.
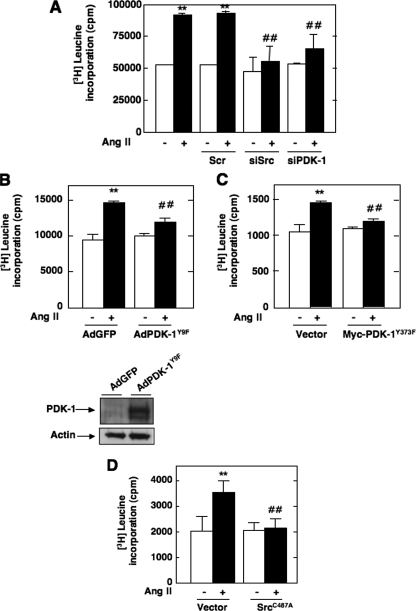
Src and PDK-1 Are Involved in Ang II-induced MC Hypertrophy—We have previously shown that generation of ROS by Nox4 contributes to MC hypertrophy in response to Ang II (21). The fact that Nox4 functions as an upstream regulator of Src and PDK-1 activation led us to explore whether these two protein kinases are part of the signaling cascade linking Ang II to MC hypertrophy. As shown in Fig. 12A, siRNA for Src or PDK-1 dramatically reduced Ang II-induced [3H]leucine incorporation, a measure of protein synthesis. Therefore, Src and PDK-1 appear to play an important role in Ang II-stimulated MC hypertrophy. Similar to the fibronectin expression, infection of MCs with AdPDK-1K11N and AdPDK-1Y9F or transfection with Myc-PDK-1Y373F expression construct significantly inhibited Ang II-induced protein synthesis (Fig. 12, B and C), revealing the important function played by PDK-1 tyrosine phosphorylation in the hypertrophic response to Ang II. Similar to its effect on fibronectin, the redox-insensitive mutant of Src inhibited Ang II-induced cell hypertrophy (Fig. 11D), indicating that redox-dependent regulation of Src may be required for the propagation of the hypertrophic signal.
FIGURE 12.
Roles of Src and PDK-1 tyrosine phosphorylation and activation in Ang II-induced hypertrophy. A, MCs transfected with Scr, siSrc, or siPDK-1 were used for measurement of [3H]leucine incorporation induced or not by Ang II (1 μm, 48 h). B, MCs were infected with AdPDK-1Y9F or AdGFP, and [3H]leucine incorporation in response to Ang II (1 μm) was measured at 48 h. C, MCs were transfected by electroporation with Myc-PDK-1Y373F or vector as control and treated with or without 1 μm Ang II for 48 h before [3H]leucine incorporation was assayed. D, MCs were transfected by electroporation with SrcC487A and exposed to 1 μm Ang II for 48 h before measuring [3H]leucine incorporation. Values are the means ± S.E. from three independent experiments. **, p < 0.01 versus control (untransfected cells without Ang II) and ##, p < 0.01 versus untransfected cells treated with Ang II.
DISCUSSION
Ang II contributes to the initiation and the progression of glomerular fibrosis via hypertrophy and extracellular matrix expansion in glomerular MCs (5-7). In this study, we demonstrate that in MCs Ang II triggers cell hypertrophy and fibronectin synthesis through activation of the serine-threonine protein kinase PDK-1. We show that phosphorylation of specific tyrosine residues (tyrosines 9, 373, and 376) is associated with stimulation of PDK-1 kinase activity and is required for the hypertrophic and fibrotic response of MCs to Ang II. We also describe a role for oxidation in tyrosine phosphorylation and activation of PDK-1 after Ang II stimulation. We provide the first evidence that ROS generated by Nox4 NAD(P)H oxidase are proximal to the Src-dependent PDK-1 activation in the pathway linking Ang II to MC hypertrophy and fibronectin synthesis.
We have previously reported that Akt/PKB is critical for Ang II-induced hypertrophy and fibronectin synthesis in MCs (21, 42). However, the role of an upstream activator, PDK-1, in Ang II-mediated MC injury has not yet been investigated. In the present study, we clearly establish that PDK-1 tyrosine phosphorylation on residues 9, 373, and 376 is required for the increase in its activity and promotes MC hypertrophy and fibronectin protein expression in response to Ang II. The identification of PDK-1 and its tyrosine phosphorylation as a critical mediator of Ang II effects was demonstrated using siRNA-mediated knockdown and constructs overexpressing kinase-inactive PDK-1 as well as PDK-1 mutated on tyrosine 9 or tyrosine 373. It is important to note that, aside from few recent reports (28, 55), data related to the regulation of PDK-1 by G-protein-coupled receptors and particularly via tyrosine phosphorylation are relatively scarce. Therefore, the present finding that PDK-1 phosphorylation on tyrosine 9 and tyrosine 373 is a prerequisite for the propagation of Ang II hypertrophic and fibrotic actions is novel. This new function of PDK-1 tyrosine phosphorylation can be added to its previously reported involvement in platelet-derived growth factor-induced migration in vascular smooth muscle cells, the regulation of glucose uptake by insulin and the formation of focal adhesions in response to Ang II (28, 37, 44).
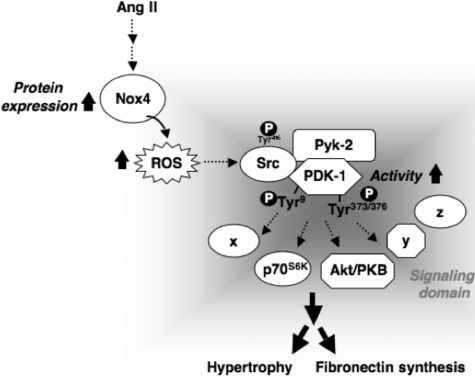
In this study, the observation that the increase in Ang II-mediated PDK-1 activation depends on tyrosine phosphorylation of PDK-1 is consistent with recent evidence that the intrinsic catalytic activity of PDK-1 is regulated through tyrosine phosphorylation (32-35). In particular, PDK-1 is known to be constitutively active and to be further activated by phosphorylation on tyrosine 9 and tyrosine 373/376 in response to various stimuli (28, 30, 32, 33, 35-37, 53). Importantly, PDK-1 tyrosine phosphorylation has been reported to be an ordered process where tyrosine 373/376 phosphorylation is dependent on tyrosine 9 phosphorylation (28, 32). This hierarchy in phosphorylation implies that the inhibition of Ang II-induced PDK-1 kinase activity observed with AdPDK-1Y9F mutant prevents phosphorylation on tyrosine 373/376. It is somewhat surprising that a rather modest increase in kinase activity exerts such influence on fibronectin. One possibility is that PDK-1 may play a role in Ang II signaling not only via changes in its activity but also by facilitating the spatial and temporal organization of signaling complexes, whose activation is critical for fibronectin accumulation. PDK-1 tyrosine phosphorylation may also contribute to the association of PDK-1 with its downstream effectors through the creation of binding sites. Such functions for PDK-1 tyrosine phosphorylation have been suggested by several published reports (28, 44, 45). In vascular smooth cells, where Ang II also causes a small increase in PDK-1 kinase activity, it appears that PDK-1 favors the formation of signaling complexes in specific domains of the cell such as focal adhesions. PDK-1 tyrosine phosphorylation, particularly on tyrosine 9, is critical for these events (28, 44, 45). Interestingly, PDK-1 has been also reported to bring key signaling molecules into proximity and nucleate receptor-induced signaling complex for downstream activation of NF-κB (54). In previously published work (42), we found that Akt/PKB is required for Ang II-mediated fibronectin expression. In this study, we now demonstrate that p70S6K is also required, supporting the idea that these kinases are potential downstream effectors of PDK-1 and part of a signaling complex assembled around PDK-1 in MCs (Fig. 13).
FIGURE 13.
Proposed molecular mechanisms of Ang II-induced hypertrophy and fibronectin synthesis in MCs. See “Discussion” for details.
Nonreceptor tyrosine kinase Src has been implicated in tyrosine phosphorylation of PDK-1 (28, 30, 32, 33, 35). PDK-1 phosphorylation on tyrosine 9 generates a consensus sequence for the SH2 domain of Src, leading to the recruitment of Src and Src-dependent phosphorylation of PDK-1 on tyrosine 373/376 (28, 32). We investigated the role of Src as a proximal activator of PDK-1 tyrosine phosphorylation and activation. First, we assessed Src phosphorylation on tyrosine 416, which accompanies and provides a surrogate measure of Src activity. We found that Ang II acutely and robustly activates Src in MCs. Second, knockdown of Src significantly attenuates the stimulatory effects of Ang II on PDK-1 activation and tyrosine phosphorylation (including on tyrosine 9 and tyrosine 373/376) as well as on cellular hypertrophy and synthesis of fibronectin. These findings demonstrate that Src functions upstream of PDK-1. Our results show for the first time that Src-dependent tyrosine phosphorylation of PDK-1 plays an integral role in mediating the biological responses to Ang II. Of note, our data are consistent with recent findings showing that Src is critical for Ang II-induced collagen synthesis in MCs (38, 39). It has been shown that the calcium-dependent protein kinase Pyk-2 plays a critical role in the tyrosine phosphorylation of PDK1 in response to Ang II (28). More specifically, Pyk-2 appears to act as a molecular scaffold, binding to both PDK-1 and Src, thereby allowing Src to phosphorylate tyrosine 9 and tyrosine 373/376 on PDK-1 (28). Consistent with these observations, we demonstrate that Ang II-induced PDK-1 tyrosine phosphorylation on these residues is abolished by knockdown of Pyk-2 with siRNAs. This indicates that PDK-1 is downstream of Pyk-2. It is likely that Pyk-2- and Src-dependent tyrosine phosphorylation of PDK-1 play an integral role in the response of MCs to Ang II.
There is now considerable evidence that ROS (superoxide, hydrogen peroxide) serve as classic second messenger molecules. It has been reported that MC hypertrophy and extracellular matrix protein accumulation are stimulated by oxidative stress in response to various agonists, such as high glucose and Ang II (21, 23, 24, 41, 42, 55-58). Here, we provide new insights concerning the molecular mechanism involved in these events and demonstrate that redox-dependent tyrosine phosphorylation/activation of Src and PDK-1 contributes to Ang II-induced cell hypertrophy and fibronectin expression. We show that submillimolar concentrations of hydrogen peroxide lead to tyrosine phosphorylation and activation of Src or PDK-1, suggesting that these kinases are modulated by ROS. This is in agreement with previous published studies reporting the redox sensitivity of Src and PDK-1 in other cell types (30, 43, 45, 48, 53). These observations prompted us to test the hypothesis that endogenous ROS act as upstream intermediates in Ang II-mediated and Src-dependent activation of PDK-1. We also identified the source of ROS stimulated by Ang II that may regulate Src/PDK-1 activity. We and others have shown that NAD(P)H oxidases of the Nox family are a major source of ROS in kidney tissue and renal cells, including MCs (16, 19, 20, 21, 23, 57). We also reported that, in MCs, Ang II stimulates ROS release via a Nox4- and p22phox-based NAD(P)H oxidase that is coupled to Ang II redox signaling (21, 24, 42). Furthermore, there is evidence that p22phox is required for Ang II-induced MC hypertrophy or fibronectin expression and that Nox4-derived ROS mediate Ang II hypertrophic response (21, 42). However, no data are available concerning the catalytic subunit accounting for the fibrotic response to Ang II. In the current study, we demonstrate that Ang II elicits a rapid increase in intracellular ROS that correlates with the up-regulation of Nox4 protein. Down-regulation of Nox4 with siRNA prevents ROS generation, Src and PDK-1 tyrosine phosphorylation/activation, and fibronectin expression. Interestingly, it has been documented that Src can be directly oxidized by ROS at specific cysteine residues and that this modification enhances kinase activity (43, 51). Therefore, it is tempting to speculate that the most proximal event physically tethering Nox4 activation by Ang II to the rest of the signaling cascade is a redox-dependent posttranslational modification of Src induced by Nox4-derived ROS. Our data demonstrating that the Src redox-insensitive mutant can block PDK-1-dependent stimulation of cell hypertrophy and fibronectin accumulation in response to Ang II support this contention. The increase in ROS generation by Ang II may be primarily due to the rapid up-regulation of Nox4 protein. Interestingly, we found that Nox4 protein up-regulation is not accompanied by an increase in its mRNA expression. The extreme rapidity of Nox4 protein up-regulation by Ang II without change in mRNA expression suggests that the control of Nox4 expression occurs by translation.
Importantly, we demonstrate that the Nox4/Src/PDK-1 pathway also mediates rapid up-regulation of fibronectin synthesis by the hormone. Thus, the intermediates that integrate extracellular matrix formation with Ang II signaling appear to be the same for the acute and prolonged actions of Ang II. The biological relevance of the rapid increase in fibronectin expression by Ang II in kidney disease may be that recurrent episodes of high renal Ang II may stimulate accumulation of a small amount of fibronectin, which over time may contribute to significant mesangial matrix expansion.
The present data, together with previously published findings, indicate that Nox4 and p22phox both contribute to MC hypertrophy and fibronectin accumulation by Ang II. It is known that p22phox interacts with Nox4 and enhance its activity (17, 20, 22, 59, 60). It is reasonable to think that in MCs, Nox4 and p22phox may form a complex that accounts for Ang II-induced NAD(P)H-dependent ROS generation and the subsequent hypertrophic and fibrotic responses. It is appealing to consider that a Nox4- and p22phox-containing oxidase may be a pivotal signal transducer commonly shared by both hypertrophic and fibrotic pathways triggered by Ang II in MCs. This observation is highly relevant for the design of therapeutic strategies to prevent the initiation or progression of fibrotic renal diseases where the renal renin-angiotensin system is activated.
In conclusion, we have identified a novel role for Nox4 as an essential mediator of Src-dependent PDK-1 tyrosine phosphorylation/activation in response to Ang II and established the significance of this redox pathway in Ang II-mediated MC hypertrophy and extracellular matrix accumulation. Specific inhibition of this redox pathway may selectively target several important biological responses to prevent or reverse pathophysiologic manisfestations of renal diseases, including diabetic nephropathy.
Supplementary Material
Acknowledgments
We thank Rhonda Fudge and Sergio Garcia for technical help.
This work was supported, in whole or in part, by National Institutes of Health Grant K01DK-076923 (to K. B.) and the National Institutes of Health, NIDDK, George O'Brien Kidney Center (to Y. G.). This work was supported in part through an American Heart Association (National) Scientist Development Grant (to Y. G.), a grant-in-aid from the American Heart Association (South Central Affiliate) (to Y. G.), a Juvenile Diabetes Research Foundation Regular Research Grant (to Y. G.), and a National Kidney Foundation Young Investigator Award (to Y. G.). The costs of publication of this article were defrayed in part by the payment of page charges. This article must therefore be hereby marked “advertisement” in accordance with 18 U.S.C. Section 1734 solely to indicate this fact.
The on-line version of this article (available at http://www.jbc.org) contains supplemental Fig. S1.
Footnotes
The abbreviations used are: Ang II, angiotensin II; MCs, mesangial cells; ROS, reactive oxygen species; DCF, 2′,7′-dichlorodihydrofluorescein; PKB, protein kinase B; siRNA, small interfering RNA; siSrc and SiNox4, siRNA for Src and Nox4, respectively; p70S6K, p70 S6 kinase; RT, reverse transcription.
References
- 1.Chatziantoniou, C., and Dussaule, J. C. (2005) Am. J. Physiol. 289 F227-F234 [DOI] [PubMed] [Google Scholar]
- 2.Gomez-Guerrero, C., Hernandez-Vargas, P., Lopez-Franco, O., Ortiz-Munoz, G., and Egido, J. (2005) Curr. Drug Targets Inflamm. Allergy 4 341-351 [DOI] [PubMed] [Google Scholar]
- 3.Okada, H., and Kalluri, R. (2005) Curr. Mol. Med. 5 467-474 [DOI] [PubMed] [Google Scholar]
- 4.Schena, F. P., and Gesualdo, L. (2005) J. Am. Soc. Nephrol. 16 S30-S33 [DOI] [PubMed] [Google Scholar]
- 5.Wolf, G., and Ziyadeh, F. N. (1999) Kidney Int. 56 393-405 [DOI] [PubMed] [Google Scholar]
- 6.Wolf, G. (2006) Kidney Int. 70 1914-1919 [DOI] [PubMed] [Google Scholar]
- 7.Kim, S., and Iwao, H. (2000) Pharmacol. Rev. 52 11-34 [PubMed] [Google Scholar]
- 8.Ruiz-Ortega, M., Ruperez, M., Esteban, V., Rodriguez-Vita, J., Sanchez-Lopez, E., Carvajal, G., and Egido, J. (2006) Nephrol. Dial. Transplant. 21 16-20 [DOI] [PubMed] [Google Scholar]
- 9.Brewster, U. C., Setaro, J. F., and Perazella, M. A. (2003) Am. J. Med. Sci. 326 15-24 [DOI] [PubMed] [Google Scholar]
- 10.Brenner, B. M. (2002) J. Clin. Invest. 110 1753-1758 [DOI] [PMC free article] [PubMed] [Google Scholar]
- 11.Anderson, S., Rennke, H. G., and Brenner, B. M. (1986) J. Clin. Invest. 77 1993-2000 [DOI] [PMC free article] [PubMed] [Google Scholar]
- 12.Taal, M. W., and Brenner, B. M. (1999) J. Hum. Hypertens. 13 Suppl. 1, 51-56 [DOI] [PubMed] [Google Scholar]
- 13.Rincon-Choles, H., Kasinath, B. S., Gorin, Y., and Abboud, H. E. (2002) Kidney Int. 82 8-11 [DOI] [PubMed] [Google Scholar]
- 14.Hanna, I. R., Taniyama, Y., Szocs, K., Rocic, P., and Griendling, K. K. (2002) Antioxid. Redox Signal. 4 899-914 [DOI] [PubMed] [Google Scholar]
- 15.Touyz, R. M. (2004) Braz. J. Med. Biol. Res. 37 1263-1673 [DOI] [PubMed] [Google Scholar]
- 16.Gill, P. S., and Wilcox, C. S. (2006) Antioxid. Redox Signal. 8 1597-1607 [DOI] [PubMed] [Google Scholar]
- 17.Bedard, K., and Krause, K. H. (2007) Physiol. Rev. 87 245-313 [DOI] [PubMed] [Google Scholar]
- 18.Lassegue, B., and Clempus, R. E. (2003) Am. J. Physiol. 285 R277-R297 [DOI] [PubMed] [Google Scholar]
- 19.Lambeth, J. D. (2007) Free Radic. Biol. Med. 43 332-347 [DOI] [PMC free article] [PubMed] [Google Scholar]
- 20.Orient, A., Donko, A., Szabo, A., Leto, T. L., and Geiszt, M. (2007) Nephrol. Dial. Transplant. 22 1281-1288 [DOI] [PubMed] [Google Scholar]
- 21.Gorin, Y., Ricono, J. M., Kim, N. H., Bhandari, B., Choudhury, G. G., and Abboud, H. E. (2003) Am. J. Physiol. 285 F219-F229 [DOI] [PubMed] [Google Scholar]
- 22.Geiszt, M. (2006) Cardiovasc. Res. 71 289-299 [DOI] [PubMed] [Google Scholar]
- 23.Gorin, Y., Block, K., Hernandez, J., Bhandari, B., Wagner, B., Barnes, J. L., and Abboud, H. E. (2005) J. Biol. Chem. 280 39616-39626 [DOI] [PubMed] [Google Scholar]
- 24.Gorin, Y., Ricono, J. M., Wagner, B., Kim, N. H., Bhandari, B., Choudhury, G. G., and Abboud, H. E. (2004) Biochem. J. 381 231-239 [DOI] [PMC free article] [PubMed] [Google Scholar]
- 25.Vanhaesebroeck, B., and Alessi, D. R. (2000) Biochem. J. 346 561-576 [PMC free article] [PubMed] [Google Scholar]
- 26.Brazil, D. P., Yang, Z. Z., and Hemmings, B. A. (2004) Trends Biochem. Sci. 29 233-242 [DOI] [PubMed] [Google Scholar]
- 27.Alessi, D. R., James, S. R., Downes, C. P., Holmes, A. B., Gaffney, P. R., Reese, C. B., and Cohen, P. (1997) Curr. Biol. 7 261-269 [DOI] [PubMed] [Google Scholar]
- 28.Taniyama, Y., Weber, D. S., Rocic, P., Hilenski, L., Akers, M. L., Park, J., Hemmings, B. A., Alexander, R. W., and Griendling, K. K. (2003) Mol. Cell. Biol. 23 8019-8029 [DOI] [PMC free article] [PubMed] [Google Scholar]
- 29.Runyan, C. E., Schnaper, H. W., and Poncelet, A. C. (2004) J. Biol. Chem. 279 2632-2639 [DOI] [PubMed] [Google Scholar]
- 30.Prasad, N., Topping, R. S., Zhou, D., and Decker, S. J. (2000) Biochemistry 39 6929-6935 [DOI] [PubMed] [Google Scholar]
- 31.Casamayor, A., Morrice, N. A., and Alessi, D. R. (1999) Biochem. J. 342 287-292 [PMC free article] [PubMed] [Google Scholar]
- 32.Park, J., Hill, M. M., Hess, D., Brazil, D. P., Hofsteenge, J., and Hemmings, B. A. (2001) J. Biol. Chem. 276 37459-37471 [DOI] [PubMed] [Google Scholar]
- 33.Yang, K. J., Shin, S., Pia, L., Shin, E., Li, Y., Park, K. A., Byun, H. S., Won, M., Hong, J., Kweon, G. R., Hur, G. M., Seok, J. H., Chun, T., Brazil, D. P., Hemmings, B. A., and Park, J. (2008) J. Biol. Chem. 283 1480-1491 [DOI] [PubMed] [Google Scholar]
- 34.Kim, D. W., Hwang, J. H., Suh, J. M., Kim, H., Song, J. H., Hwang, E. S., Hwang, I. Y., Park, K. C., Chung, H. K., Kim, J. M., Park, J., Hemmings, B. A., and Shong, M. (2003) Mol. Endocrinol. 17 1382-1394 [DOI] [PubMed] [Google Scholar]
- 35.Grillo, S., Gremeaux, T., Casamayor, A., Alessi, D. R., Le Marchand-Brustel, Y., and Tanti, J. F. (2000) Eur. J. Biochem. 267 6642-6649 [DOI] [PubMed] [Google Scholar]
- 36.Steiler, T. L., Galuska, D., Leng, Y., Chibalin, A. V., Gilbert, M., and Zierath, J. R. (2003) Endocrinology 144 5259-5267 [DOI] [PubMed] [Google Scholar]
- 37.Fiory, F., Alberobello, A. T., Miele, C., Oriente, F., Esposito, I., Corbo, V., Ruvo, M., Tizzano, B., Rasmussen, T. E., Gammeltoft, S., Formisano, P., and Beguinot, F. (2005) Mol. Cell. Biol. 25 10803-10814 [DOI] [PMC free article] [PubMed] [Google Scholar]
- 38.Mima, A., Matsubara, T., Arai, H., Abe, H., Nagai, K., Kanamori, H., Sumi, E., Takahashi, T., Iehara, N., Fukatsu, A., Kita, T., and Doi, T. (2006) Lab. Invest. 86 927-939 [DOI] [PubMed] [Google Scholar]
- 39.Yano, N., Suzuki, D., Endoh, M., Zhao, T. C., Padbury, J. F., and Tseng, Y. T. (2007) J. Biol. Chem. 282 18819-18830 [DOI] [PubMed] [Google Scholar]
- 40.Amiri, F., and Garcia, R. (1999) Am. J. Physiol. 276 F691-F699 [DOI] [PubMed] [Google Scholar]
- 41.Gorin, Y., Kim, N. H., Feliers, D., Bhandari, B., Choudhury, G. G., and Abboud, H. E. (2001) FASEB J. 15 1909-1920 [DOI] [PubMed] [Google Scholar]
- 42.Block, K., Ricono, J. M., Lee, D. Y., Bhandari, B., Choudhury, G. G., Abboud, H. E., and Gorin, Y. (2006) Antioxid. Redox Signal. 8 1497-1508 [DOI] [PubMed] [Google Scholar]
- 43.Giannoni, E., Buricchi, F., Raugei, G., Ramponi, G., and Chiarugi, P. (2005) Mol. Cell. Biol. 25 6391-6403 [DOI] [PMC free article] [PubMed] [Google Scholar]
- 44.Weber, D. S., Taniyama, Y., Rocic, P., Seshiah, P. N., Dechert, M. A., Gerthoffer, W. T., and Griendling, K. K. (2004) Circ. Res. 94 1219-1226 [DOI] [PubMed] [Google Scholar]
- 45.Taniyama, Y., Hitomi, H., Shah, A., Alexander, R. W., and Griendling, K. K. (2005) Arterioscler. Thromb. Vasc. Biol. 25 1142-1147 [DOI] [PubMed] [Google Scholar]
- 46.Block, K., Gorin, Y., Hoover, P., Williams, P., Chelmicki, T., Clark, R. A., Yoneda, T., and Abboud, H. E. (2007) J. Biol. Chem. 282 8019-8026 [DOI] [PubMed] [Google Scholar]
- 47.Chen, H., Nystrom, F. H., Dong, L. Q., Li, Y., Song, S., Liu, F., and Quon, M. J. (2001) Biochemistry 40 11851-11859 [DOI] [PubMed] [Google Scholar]
- 48.Ushio-Fukai, M., Griendling, K. K., Becker, P. L., Hilenski, L., Halleran, S., and Alexander, R. W. (2001) Arterioscler. Thromb. Vasc. Biol. 21 489-495 [DOI] [PubMed] [Google Scholar]
- 49.Tanimoto, T., Lungu, A. O., and Berk, B. C. (2004) Circ. Res. 94 1050-1058 [DOI] [PubMed] [Google Scholar]
- 50.Mukhin, Y. V., Garnovskaya, M. N., Collinsworth, G., Grewal, J. S., Pendergrass, D., Nagai, T., Pinckney, S., Greene, E. L., and Raymond, J. R. (2000) Biochem. J. 347 61-67 [PMC free article] [PubMed] [Google Scholar]
- 51.Nakashima, I., Kato, M., Akhand, A. A., Suzuki, H., Takeda, K., Hossain, K., and Kawamoto, Y. (2002) Antioxid. Redox Signal. 4 517-531 [DOI] [PubMed] [Google Scholar]
- 52.Mariappan, M. M., Feliers, D., Mummidi, S., Choudhury, G. G., and Kasinath, B. S. (2007) Diabetes 56 476-485 [DOI] [PubMed] [Google Scholar]
- 53.Guo, J., Sabri, A., Elouardighi, H., Rybin, V., and Steinberg, S. F. (2006) Circ. Res. 99 1367-1375 [DOI] [PubMed] [Google Scholar]
- 54.Lee, K. Y., D'Acquisto, F., Hayden, M. S., Shim, J. H., and Ghosh, S. (2005) Science 308 114-118 [DOI] [PubMed] [Google Scholar]
- 55.Wu, D., Peng, F., Zhang, B., Ingram, A. J., Gao, B., and Krepinsky, J. C. (2007) Diabetologia 50 2008-2018 [DOI] [PubMed] [Google Scholar]
- 56.Mahimainathan, L., Das, F., Venkatesan, B., and Choudhury, G. G. (2006) Diabetes 55 2115-2125 [DOI] [PubMed] [Google Scholar]
- 57.Xia, L., Wang, H., Goldberg, H. J., Munk, S., Fantus, I. G., and Whiteside, C. I. (2006) Am. J. Physiol. 290 F345-F356 [DOI] [PubMed] [Google Scholar]
- 58.Gooch, J. L., Gorin, Y., Zhang, B. X., and Abboud, H. E. (2004) J. Biol. Chem. 279 15561-15570 [DOI] [PubMed] [Google Scholar]
- 59.Martyn, K. D., Frederick, L. M., von Loehneysen, K., Dinauer, M. C., and Knaus, U. G. (2006) Cell. Signal. 18 69-82 [DOI] [PubMed] [Google Scholar]
- 60.Ambasta, R. K., Kumar, P., Griendling, K. K., Schmidt, H. H., Busse, R., and Brandes, R. P. (2004) J. Biol. Chem. 279 45935-45941 [DOI] [PubMed] [Google Scholar]
Associated Data
This section collects any data citations, data availability statements, or supplementary materials included in this article.


