

Abstract
DNA monolayers are widely used in fundamental and applied genomics and are versatile experimental models for elucidating the behavior of charged polymers at interfaces. The physical behavior of these systems is to a large extent governed by their internal ionic microenvironment, which is investigated here for layers of end-tethered, single-stranded DNA oligonucleotides (DNA brushes). Retention of counterions by the DNA brush manifests as lowered susceptibility of the interfacial capacitance to external salt conditions. A physical model based on concepts adapted from polymer science was used to further elucidate the connection between monolayer organization and its charging behavior. The data indicate a reorganization of the monolayer with changes in ionic strength and strand coverage that is consistent with that expected for a polyelectrolyte brush. A method for electrochemical quantification of strand coverage, based on shift of reduction potential for redox counterions associated with the DNA monolayer, is also described. These results provide guidance for development of label-free electrochemical diagnostics employing DNA monolayers and formulate a description of monolayer behavior within a polymer science framework.
Introduction
Monolayers of immobilized nucleic acids are central to a portfolio of technologies for applied genomics, including sequencing by synthesis 1,2, genotyping and polymorphism identification 3,4, gene expression profiling 5, and biosensing 6–9. They are also promising experimental models for investigating fundamental properties of charged polymers at solid-liquid interfaces 10. These applications share a common interest in understanding how nucleic acid monolayers organize and how their organization influences activity toward hybridization or other biomolecular interactions. An important research direction has been to establish structure-function relationships, for example by correlating monolayer density with hybridization activity 11–19 or with duplex melting transitions 20–22.
Events of interest, such as hybridization or enzymatic sequencing, must take place under conditions existing within the monolayer. In general the local ionic strength and composition vary greatly from the bulk solution, and there is ample evidence that these differences exert pronounced influence over thermodynamics and kinetics of processes involving surface-tethered DNA chains 23. A better understanding of the local conditions is therefore critical to more effective use of DNA films in diagnostic and other applications.
In this study, electrochemical methods are used to probe the internal environment in monolayers of single-stranded DNA (ssDNA) chains as a function of bulk ionic strength and chain surface coverage. The strands are immobilized by one end to a solid support, in a “polyelectrolyte brush” geometry 24. The charging, or capacitive, response is determined and a physical framework is formulated to relate experimental observations to monolayer organization. The principal conclusions can be explained by existence of a high ionic strength inside the DNA monolayer even at low concentrations of bulk salt, and by the “softness” of the monolayer structure; that is, response of the structure to variations in salt concentration and chain coverage. A method for electrochemical quantification of immobilized strand surface density, based on the electrochemical work needed to reduce redox-active counterions trapped in the DNA monolayer, is also described.
Materials and Methods
Details of experimental procedures and data analysis are provided in the Supporting Information. All electrochemical measurements used an Ag/AgCl/3M NaCl reference electrode and all quoted potentials are relative to this reference. A Pt wire served as the counter electrode, and a 3 mm diameter polycrystalline Au disk electrode as the working electrode. The working electrode was etched electrochemically to achieve a reproducible initial state and its roughness factor r (r = true area/geometric area; r ≥ 1) was measured from the double layer capacitance 25. r ranged from 2.56 to 3.25 (average 2.87 ± 0.28). Single-stranded, oligothymine Thy25-S-S-(CH2)3OH chains were immobilized onto the working electrode from 1 μM solutions in 1 M MgCl2. MgCl2 facilitates achievement of high coverages 26,27. The attachment was via the disulfide-modified 3′ terminus. After immobilization of the Thy25 strands, the electrodes were exposed to 1 mM mercaptopropanol (MCP) in 18.2 MΩ cm water for 1 h to passivate remnant electrode surface and to block nonspecific interactions between the strands and the support. MCP is expected to form a hydrophilic, hydroxyl-terminated monolayer that resists nonspecific adsorption of ssDNA 14,28. An all Thy sequence was used because, of the four bases, thymine exhibits the weakest affinity for gold 29–31 making this sequence optimal for realizing an end-tethered brush geometry.
Differential capacitance per area, Cd, was measured as a function of Thy25 surface coverage (0 to 2.1 × 1013 cm−2) and bulk ionic strength (0.008 M to 1 M NaCl or KCl) using electrochemical impedance spectroscopy (EIS). EIS measurements were carried out under nonfaradaic conditions at 0 V dc bias, 5 mV ac amplitude, and frequencies from 10 Hz to 100,000 Hz. Reported Cd values have been corrected for surface roughness by scaling the geometric electrode area by r.
Following EIS characterization, cyclic voltammetry (CV) traces were obtained at 0.08 V/s in background electrolyte of 10 mM tris(hydroxymethyl)amino methane (tris base), pH 7.4, with and without 1 μM hexaamineruthenium(III) chloride (RuHex). The peak potential Vpeak for reduction of monolayer-associated RuHex, RuHex3+(monolayer) + e− → RuHex2+(monolayer), was determined by fitting a quadratic polynomial to identify the peak maximum after subtraction of charging currents. Vpeak was correlated with coverage of Thy25 strands which was determined independently with X-ray photoelectron spectroscopy (XPS), using working electrodes prepared on glass slides. XPS was performed on a Kratos Axis 165 instrument with a hemispherical analyzer and Mg Kα source, 225 W x-ray power, 80 eV pass energy, and 90° (normal to sample) takeoff angle. A wide pass energy was used to improve signal intensity at the expense of energy resolution. DNA coverages were calculated from P 2p intensities following the procedure of Petrovykh et al 32.
Results and Discussion
Determination of ssDNA Coverage from the Reduction Potential of RuHex3+ Counterions
Interaction of redox-active counterions with DNA is well known to alter thermodynamics of their redox processes, whether the DNA is in solution 33,34 or present as surface-immobilized species 35–39. Here we consider the dependence of such effects on the coverage of ssDNA chains in the relatively crowded environment of a monolayer, for Thy25 ssDNA molecules and the redox counterion RuHex3+. As is the case for RuHex3+ interacting with double-stranded DNA 40–42, its interaction with ssDNA is similarly expected to be predominantly electrostatic.
Fig. 1A shows measured CV curves for the reaction RuHex3+(monolayer) + e− → RuHex2+(monolayer) for three different Thy25 coverages. As coverage increases, the reduction peak potential Vpeak systematically shifts toward more negative values, indicating that the RuHex3+ state is stabilized relative to RuHex2+ with increasing DNA coverage. Origins of this stabilization are discussed below. As expected for surface adsorbed redox species 43, the peak currents were observed to increase linearly with scan rate. Because of the low 1 μM concentration of RuHex3+ in bulk solution, only reduction of RuHex3+ cations trapped in the DNA monolayer is clearly seen on the cathodic scan. A close examination of the peak envelopes reveals, nevertheless, broadening toward more positive potentials. The broadening is predominantly attributed to concurrent reduction of solution RuHex3+, which occurs close to −0.15 V. This is more clearly seen in the inset to Fig. 1A where, at a higher 27 μM RuHex3+ concentration, reduction of both surface and solution species can be discerned. Such bimodal waves were earlier observed for RuHex3+ and DNA films by Tarlov and coworkers44,45.
Figure 1.
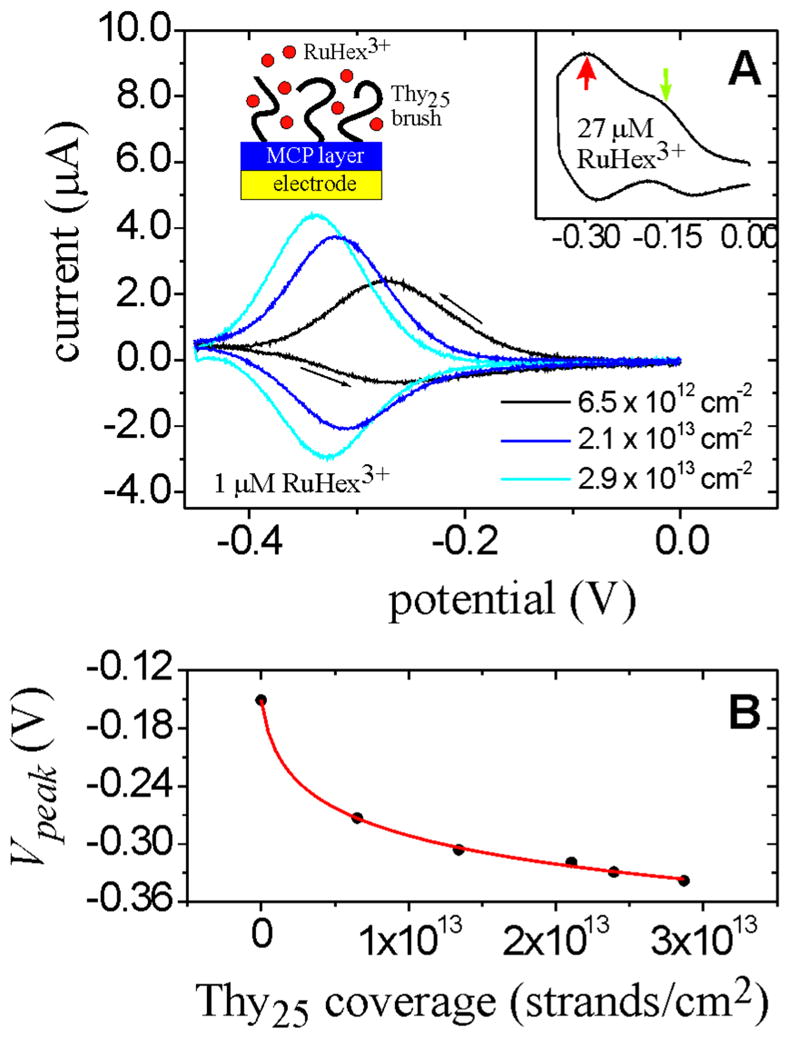
Effect of Thy25 coverage on the peak potential (Vpeak) for the reduction of brush-associated RuHex3+ counterions. All potentials are relative to a Ag/AgCl/3 M NaCl reference. (A) CV traces at three strand coverages. Charging currents have been subtracted. Conditions: 1 μM RuHex3+, 10 mM tris, pH 7.4, scan rate 0.08 V/s. Inset graph: Data at higher, 27 μM concentration of RuHex3+, showing contributions from monolayer-associated RuHex3+ (thick red arrow) as well as solution RuHex3+ (thin green arrow). Thy25 coverage was 1.2 × 1013 cm−2. Also shown is a schematic depiction of the monolayer structure. (B) Vpeak as a function of Thy25 coverage determined independently with XPS. The solid line is a two parameter interpolation (see text), with P1 = 9.8 × 10⁻²² cm2 mol/L and P2 = 1.64 (R2 = 0.999).
Returning to the main panel of Fig. 1A, the peaks narrow at higher strand coverages, with the width (fwhm) decreasing from 125 mV for the coverage of 6.5 × 1012 cm−2 to 100 mV for the 2.9 × 1013 cm−2 sample. This narrowing with increasing chain coverage presumably results from the greater relative magnitude of the surface reduction current. However, even the highest coverages do not reach the theoretical width of 90 mV expected for a reversible reaction of non-interacting, surface-confined species.46 In this regard, it is worth noting that broadened peak envelopes are expected even when there is no convolution of surface and solution signals, on the grounds that not all brush-confined RuHex3+ cations can be assumed to experience an identical local environment. The potential difference between cathodic and anodic peaks for brush-associated RuHex is found to be 8 mV, close to the 0 mV expected for reversibly-behaving surface species. However, it is significant that the RuHex cations are not strictly immobilized. Indeed, the reverse scans exhibit decreased current magnitudes, an effect attributed to a lowered affinity of RuHex2+ for the DNA compared to RuHex3+. A lowered electrostatic affinity of RuHex2+ for DNA is expected to facilitate its displacement from the brush by other cations (i.e. tris+), as reflected in the decreased current magnitudes on the reverse scan. Fig. 1B plots Vpeak as a function of strand coverage that was determined independently using XPS. A systematic correlation between Vpeak and strand coverage is evident.
Why does RuHex3+ reduction potential shift with strand coverage? Experimental 47–50 and theoretical 51–53 reports have identified a variety of contributions to shifts in redox potentials of surface-confined species compared to solution values, including changes in the local dielectric constant, spatial distribution, solvation, coverage, ion pair formation, and image charge interactions. Many of these effects may also apply in the present case, although their clear separation is challenged by the complexity of the DNA brush environment. Nevertheless, a dominant contribution lies in coupling of the reduction of RuHex3+ to transport of cations from solution. When RuHex3+ inside the DNA brush is reduced, a local deficit of positive charge is created. The deficit triggers an inflow of additional cations in order to preserve electroneutrality of the near-surface region that contains the immobilized, negative DNA charge. If the cation transport occurs up a gradient in activity, then work must be performed to “pump” the cations into the monolayer, corresponding to a negative displacement in Vpeak. In general, the activity of cations in the DNA brush will be higher than in solution because of accumulation by the monolayer. Moreover, this difference should be enhanced at higher chain coverages, leading to a greater displacement of Vpeak. Similar effects have been reported with thiol monolayers of small molecules54,55 and with membrane coatings56, where the induced potentials are often referred to as Donnan potentials.
In the present experiments, tris+ was by far the most abundant cation in solution and its transport is expected to dominate. This expectation is confirmed in Fig. 2 by noting that changing RuHex3+ concentration does not significantly alter Vpeak, whereas lowering tris+ concentration further shifts the wave in the negative direction. Boon et al have reported a similar ionic strength dependence for monolayers of double stranded DNA 42. A shift in Vpeak with a decrease in tris+ ionic strength will also in part derive from an increased resistance of the electrolyte, due to a higher potential drop across the solution. However, even at the lowest (1 mM) concentration of tris, contributions from such uncompensated resistance were found to be only 4 mV, a small fraction of the experimentally observed displacements.
Figure 2.
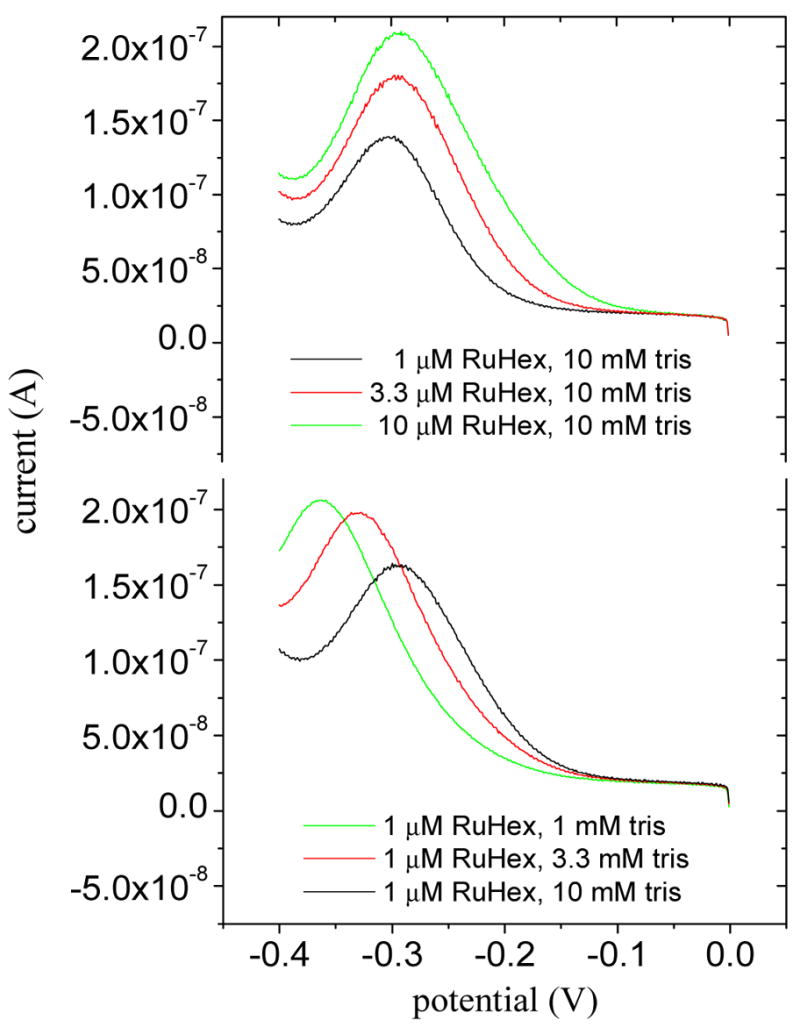
Voltammograms for reduction of brush-associated RuHex3+. Top: At three concentrations of RuHex3+ in 10 mM tris. Bottom: At three concentrations of tris and 1 μM RuHex3+. Other conditions: pH 7.4, scan rate 0.08 V/s, chain coverage 1.2 × 1013 cm−2.
From stoichiometry, it is expected that reduction of a single RuHex3+ requires transport of a single tris+ cation. The resultant electrochemical work, if performed reversibly, is eNA ΔV = RT ln (atris/Atris) where e is the negative electronic charge, NA is Avogadro’s number, ΔV is the potential shift, R is the gas constant, T is absolute temperature, and atris and Atris are activities of tris+ in the monolayer and in solution, respectively. If the displacement in Vpeak is solely attributed to tris transport into the monolayer, then for the experimental conditions
| (1) |
The value −0.151 V is the measured reduction potential at zero DNA coverage, and the solution activity of tris+ was approximated by its molar concentration Φtris.57
Application of equation 1 to predict Vpeak would require information on the dependence of atris on the strand coverage σDNA, which is not known. Trials of simple functional forms revealed good agreement for a power law dependence, atris = Φtris + P1 σDNAP2, as shown by the solid line in Fig. 1B. The resultant fit can be used to estimate what values of atris are required to account for the observed shifts in Vpeak. Following this reasoning, atris is estimated to range from about 1 (σDNA of 6.4 × 1012 cm−2) to about 10 (σDNA of 2.6 × 1013 cm−2), with a strong dependence on σDNA given by an exponent of P2 = 1.64.
The large estimated values for atris at high chain coverage are revealing. Typical values of counterion activity coefficients in polyelectrolyte solutions are often found to be around 0.5, or even lower.58 If similarly low activity coefficients apply to a DNA brush, then the surface concentration of tris+ under high chain coverage must be significantly greater than 10 M, an unlikely scenario. Thus, despite the success of equation 1 as an interpolation formula in Fig. 1B, it seems likely that work associated with cation transport only partially accounts for the observed Vpeak shifts. For example, if higher chain coverages more strongly favor formation of DNA-RuHex3+ contacts relative to DNA-RuHex2+ contacts, that preference would also manifest as an additional contribution to Vpeak displacement. Such effects are being assessed in a separate study.
Compared to other nondestructive electrochemical methods for measuring chain coverage, such as those based on total charge required to reduce redox counterions associated with a DNA film44,59, the present approach is particularly straightforward as it only requires knowledge of Vpeak. Integration of peak areas, which are subject to uncertainties in quantitatively separating out background currents51, is avoided. Moreover, by adjusting the solution ionic strength the sensitivity of Vpeak to chain coverage can be tuned, with greater displacements for a given coverage realized at lower ionic strengths (Fig. 2 bottom).
Charging Behavior of ssDNA Monolayers
Measurements of interfacial capacitance provide a direct probe of the near surface conditions, and as such are especially useful for exploring how the local conditions relate to those in solution. Fig. 3 shows the differential capacitance Cd (capacitance/area) for ssDNA monolayers immersed in aqueous solutions containing only NaCl as the electrolyte. Cd is plotted as a function of increasing salt from 8 mM to 1 M and four strand coverages from 2.4 × 10¹² to 2.1 × 1013 cm−2. For all coverages, Cd increases with ionic strength, qualitatively consistent with the behavior of a diffuse double layer at a bare solid-liquid interface 60. Interestingly, however, the sensitivity of Cd to salt concentration diminishes at higher strand coverages, with a progressive flattening of the Cd vs salt curves. Also evident in Fig. 3 are vertical offsets between Cd curves for different coverages - these offsets are attributed to uncertainty in the determination of the roughness r used for area normalization of the capacitance.
Figure 3.
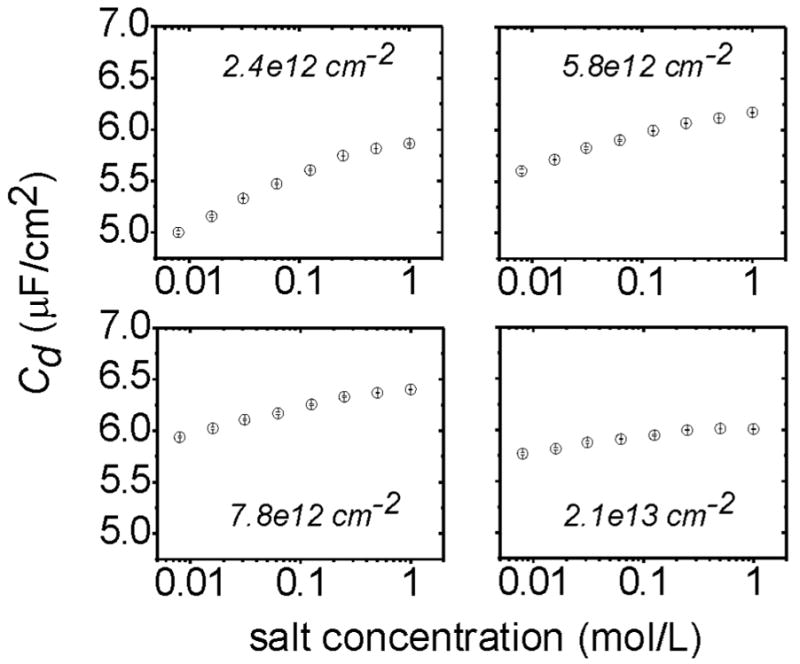
ssDNA monolayer capacitance Cd as a function of monovalent salt concentration, at different strand coverages. All graphs are on common y- and x-scales. Conditions: pH 7.0 solution of NaCl in water, 5 mV rms ac amplitude, 0 V dc vs Ag/AgCl/3M NaCl. Coverages were determined from the peak potential Vpeak using the RuHex method, Fig. 1B. Error bars (horizontal lines across symbols) indicate the standard deviation of two measurements taken 4 minutes apart.
The weakening dependence of Cd on solution salt at higher strand coverages is a signature that conditions within the monolayer increasingly deviate from those in solution. Intuitively, one important reason for this should be that the DNA brush retains its counterions, maintaining a high local ionic strength even if little or no salt is present in the bulk electrolyte. If Cd reflects this decoupling between local and bulk ionic strength, its change with variations in bulk salt should be suppressed, as observed experimentally.
The connection between the charging response, as captured in Cd, and the structure of the DNA layer can be further explored using a simple model. The model assumes that the DNA charges are immobile and uniformly distributed throughout the layer; that is, the DNA concentration profile is approximated by a step function of thickness H. Notably, treatment of the DNA charge as immobile neglects perturbations of the chain configurations due to applied potentials. One consequence of this is that the model attributes the ac charging currents during measurement of Cd entirely to the movement of small (Na+, Cl−) ions. These mobile ions pass freely between the layer and the external electrolyte, the external electrolyte occupying the space x > H (Fig. 4). Inside the brush, the DNA chains provide a background of constant negative charge density. In addition, presence of net charge on the working electrode produces an electric field that interacts with salt ions in the “proximal region” (Fig. 4), altering their spatial distribution. The surface field decays with distance such that, in the main brush body, it can be taken as zero. This division of the brush into two sections, a proximal and a brush body region, is valid only if the electrostatic screening (Debye) length rD within the DNA layer is sufficiently less than the layer thickness H, i.e. rD/H ≪ 1. For the experimental conditions (Supporting Information) rD/H is expected to remain below 0.2, and typically be closer to 0.1. Thus, surface fields are expected to decay sufficiently rapidly for the two-region description of the brush, as illustrated in Fig. 4, to be reasonable.
Figure 4.
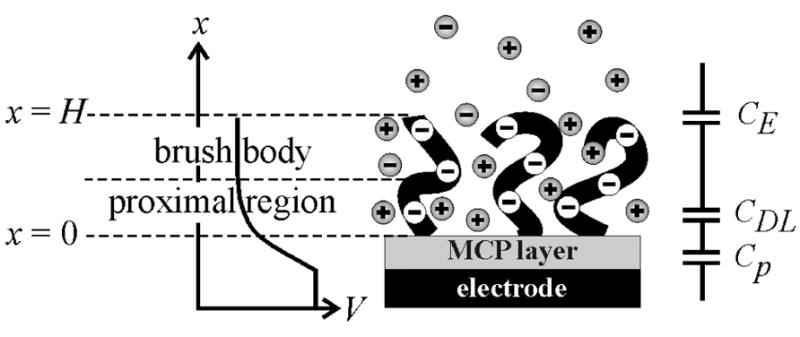
Model used in the derivation of the charging response of a polyelectrolyte brush. The expected potential profile is schematically indicated on the left, and the equivalent circuit description is shown on the right.
Within the above description, three putative contributions to the overall capacitance Cd can be identified (Fig. 4): (i) capacitance of the MCP layer (Cp), (ii) a diffuse layer capacitance inside the DNA layer, at the MCP-brush interface (CDL), and (iii) capacitance associated with the brush-solution interface (CE), where a charge separation arises due to partial “leakage” of brush counterions beyond the physical confines of the brush 61. The charge separation associated with CE reflects a balance between entropy favoring expansion of the counterion cloud and electrostatic interactions favoring its containment within the DNA film.
The EIS experiments measure differential capacitance Cd = dq/dV, where dq is a differential change in charge stored by the brush in response to an increment dV in potential applied across it. Because the brush-solution interface is permeable to salt it follows that, in a measurement of differential capacitance, CE is effectively short-circuited and does not contribute. The expression for Cd thus simplifies to a series arrangement of Cp and CDL,
| (2) |
Cp is determined by the thickness and dielectric constant of the MCP layer. In contrast, the diffuse layer capacitance CDL must reflect conditions in the solvated interior of the DNA film. This capacitance is analogous to the classical Gouy-Chapman model60 in that it is associated with a diffuse distribution of ions, but differs in that the diffuse ionic atmosphere exists inside the charge background provided by the DNA. The expression for CDL, assuming a uniform distribution of immobile DNA charge, is derived analytically from Poisson’s equation in the Supporting Information. The result is
| (3) |
where ci is concentration of monovalent salt ions of charge i in the brush body, V0 is the potential at x = 0 relative to bulk electrolyte, ε is the dielectric constant, ε0 is the permittivity of vacuum, and k is the Boltzmann constant. The “−” sign applies for V0 < 0, the “+” sign for V0 > 0. The concentrations of anions (c−) and cations (c+) in the body of the brush are related to their concentrations Φ+ = Φ− = Φ in the external electrolyte by the constraints of local charge neutrality and partitioning equilibrium (Donnan equilibria)62,63,
| (4) |
| (5) |
In equation 5, ionic activities have been approximated by concentrations. The assumption of charge neutrality in the brush body is supported by recent simulations of strongly charged brushes64 as well as by results from earlier lattice theory calculations65. Equations 4 and 5 are readily solved for c− and c+ in terms of Φ and cDNA,
| (6) |
The concentration of immobilized charge attributed to the DNA, cDNA, is given by cDNA = QσDNA/NAH, where Q is the number of charges per strand. Since only those positive ions that are freely mobile (i.e. uncondensed on the DNA backbone66,67) are expected to participate in the charging response, in equation 3 c+ is taken to represent concentration of uncondensed cations. Consistency then requires that in cDNA = QσDNA/NAH the parameter Q is the reduced charge per strand, accounting for counterion condensation. For ssDNA, Q is about 60 % of the total phosphate charge 67. Based on theoretical predictions for polyelectrolyte brushes 61,68, H is taken to follow a scaling law in chain coverage and salt concentration, H = K σw Φ −v, with w and v the scaling exponents. Equations 2, 3 and 6 describe the predicted behavior of Cd for a polyelectrolyte brush as a function of strand coverage and salt concentration.
Fig. 5 compares experimental Cd data (Fig. 5A) to predicted trends for two scenarios differing in assumptions regarding behavior of the DNA brush. In the “responsive” monolayer (RM) scenario, Fig. 5B, the brush swells or shrinks with changes in salt and strand coverage according to the scaling law expression for H, H = K σwΦ−v. Cp, V0, w, and v were varied to optimize agreement between calculated and experimental Cd, subject to the constraint that H not exceed the total contour length of the chains. K was calculated from v and w and published neutron reflectivity data on a 25mer ssDNA brush28 which found H = 4.8 nm when σDNA = 3 × 1012 cm−2 and Φ = 1 M 69. In the second, “stiff” monolayer (SM) scenario, Fig. 5C, H was fixed at 10 nm.
Figure 5.
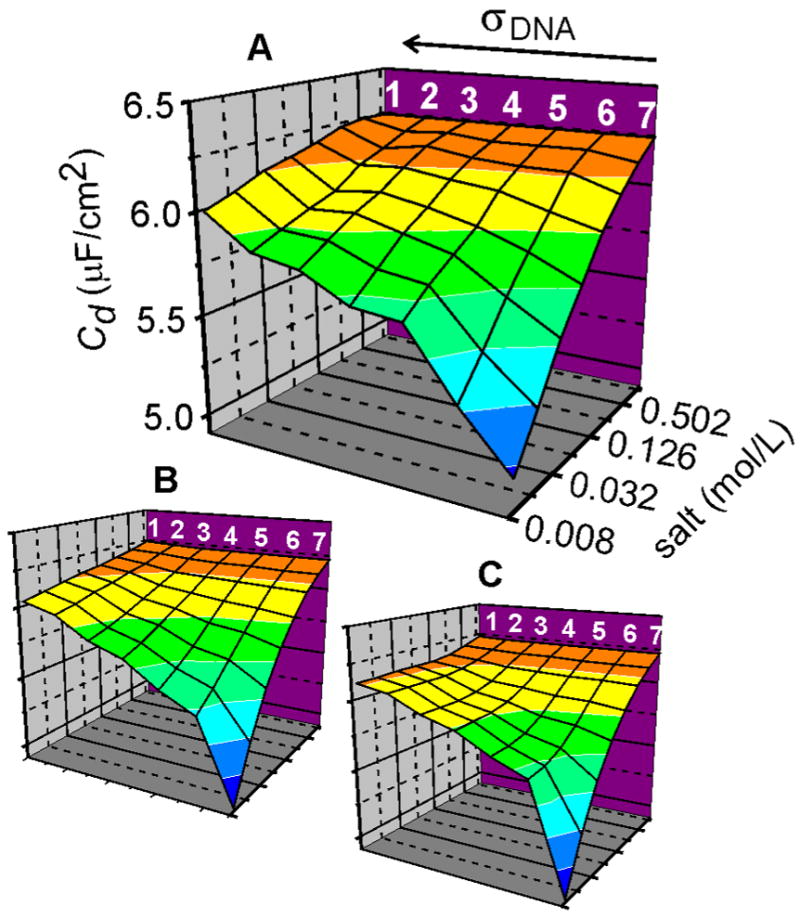
Comparison of experimental and calculated Cd values as a function of salt concentration and strand coverage. All plots are on common xyz scale, shown in (A). Strand coverages are indicated by numbers along the top of plot (A) in order of decreasing coverage: (1) 2.1 × 1013 cm−2, (2) 1.5 × 1013 cm−2, (3) 7.8 × 1012 cm−2, (4) 5.8 × 1012 cm−2, (5) 3.4 × 1012 cm−2, (6) 2.4 × 1012 cm−2, (7) pure MCP monolayer. (A) Experimental data. (B) Cd response for the RM model. w = 0.0 ± 0.17, v = 0.28 ± 0.05, Cp = 6.38 (± .03) × 10−6 F/cm2, V0 = −0.017 (± 0.006) V. Uncertainties reflect 10 % increase in rms error. (C) Cd response for the SM model. H = 10 nm, Cp = 6.38 × 10⁻⁶ F/cm2, V0 = −0.017 V. For purposes of comparison, the curve for each coverage in (A) was rescaled by a constant factor (between 0.97 and 1.06) so as to equalize Cd at 1 M with that measured for the pure MCP sample. This adjustment lies within experimental uncertainty of the roughness factor r used for area-normalization of the capacitance.
The RM model approximately reproduces experimental trends over the investigated range in σDNA and Φ, exhibiting a gradual decrease in capacitance with a decrease in ionic strength. The optimized exponent values w = 0.0 ± 0.17 and v = 0.28 ± 0.05 can be compared to those predicted for highly charged polyelectrolyte brushes,68 in particular for the so-called saturated osmotic (w = v = 0) and quasineutral (w = 1/3, v = 1/3) regimes spanned by our experimental conditions.70 The fit is seen to be rather insensitive to w, as evident from the large uncertainty, presumably because the experimental range in σDNA was modest. The value for v falls between the saturated osmotic and quasineutral predictions, as may be expected since the measurements straddle these regimes. However, the comparison to theory should not be overemphasized since the theory applies in the limit of long chains, compared to the rather short Thy25 molecules, and since the brush thickness H was not measured directly but rather was deduced through a model-dependent calculation of Cd under simplifying assumptions. For the SM case (Fig. 5C), Cd asymptotes to a constant value at the lowest salt concentrations, contrary to the experimental trend. In the SM scenario, as bulk ionic strength decreases, the ion concentration in the brush (and hence Cd) converges to a constant value because the brush thickness H is fixed, irrespective of solution conditions. In contrast, in the RM description the monolayer swells as Φ decreases, causing a dilution of the internal ion concentration that manifests as a progressive, gradual decrease in Cd. The essential point is that responsive behavior is expected on physical grounds 61,68 and, as argued by the comparison of experimental data with the RM and SM scenarios, is also reflected in the charging response of a DNA polyelectrolyte brush.
Conclusions
Electrochemical techniques were used to probe the ionic microenvironment inside of monolayers of end-attached ssDNA oligonucleotides (DNA brushes). The reduction potential of redox counterions associated with the monolayer progressively shifts toward negative potentials with increasing chain coverage. This effect is partially an outcome of electrical work needed to bring additional counterions into the monolayer, against a concentration gradient, in order to preserve its electroneutrality. Calibration of the shift against an independent measure of chain surface coverage leads to a simple and robust method for quantifying amounts of immobilized ssDNA. The capacitance of ssDNA monolayers was studied as a function of bulk salt concentration and strand coverage. Retention of counterions by the monolayers manifested as a decreased susceptibility of the capacitance to the external salt environment. Moreover, the charging response exhibited signatures of structural reorganization whereby the DNA strands stretch or relax with changes in solution ionic strength, consistent with expected physical behavior of charged polymer layers. These results emphasize that the ionic environment inside a DNA brush differs strikingly from that in solution, and are relevant to DNA bioassays71–74 and related technologies based on monitoring of interfacial electrostatics in nucleic acid films.
Supplementary Material
Complete description of electrochemical and XPS experimental procedures, and derivation of equation 3. This material is available at http://www.pubs.acs.org.
Acknowledgments
The authors are grateful to Youlei Weng for initial characterization of the DNA monolayers and to Prof. Ben O’Shaughnessy and Dr. Qingbo Yang for insightful discussions. Support for this work was provided by the National Science Foundation (NSF) of the United States of America through CAREER (DMR-00-93758) and IGERT (DGE-02-21589) programs. Sample preparation was assisted by use of shared facilities supported by the MRSEC Program of the NSF (DMR-02-13574) and by the New York State Office of Science, Technology and Academic Research (NYSTAR).
References
- 1.Braslavsky I, Hebert B, Kartalov E, Quake SR. Proc Natl Acad Sci USA. 2003;100:3960–3964. doi: 10.1073/pnas.0230489100. [DOI] [PMC free article] [PubMed] [Google Scholar]
- 2.Seo TS, Bai XP, Kim DH, Meng QL, Shi SD, Ruparel H, Li ZM, Turro NJ, Ju JY. Proc Natl Acad Sci USA. 2005;102:5926–5931. doi: 10.1073/pnas.0501965102. [DOI] [PMC free article] [PubMed] [Google Scholar]
- 3.Nikiforov TT, Rendle RB, Goelet P, Rogers YH, Kotewicz ML, Anderson S, Trainor GL, Knapp MR. Nucleic Acids Res. 1994;22:4167–4175. doi: 10.1093/nar/22.20.4167. [DOI] [PMC free article] [PubMed] [Google Scholar]
- 4.Matsuzaki H, et al. Genome Res. 2004;14:414–425. doi: 10.1101/gr.2014904. [DOI] [PMC free article] [PubMed] [Google Scholar]
- 5.Schena M, Shalon D, Davis RW, Brown PO. Science. 1995;270:467–470. doi: 10.1126/science.270.5235.467. [DOI] [PubMed] [Google Scholar]
- 6.Gooding JJ. Electroanalysis. 2002;14:1149–1156. [Google Scholar]
- 7.Drummond TG, Hill MG, Barton JK. Nature Biotechnol. 2003;21:1192–1199. doi: 10.1038/nbt873. [DOI] [PubMed] [Google Scholar]
- 8.Brockman JM, Nelson BP, Corn RM. Annu Rev Phys Chem. 2000;51:41–63. doi: 10.1146/annurev.physchem.51.1.41. [DOI] [PubMed] [Google Scholar]
- 9.Wang J. Anal Chim Acta. 2002;469:63–71. [Google Scholar]
- 10.Johnson PA, Gaspar MA, Levicky R. J Am Chem Soc. 2004;126:9910–9911. doi: 10.1021/ja048415y. [DOI] [PubMed] [Google Scholar]
- 11.Peterson AW, Heaton RJ, Georgiadis RM. Nucleic Acids Res. 2001;29:5163–5168. doi: 10.1093/nar/29.24.5163. [DOI] [PMC free article] [PubMed] [Google Scholar]
- 12.Pena SRN, Raina S, Goodrich GP, Fedoroff NV, Keating CD. J Am Chem Soc. 2002;124:7314–7323. doi: 10.1021/ja0177915. [DOI] [PubMed] [Google Scholar]
- 13.Stevens PW, Henry MR, Kelso DM. Nucleic Acids Res. 1999;27:1719–1727. doi: 10.1093/nar/27.7.1719. [DOI] [PMC free article] [PubMed] [Google Scholar]
- 14.Herne TM, Tarlov MJ. J Am Chem Soc. 1997;119:8916–8920. [Google Scholar]
- 15.Chan V, Graves DJ, McKenzie SE. Biophys J. 1995;69:2243–2255. doi: 10.1016/S0006-3495(95)80095-0. [DOI] [PMC free article] [PubMed] [Google Scholar]
- 16.Vainrub A, Pettitt BM. Phys Rev E. 2002;66:041905. doi: 10.1103/PhysRevE.66.041905. [DOI] [PubMed] [Google Scholar]
- 17.Erickson D, Dongqing L, Krull UJ. Anal Biochem. 2003;317:186–200. doi: 10.1016/s0003-2697(03)00090-3. [DOI] [PubMed] [Google Scholar]
- 18.Hagan MF, Chakraborty AK. J Chem Phys. 2004;120:4958–4968. doi: 10.1063/1.1645786. [DOI] [PubMed] [Google Scholar]
- 19.Halperin A, Buhot A, Zhulina EB. Clinical Chem. 2004;50:2254–2262. doi: 10.1373/clinchem.2004.037226. [DOI] [PubMed] [Google Scholar]
- 20.Peterlinz KA, Georgiadis RM, Herne TM, Tarlov MJ. J Am Chem Soc. 1997;119:3401–3402. [Google Scholar]
- 21.Watterson JH, Piunno PAE, Wust CC, Krull UJ. Langmuir. 2000;16:4984–4992. [Google Scholar]
- 22.Meunier-Prest R, Raveau S, Finot E, Legay G, Cherkaoui-Malki M, Latruffe N. Nucleic Acids Res. 2003;31:e150. doi: 10.1093/nar/gng150. [DOI] [PMC free article] [PubMed] [Google Scholar]
- 23.Levicky R, Horgan A. Trends Biotechnol. 2005;23:143–149. doi: 10.1016/j.tibtech.2005.01.004. [DOI] [PubMed] [Google Scholar]
- 24.Miklavic SJ, Marcelja S. J Phys Chem. 1988;92:6718–6722. [Google Scholar]
- 25.Oesch U, Janata J. Electrochim Acta. 1983;28:1237–1246. [Google Scholar]
- 26.Petrovykh DY, Kimura-Suda H, Whitman LJ, Tarlov MJ. J Am Chem Soc. 2003;125:5219–5226. doi: 10.1021/ja029450c. [DOI] [PubMed] [Google Scholar]
- 27.Kelley SO, Barton JK, Jackson NM, McPherson LD, Potter AB, Spain EM, Allen MJ, Hill MG. Langmuir. 1998;14:6781–6784. [Google Scholar]
- 28.Levicky R, Herne TM, Tarlov MJ, Satija SK. J Am Chem Soc. 1998;120:9787–9792. [Google Scholar]
- 29.Kimura-Suda H, Petrovykh DY, Tarlov MJ, Whitman LJ. J Am Chem Soc. 2003;125:9014–9015. doi: 10.1021/ja035756n. [DOI] [PubMed] [Google Scholar]
- 30.Storhoff JJ, Elghanian R, Mirkin CA, Letsinger RL. Langmuir. 2002;18:6666–6670. [Google Scholar]
- 31.Wolf LK, Gao Y, Georgiadis RM. Langmuir. 2004;20:3357–3361. doi: 10.1021/la036125+. [DOI] [PubMed] [Google Scholar]
- 32.Petrovykh DY, Kimura-Suda H, Tarlov MJ, Whitman LJ. Langmuir. 2004;20:429–440. doi: 10.1021/la034944o. [DOI] [PubMed] [Google Scholar]
- 33.Carter MT, Rodriguez M, Bard AJ. J Am Chem Soc. 1989;111:8901–8911. [Google Scholar]
- 34.Welch TW, Corbett AH, Thorp HH. J Phys Chem. 1995;99:11757–11763. [Google Scholar]
- 35.Millan KM, Mikkelsen SR. Anal Chem. 1993;65:2317–2323. doi: 10.1021/ac00065a025. [DOI] [PubMed] [Google Scholar]
- 36.Kelley SO, Barton JK, Jackson NM, Hill MG. Bioconjugate Chem. 1997;8:31–37. doi: 10.1021/bc960070o. [DOI] [PubMed] [Google Scholar]
- 37.Pang DW, Abruna HD. Anal Chem. 1998;70:3162–3169. doi: 10.1021/ac980211a. [DOI] [PubMed] [Google Scholar]
- 38.Tani A, Thomson AJ, Butt JN. Analyst. 2001;126:1756–1759. doi: 10.1039/b104260m. [DOI] [PubMed] [Google Scholar]
- 39.Yang W, Ozsoz M, Hibbert DB, Gooding JJ. Electroanalysis. 2002;14:1299–1302. [Google Scholar]
- 40.Ho PS, Frederick CA, Saal D, Wang AHJ, Rich A. J Biomol Struc Dynamics. 1987;4:521–534. doi: 10.1080/07391102.1987.10507657. [DOI] [PubMed] [Google Scholar]
- 41.Karthe P, Gautham N. Acta Cryst D. 1998;D54:501–509. doi: 10.1107/s0907444997013954. [DOI] [PubMed] [Google Scholar]
- 42.Boon EM, Jackson NM, Wightman MD, Kelley SO, Hill MG, Barton JK. J Phys Chem B. 2003;107:11805–11812. [Google Scholar]
- 43.Laviron E. J Electroanal Chem. 1974;52:355–393. [Google Scholar]
- 44.Steel AB, Herne TM, Tarlov MJ. Anal Chem. 1998;70:4670–4677. doi: 10.1021/ac980037q. [DOI] [PubMed] [Google Scholar]
- 45.Steel AB, Herne TM, Tarlov MJ. Bioconjugate Chem. 1999;10:419–423. doi: 10.1021/bc980115g. [DOI] [PubMed] [Google Scholar]
- 46.Laviron E. J Electroanal Chem. 1979;101:19–28. [Google Scholar]
- 47.Rowe GK, Creager SE. Langmuir. 1991;7:2307–2312. [Google Scholar]
- 48.Creager SE, Rowe GK. J Electroanal Chem. 1997;420:291–299. [Google Scholar]
- 49.Avecedo D, Abruna HD. J Phys Chem. 1991;95:9590–9594. [Google Scholar]
- 50.De Long HC, Buttry DA. Langmuir. 1992;8:2491–2496. [Google Scholar]
- 51.Smith CP, White HS. Anal Chem. 1992;64:2398–2405. doi: 10.1021/ac00044a017. [DOI] [PubMed] [Google Scholar]
- 52.Ohtani M, Kuwabata S, Yoneyama H. Anal Chem. 1997;69:1045–1053. doi: 10.1021/ac960996p. [DOI] [PubMed] [Google Scholar]
- 53.Andreu R, Calvente JJ, Fawcett WR, Molero M. Langmuir. 1997;13:5189–5196. [Google Scholar]
- 54.Redepenning J, Tunison HM, Finklea HO. Langmuir. 1993;9:1404–1407. [Google Scholar]
- 55.Bretz RL, Abruna HD. J Electroanal Chem. 1996;408:199–211. [Google Scholar]
- 56.Doblhofer K, Armstrong RD. Electrochim Acta. 1988;33:453–460. [Google Scholar]
- 57.The concentration of the tris cation is governed by the tris pKa, which is 8.3 at ambient temperature. Thus, at a pH of 7.4 and tris concentration of 10 mM, concentration of tris+ cation is 8.9 mM.
- 58.Rice SA, Nagasawa M. Polyelectrolyte Solutions. Academic Press; New York: 1961. [Google Scholar]
- 59.Yu HZ, Luo CY, Sankar CG, Sen D. Anal Chem. 2003;75:3902–3907. doi: 10.1021/ac034318w. [DOI] [PubMed] [Google Scholar]
- 60.Bard AJ, Faulkner LR. Electrochemical Methods: Fundamentals and Applications. 2. Wiley & Sons, Inc; New York: 2000. [Google Scholar]
- 61.Borisov OV, Zhulina EB, Birshtein TM. Macromolecules. 1994;27:4795–4803. [Google Scholar]
- 62.Donnan FG. J Membrane Sci. 1995;100:45–55. [Google Scholar]
- 63.Zhulina EB, Borisov OV, Birshtein TM. Macromolecules. 1999;32:8189–8196. [Google Scholar]
- 64.Kumar NA, Seidel C. Macromolecules. 2005;38:9341–9350. [Google Scholar]
- 65.Israels R, Leermakers FAM, Fleer GJ, Zhulina EB. Macromolecules. 1994;27:3249–3261. [Google Scholar]
- 66.Manning GS. Accts Chem Res. 1979;12:443–449. [Google Scholar]
- 67.Record MT, Anderson CF, Lohman TM. Quart Rev Biophys. 1978;11:103–178. doi: 10.1017/s003358350000202x. [DOI] [PubMed] [Google Scholar]
- 68.O’Shaughnessy B, Yang Q. arXiv:cond-mat/0408036. 2005. p. art. no. 0408036. [Google Scholar]
- 69.For an ssDNA monolayer of uniform internal composition, of thickness H, the z-rms thickness defined in ref 28 is equal to H/121/2.
- 70.The transition between the two regimes has been observed at rD = 1/3 σDNA−1/2, where rD is the Debye screening length in solution and σDNA−1/2 is the separation between chains (Balastre M, Li F, Schorr P, Yang J, Mays JW, Tirrell MV. Macromolecules. 2002;35:9480–9486.). The present experiments span this transition.
- 71.Berggren C, Stalhandske P, Brundell J, Johansson G. Electroanalysis. 1999;11:156–160. [Google Scholar]
- 72.Cai W, Peck JR, van der Weide DW, Hamers RJ. Biosens Bioelect. 2004;19:1013–1019. doi: 10.1016/j.bios.2003.09.009. [DOI] [PubMed] [Google Scholar]
- 73.Fritz J, Cooper EB, Gaudet S, Sorger PK, Manalis SR. Proc Natl Acad Sci USA. 2002;99:14142–14146. doi: 10.1073/pnas.232276699. [DOI] [PMC free article] [PubMed] [Google Scholar]
- 74.Cloarec JP, Deligianis N, Martin JR, Lawrence I, Souteyrand E, Polychronakos C, Lawrence MF. Biosens Bioelect. 2002;17:405–412. doi: 10.1016/s0956-5663(01)00282-2. [DOI] [PubMed] [Google Scholar]
Associated Data
This section collects any data citations, data availability statements, or supplementary materials included in this article.
Supplementary Materials
Complete description of electrochemical and XPS experimental procedures, and derivation of equation 3. This material is available at http://www.pubs.acs.org.