

Abstract
The role of ionizable amino acid side chains in the bovine rhodopsin activation mechanism was studied in mutants E134Q, E134R/R135E, H211F and E122Q. All mutants showed similar bathorhodopsin stability on the 30 ns to 1 μs time scale compared to wild type. Lumirhodopsin decay was also similar to wild type except for the H211F mutant where early decay (20 μs) to a second form of lumirhodopsin was seen, followed by formation of an extremely long lived Meta I480 product (34 ms), an intermediate which forms to a much reduced extent, if at all, in dodecyl maltoside suspensions of wild type rhodopsin. A smaller amount of a similar long lived Meta I480 product was seen after photolysis of E122Q, but E134Q and E134R/R135Q displayed kinetics much more similar to wild type under these conditions (i.e. no Meta I480 product). These results support the idea that specific interaction of His211 and Glu122 plays a significant role in deprotonation of the retinylidene Schiff base and receptor activation. Proton uptake measurements using bromcresol purple showed that E122Q was qualitatively similar to wild type rhodopsin, with at least one proton being released during lumirhodopsin decay per Meta I380 intermediate formed, followed by uptake of at least two protons per rhodopsin bleached on the tens of millisecond time scale. Different results were obtained for H211F, E134Q and E134R/R135E, which all released approximately two protons per rhodopsin bleached. These results show that several ionizable groups besides the Schiff base imine are affected by the structural changes involved in rhodopsin activation. At least two proton uptake groups, and probably at least one proton release group in addition to the Schiff base are present in rhodopsin.
The visual pigment rhodopsin offers insight into the activation mechanism of an important, but difficult to characterize transmembrane protein family, G protein coupled receptors (GPCRs). Because GPCRs span a membrane bilayer, the interactions of charged or hydrogen-bonding amino acid side chains within the low dielectric interior region are much more energetically important than the interactions similar groups would have at the surface of globular proteins. Fourier-transform infrared (FTIR) difference spectroscopy and resonance Raman measurements show a series of discrete steps that reorganize electrostatically significant side chains to connect rhodopsin photoexcitation with G protein activating cytoplasmic loop changes (1–3). However, the low temperatures used to trap photointermediates in most vibrational studies exclude detection of entropically favored intermediates (see Figure 1), so a full understanding of the activation mechanism can come only in the context of measurements performed at more physiologically relevant temperatures.
Figure 1.

Rhodopsin bleaching sequence near physiological temperatures in membrane. Some of the intermediates can be trapped after low-temperature photolysis, but those shown in italics, BSI (whose equilibrated mixture with Batho is sometimes called BL) and Meta I380, only build up appreciable concentrations near physiological temperatures (15, 23, 34). The time constants given are appropriate for membrane suspensions of rhodopsin near 20 °C. This general scheme also holds for detergent samples (such as DM) with the same time constants up to Lumi II formation. However, DM forward shifts both the Lumi II ⇄ Meta I380 and the Meta I480 ⇄ Meta II* equilibria so that little or no Meta I480 appears at high DM to rhodopsin ratios. Because the two Meta II forms are isochromic, their equilibrated mixture was originally referred to as metarhodopsin II. Meta II* is also called MIIa and it should be distinguished from the G protein activating form R*, also called MIIb.
Rhodopsin crystal structures have provided a valuable boundary condition on the receptor’s initial state, but much less is known about the structure of the photointermediates leading to activation (4–5). At the present time only one, low resolution, structure of a rhodopsin photointermediate has been reported (6). Most recently, 15N magic angle spinning NMR spectroscopy has been used to probe changes in key polar side chains in two later intermediates (7), but as in vibrational methods, low temperature trapping was used, so the NMR results need to be combined with data from other methods to understand physiological events. Because optical methods are capable of the highest time resolution, they are best suited to characterize the full bleaching sequence, including entropically favored photointermediates.
Proton movements are significant in rhodopsin activation, with Schiff base deprotonation and counterion neutralization being associated with the active state. These events are believed to be fairly complex since final Schiff base deprotonation has long been known to be favored by proton uptake by the protein, and at least 8 different side chains have been proposed to be involved, although many of these probably undergo changes in hydrogen bonding rather than protonation (8–11). By using an indicator dye, proton movements can be characterized simultaneously with the formation and decay of rhodopsin’s photointermediates. Optical array detectors combined with global analysis allow the spectral changes of the indicator and photointermediates to be separated much more easily than is possible when monitoring only one or two wavelengths. In our measurements, the indicator bromcresol purple reports proton uptake/release, while the kinetics and spectra of photointermediate formation and decay help to understand the hydrogen-bonding changes. Here we report results for two rhodopsin mutants, E134Q and E134R/R135E, with amino acid substitutions near cytoplasmic loop 2 which changes conformation upon activation and for two other mutants, H211F and E122Q, with substitutions of residues involved in the hydrogen bond between transmembrane helices 3 and 5 that is believed to be disrupted late in the activation process.
MATERIALS AND METHODS
Preparation of Rhodopsin Mutants
Site-directed mutagenesis of bovine opsin was carried out as previously reported (12). Opsin genes were expressed in COS-1 cells and the product protein was regenerated with 11-cis retinal. The resulting pigment was purified and concentrated as described previously (13, 14). Samples for transient absorbance measurements were solubilized in 0.1% - 0.25% (w/w) dodecyl maltoside (DM) and either 155 mM NaCl or 45 mM NaCl, 70 mM KCl and 2 mM MgCl2 (the kinetics seen here were independent of the exact neutral salt present). The data shown in Figure 2 were collected using ~450 micrograms of pigment. For measurements of proton uptake/release in parallel with the kinetics of photointermediate formation, 250 μM bromcresol purple (BCP) was added to samples from an ethanol stock solution. The pH was then adjusted to 6.3 (the pK of BCP), and in a spectrophotometer, the size of the absorbance change caused by calibrated additions of HCl or NaOH was determined. This calibration allowed us to determine how many protons were taken up or released when a given BCP spectral change was seen after photolysis of the pigment sample. The buffering capacity of the samples could be reduced by using microdialysis to remove the rhodopsin C-terminal peptide used to elute the mutant pigments from the imunoaffinity column. The λmax values of the pigments were 500 nm for E134Q and E135R/R135E, 483 nm for E122Q and 496 nm for H211F.
Figure 2.

Photointermediate kinetics and proton release in the E134R/R135E mutant of rhodopsin. The upper left panel shows the time-resolved absorbance changes observed after photolysis. Data was collected at (heavy lines) 30, 60, 120, 240, 400, 1000ns (fine lines), 10, 30, 50, 100, 150, 200, 300, 400, 800 μs, 2 and 10 ms. The increase in absorbance at 30 ns, peaking near 560 nm, is due to formation of the Batho intermediate. The increase in absorbance at 380 nm developing at the longer times is due to the final photointermediate on this time scale, Meta II. The negative absorbance change at long times near 500 nm is due to the disappearance of the pigment absorbance (and other protonated Schiff base intermediates) after photolysis. The spectral changes seen in this mutant are essentially identical to those seen after photolysis of a wild type rhodopsin sample solubilized in detergents such as dodecyl maltoside (15,20). The b-spectra obtained from the E135R/R135E mutant are presented in the upper right panel and show the spectral changes associated with each exponential time constant as determined from the global exponential fitting process (see text), and the b-spectrum labeled 0 is the time independent spectral change seen here. Points in the figure give the experimental b-spectra, and the smooth curves show the fit to the data using microscopic rate constants and model intermediate spectra determined from fitting. The observed lifetimes associated with the time dependent components (1, 2, 4 and 5) are given in Table 1. The quality of the fit to these four exponentials is shown by the residuals (difference between the actual data and fit computed using the time constants and b-spectra) plotted in the lower right panel (traces have been offset by 0.005 AU, shortest time delay is at bottom). The lower left panel shows time resolved absorbance changes seen at late times in the presence of BCP. Delay times shown are 50, 100, 200, 500 μs, 1, 2, and 10 ms. At these times, long after Batho has disappeared, the changes in the red, near 595 nm, are due to disappearance of the deprotonated form of BCP at late times (i.e. proton release by rhodopsin). The protonation changes in E134R/R135E are the opposite of what is observed under these conditions in wild type rhodopsin. For comparison of kinetics with other mutants, the 2 ms time-resolved absorbance spectra are shown as dashed lines.
Time-resolved Spectroscopy
Individual 1 μL samples were photolyzed by 7-ns (fwhm) laser pulses. The change in absorption spectrum at a particular time delay after photolysis, ranging from 30 ns to 690 ms, was measured using a gated optical multichannel analyzer (15). In most cases samples were excited using 477-nm light from a dye laser pumped by the 355-nm third harmonic of a Nd:YAG laser to avoid photolysis of bathorhodopsin, the intermediate present during the photolysis pulse for all the mutant pigments studied here. In all cases the energy delivered to the sample was 100 μJ/mm2. Absorbance changes were monitored using a flashlamp producing white probe light that was polarized at 54.7° relative to the laser polarization direction in order to minimize kinetic artifacts due to rotational diffusion. The pathlength of the probe light in the sample was 2 mm, typical pigment concentrations were ~0.5 mg/mL, and the sample temperature was maintained at 20° C. When BCP was present, unusual transient absorbance changes took place on the early microsecond time scale. It was suspected that these transient changes resulted from direct excitation of the 425 nm absorbing, protonated form of BCP by the 477 nm laser light causing it to release protons through a Förster cycle mechanism (16, 17). Such changes were subsequently seen with only BCP present and could be minimized by using 532 nm light for sample excitation. However, since the use of 532 nm light for rhodopsin excitation increases secondary photolysis and the direct excitation signal from BCP subsides within 20–50 microseconds, most measurements were made after 477 nm excitation, but analysis of the proton uptake signal started only after the direct BCP signal subsided (i.e. only 50 μs or later).
Data Analysis
The set of experimental difference spectra, {ΔA(λ,t)}, were fit as described previously (18) to a function whose form was a sum of exponential decays:
The apparent lifetimes, τi, and the difference spectra, or b-spectra, bi(λ), associated with the individual lifetimes are unambiguously determined by the fitting process (19). The number of exponentials fit was the minimum number that produced flat residual plots (see Results). If one photointermediate completely transforms into another in an exponential process, and it is well isolated in time from other processes, then the b-spectrum associated with the isolated process can be simply interpreted as the difference between the spectra of the two intermediates. However, in general a b-spectrum must be decomposed into multiple intermediate spectra consistent with the chemical mechanism (which must be determined). A procedure for finding the mechanism and determining spectra of photointermediates was described previously (19).
Data were collected initially from samples without BCP in order to determine the microscopic rate constants and photointermediate spectra as described above. Measurements were then conducted with BCP present. By using the known behavior of the previously determined photointermediates, the additional wavelength dependent signal due to the BCP could be isolated for analysis of proton uptake/release. Using the absorbance calibration of the BCP signal, the time dependent protonation changes associated with each photointermediate were then determined. Since the absorbance changes of BCP are largest near 595 nm where the deprotonated form absorbs exclusively, these were the most apparent in the data, but smaller, broader changes were present due to stronger absorption by the protonated form of BCP in the 400–450 nm region, which overlapped absorbance changes due to the photointermediates.
RESULTS
Figure 2 shows the time dependent absorbance difference spectra obtained after photoexcitation of the mutant E134R/R135E. The data at short delay times (30 ns - 1 μs) was best fit with two exponentials, with observed lifetimes 30 and 200 ns, that described decay of bathorhodopsin (Batho) through equilibrium with a blue-shifted intermediate (BSI) to form lumirhodopsin (Lumi). The similarity of b-spectra 1 and 2 in Figure 2 and their associated lifetimes to results obtained for native rhodopsin (15, lifetimes 36 and 215 ns) suggests that Batho, BSI and Lumi were not significantly affected by this mutation. The subsequent decay of E134R/R135E Lumi (1μs - 10 ms) was best fit by two exponentials with lifetimes 120 and 720 μs. The b-spectra for these processes (curves 4 and 5 in Figure 2) had similar shapes, which both report the disappearance of a protonated Schiff base species to form a deprotonated Schiff base product. This is similar to what occurs after photoexcitation of detergent suspensions of native rhodopsin where Lumi initially decays into equilibrium with the Meta I380 photointermediate followed by complete decay of Meta I380 to Meta II. While the signal-to-noise ratio achieved in measurements on this rhodopsin mutant was not high enough to resolve the three PSB decay processes seen in studies with much larger amounts of purified bovine rhodopsin, the essential similarity of PSB decay in this mutant to wild type is demonstrated by the fact that the data of Szundi et al., 1998 (20) show PSB decay to be 64% complete at a 300 μs delay after photolysis as compared to being 66% complete in the data shown here.
No process was detected after photolysis of E134R/R135E on the 20 μs time scale where native rhodopsin displays a very small spectral shift in the Lumi I to Lumi II transition. However, when the spectral shift between Lumi I and Lumi II is small and limited amounts of pigment are available, this process is difficult to detect. Data for E134R/R135E were well fit by the four time constants used here as is demonstrated by the featureless residuals plotted in the lower right panel of Figure 2. Fits with fewer exponentials than the numbers reported here produced residual plots with curvature showing that too few exponentials were fit. Fitting with more exponentials than the numbers we report did not significantly improve the residuals. Figure 2 also shows photoexcitation results for E134R/R135E in the presence of BCP, which detects protons released to or taken up from solution during photointermediate formation and decay. The BCP results are quite different from what is observed in similar preparations of native rhodopsin. For E134R/R135E bleaching is seen near the 595 nm absorption peak of the deprotonated form of BCP, indicating that proton release takes place rather than the proton uptake observed after photoexcitation of native rhodopsin. Figure 3 shows the proton release signal compared with the temporal concentration behavior of the E134R/R135E photointermediates. Results for the rhodopsin mutant E134Q (concentration profiles of photointermediates and proton signal shown in Figure 3, raw data not shown) were similar in all important features to those presented for the mutant E134R/R135E.
Figure 3.
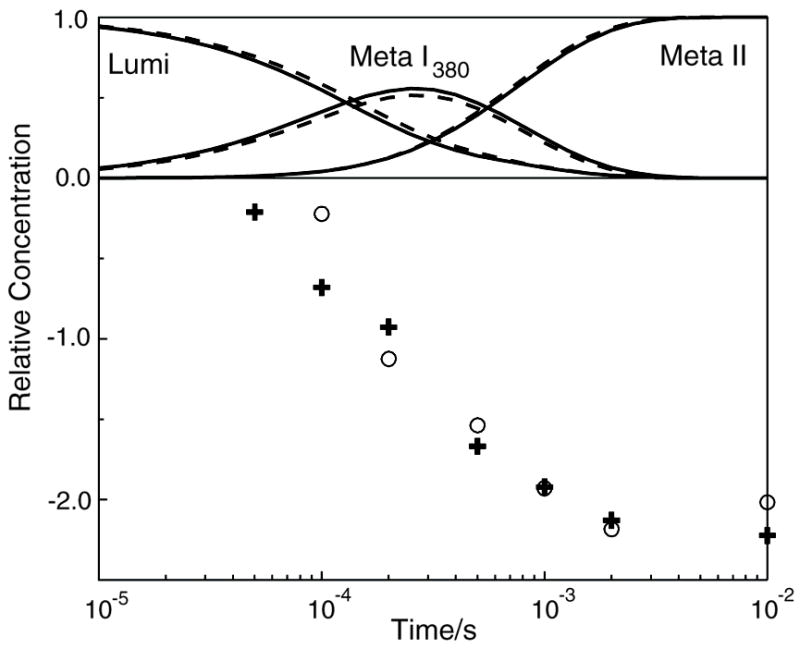
Time dependence of the concentration of photointermediates and proton release seen after photolysis of rhodopsin mutants E134R/R135E and E134Q. Curves (solid, E134R/R135E; dashed, E134Q) show the relative concentration of photointermediates that appear after photolysis, and points (+, E134R/R135E; o, E134Q) show proton changes associated with the pigments after photolysis (proton release signal at 690 ms was the same as at 10 ms, data not shown). Although the concentrations of E134R/R135E and E134Q photointermediates have time dependence very similar to those observed for wild type rhodopsin, in these mutants only proton release by the protein is seen (rather than the uptake seen for wild type rhodopsin).
Time dependent absorbance difference spectra obtained after photoexcitation of the rhodopsin mutant E122Q are shown on the left side of Figure 4. Data collected at 30 and 90 ns suggest the formation of a Batho product with stability comparable to that of native rhodopsin. Because insufficient data could be collected to resolve the two processes on this time scale, the two processes were fit with a single exponential with a lifetime of 310 ns. Data on the longer time scale (1 μs - 690 ms) were fit with three exponentials with lifetimes 180 μs, 3 and 54 ms. The b-spectra associated with these lifetimes are shown in Figure 4 in the bottom left panel. The presence of three exponentials on this time scale and the shape of the b-spectra demonstrate that E122Q Lumi decayed through a more complex process involving the Meta I480 photointermediate in addition to Meta I380 and Meta II. Again, for E122Q no process was seen in the 20 μs range corresponding to the Lumi I to Lumi II transition. The data obtained after excitation of E122Q samples containing BCP showed proton release by the pigment at early times (bleaching of the deprotonated form of BCP around 450 μs) followed by proton uptake at late times. Figure 5 plots the temporal concentrations of the photointermediates for comparison to the proton signal. Although the proton signal for E122Q is qualitatively similar to that observed for native rhodopsin, the appearance and slow decay of a small amount of Meta I480 seen after photolysis of E122Q is not seen in detergent suspensions of native rhodopsin.
Figure 4.

Photointermediate kinetics and proton release/uptake in the E122Q and H211F mutants of rhodopsin. The upper left panel shows the time-resolved absorbance changes observed after photolysis of E122Q. Data were collected at (heavy lines) 30, 90ns, (fine lines)1, 10, 50, 150, 300, 800 μs, 2, 10, 60 and 690 ms. The kinetics of Schiff base deprotonation seen after photolysis of E122Q showed significant slowing relative to wild type rhodopsin under these conditions. This is demonstrated by the time constants given in Table 1 associated with the b-spectra shown in the lower left panel (b-spectrum associated with Batho decay not shown). Time-resolved difference spectra that were collected from E122Q in the presence of BCP at delay times (fine lines) 50, 150, 450 μs, 1, 2, 5, 10, 60 and (heavy line) 690 ms are shown in the left, middle panel. For E122Q, early proton release (bleaching near 595 nm at 450 μs) followed by net proton uptake (absorbance peaking near 595 nm at 690 ms) was seen which is qualitatively similar behavior to wild type rhodopsin. The upper right panel shows the time-resolved absorbance changes observed after photolysis of H211F. Data was collected at (heavy lines) 30, 90ns, (fine lines)1, 10, 50, 300 μs, 2, 10, 30, 60 and 690 ms. The kinetics of Schiff base deprotonation seen after photolysis of H211F showed much greater slowing relative to wild type rhodopsin under these conditions than do those of E122Q. As is shown by the b-spectra in the lower right panel, for H211F the slowest component (6) which was small for E122Q and does not occur in detergent solubilized wild type rhodopsin, is the largest amplitude b-spectrum (b-spectrum associated with Batho decay not shown). In the middle, right panel time-resolved difference spectra are shown that were collected from H211F in the presence of BCP at delay times 300 μs, 2, 8, 25, 55 and 690 ms. For H211F, similarly to E135R/R135E and E134Q (data not shown) only proton release is seen. For comparison of kinetics, the 2 ms time-resolved absorbance spectra are shown as dashed lines.
Figure 5.
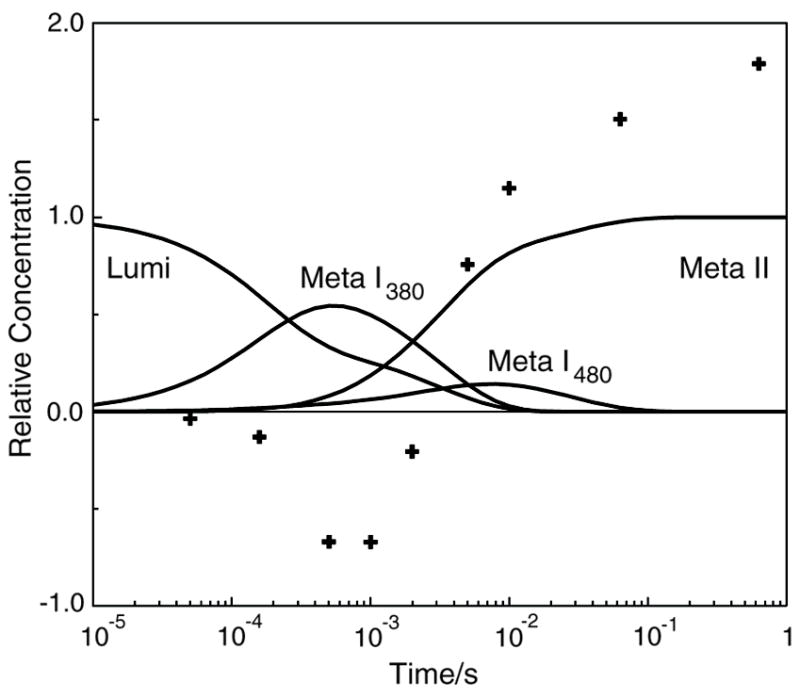
Time dependence of the concentration of photointermediates and proton release seen after photolysis of rhodopsin mutant E122Q. Curves show the relative concentration of photointermediates that appear after photolysis and points (+) show proton changes associated with the pigment after photolysis. The proton uptake data show release of at least one proton per photolyzed rhodopsin at the Meta I380 stage followed by more than 1 proton per rhodopsin uptake at Meta II.
Time dependent absorbance difference spectra obtained after photoexcitation of the rhodopsin mutant H211F are shown on the right side of Figure 4. Data collected at 30 and 90 ns suggest the formation of a Batho product with stability comparable to that of native rhodopsin. Given the focus here on later proton transfer events, further details of Lumi formation were not investigated. The sparse delay times where difference spectra were recorded did not allow us to resolve the two processes on this time scale, and only a single exponential whose lifetime 140 ns was fit to the early data. Absorbance difference spectra on the longer time scale (1 μs - 690 ms) were fit with four exponentials with lifetimes 20, 100 μs, 3.1 and 34 ms. The b-spectra associated with those lifetimes are shown in Figure 4 in the bottom right panel. The time constant and small spectral shift of the fastest process on this time scale suggest that it corresponds to the Lumi I to Lumi II transition of H211F. The b-spectra and time constants of the last three exponentials suggest that H211F Lumi II decayed primarily through the Meta I480 photointermediate to produce Meta II with only a small amount of Meta I380 being transiently formed. The data obtained after excitation of H211F samples containing BCP (right hand side of Figure 4) shows proton release similar to what was seen for E134Q and E134R/R135E. Figure 6 plots the temporal concentrations of the H211F photointermediates for comparison to its proton signal. The microscopic rate constants fit to the mechanistic scheme for each pigment are shown in Figure 7 and the photointermediate λmax’s are plotted in Figure 8.
Figure 6.
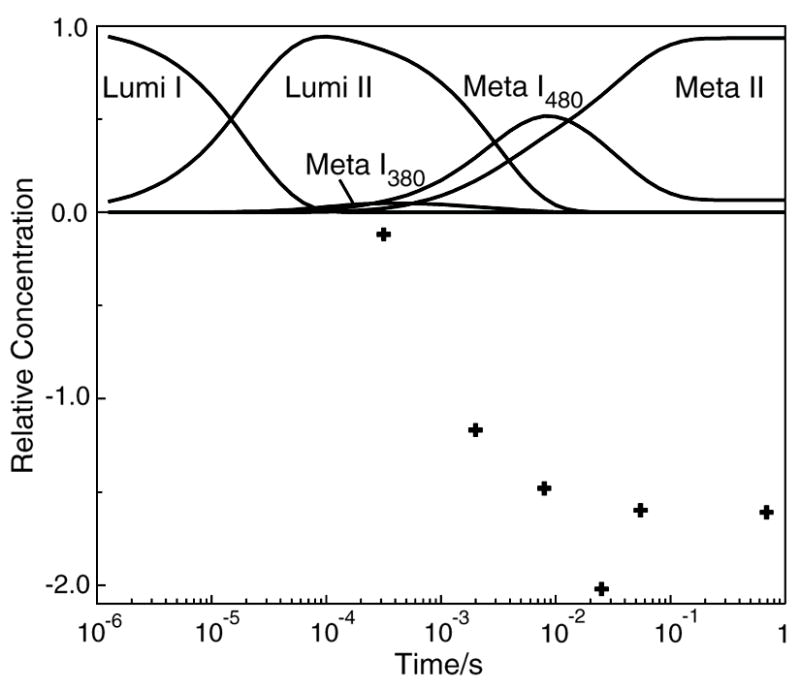
Time dependence of the concentration of photointermediates and proton release seen after photolysis of rhodopsin mutant H211F. Curves show the relative concentration of photointermediates that appear after photolysis and points (+) show proton changes associated with the pigment after photolysis. The formation of large amounts of Meta I480 seen on the time scale of 10’s of milliseconds, is an unusual feature of this mutant. At longer times, it also displays proton release in contrast to the behavior of wild type rhodopsin.
Figure 7.

Mechanistic schemes deduced for rhodopsin mutants. Data were analyzed in terms of the square scheme which describes rhodopsin in membrane suspensions. Normally, in detergent suspensions of rhodopsin, the Meta I480 photointermediate does not appear (behaving similarly to the scheme deduced here for E134R/R135E and E134Q). However, in E122Q and H211F the fuller form of the scheme prevails, as it does in membrane suspensions of rhodopsin. At temperatures below 20°C in membrane suspensions, no Meta I380 appears, similarly to what is seen for H211F here.
Figure 8.

Blue shift of rhodopsin mutant photointermediates relative to rhodopsin’s λmax (498 nm). The blue shift of the λmax values of rhodopsin’s photointermediate are indicated by “wt” in the plot, and since Meta I480 does not appear to any significant degree in DM suspensions of rhodopsin, the value of its blue shift obtained in membrane suspensions is denoted here as “wt”. Where no Lumi I - Lumi II transition was detected (E122Q, E134R/R135E and E134Q), only the undifferentiated Lumi photointermediate’s blue shift is plotted. Changes in the size of the labels denotes changes in the plotted photointermediate’s extinction coefficient. Notable here is that mutation of either Glu122 or His211 produces a large blue shift of the Lumi intermediate which persists in Meta I480.
DISCUSSION
The participation of polar and/or charged residues in the molecular mechanism of rhodopsin activation has been suggested by many mutagenesis studies as well as by the observation that Schiff base deprotonation precedes transducin activation which itself involves net proton uptake (21). Here we have studied the kinetics of the photointermediates in several rhodopsin mutants affecting ionizable amino acid side chains since mechanistic steps involving those groups should display mutation induced kinetic changes. We have also monitored proton uptake/release with BCP on the same time scale as the late photointermediates in order to determine how the mutations studied here affect proton movement in the later photointermediates.
E134R/R135E and E134Q: normal photointermediates but no proton uptake
The mutant E134R/R135E displayed kinetics indistinguishable from those of detergent solubilized, wild type rhodopsin. On the early time scale up to Lumi, this is not surprising since the site of mutation is quite far from the retinylidene chromophore in the rhodopsin crystal structure (5). The fact that the similarity extends into the kinetic region including Schiff base deprotonation is somewhat less expected since at lower temperatures, Schiff base deprotonation is closely coupled to G protein activation, and E134R/R135E does not activate transducin (22). However, at physiological temperatures or in detergent as here, two deprotonated Schiff base photointermediates, Meta I380 and Meta II* (the latter also called MIIa), are known to precede Meta II*H+, the active form (also called R* or MIIb). Thus, the similarity of E134R/R135E Meta I380 and Meta II photointermediates to those of wild type rhodopsin suggests that the structures participating in formation of those photointermediates are unperturbed by mutation and therefore that mutation blocks activation by interfering with the final, spectrally silent Meta II* to Meta II*H+ process. One way this could occur is if the E134R/R135E mutation shifted the pK of Meta II* significantly below 7 to block proton uptake to form Meta II*H+. The isospectral character of Meta II* and Meta II*H+ prevents direct observation of proton uptake, but its existence has been deduced from the pH dependence of the kinetics seen in rhodopsin membranes, where a sequence of two coupled equilibria extends to a protonated Schiff base precursor intermediate, Meta I480 (23). Here, the BCP results show the E134R/R135E mutation blocks proton uptake by Meta II* suggesting a mechanism of inactivation by this mutation, but this is not the only possible interpretation as demonstrated by the fact that E134Q, which also does not take up protons, competently activates G protein. The actual mechanism may be quite complicated and coupling between at least two protonatable groups has been proposed (24).
Originally the fact that E134Q enhanced G protein activation while preventing proton uptake was interpreted to mean that Glu134 itself protonated in forming R*. However, FTIR measurements on wild type rhodopsin do not show clear difference bands associated with protonation of Glu134 except when transducin is present (25) which suggests that Glu134 may not initially take up a proton itself, but may indirectly cause proton uptake via its influence on a closely coupled, basic residue such as its hydrogen-bonding partner Arg135. In E134Q the pK of this Glu134-associated protonation may have been shifted so that it has already occurred in the dark form of the pigment, accounting for the absence of observed proton uptake at the Meta II stage. In the case of the E134R/R135E mutant, it is not clear whether that mutation blocks proton uptake necessary for activation or whether it is prematurely protonated similarly to E134Q, but the reordering of the two residues makes the final form inactive.
As is the case for rhodopsin (20) the E134Q and E134R/R135E Meta I380 intermediates release at least one proton (here the results are closer to two). Similarly to what was concluded in the rhodopsin case, the simplest interpretation of a proton release at the Meta I380 stage is that the during early Schiff base deprotonation the proton is released directly to the aqueous phase. The significance of the release of two protons seen here at the Meta I380 stage is not clear. While it is possible that a second ionizable group besides the Schiff base could be specifically affected at Meta I380, it is equally possible that several groups could have their pK’s shifted, each producing a partial proton release. In any event, given the significant uncertainty involved in the proton uptake/release measurements (~+/−0.3 protons), any detection of whole numbers of protons here is probably coincidental. However, it should be emphasized that at long times, the difference between the ~1 proton uptake seen in wild type (20) and the ~2 protons released here by the E134Q and E134R/R135E mutants cannot be accounted for by the single proton uptake blocked by E134Q, or even less by the E134R/R135E mutation, which is formally a neutral mutation. Thus, there is great likelihood that these mutations also affect the ionization of other groups besides the ones specifically changed. This could happen, for example, if the E134Q mutation causes premature proton uptake by more than one other group in the dark e.g. Arg135 and another residue. In any event, the involvement of at least two proton uptake sites is indicated by the difference between wild type’s proton uptake and the proton release expected when the Schiff base deprotonates. Results here for proton release for E134Q at Meta II are in reasonable agreement with those previously reported (26), given the uncertainties and the differences between the temperature and initial pH of the two measurements.
E122Q: perturbed late photointermediates, proton uptake present
Even though Glu122 is much closer to the retinylidene chromophore than Glu134, and is the most closely chromophore-coupled mutation studied here, E122Q Batho still appears to have normal stability. Significant perturbations of the chromophore (27) or mutations near the 5-methyl of the β-ionone ring (28) are known to destabilize Batho. However, E122Q is an isosteric mutation, so at early times it results in minimal kinetic effect even though it is only ~4 Å from the ring. This agrees with the idea that steric factors control events leading to Lumi formation (29) and that, although there are possible hydrogen-bonding perturbations associated with the glutamic acid to glutamine substitution, the position of the side chain is not dramatically affected by this mutation, and apparently no charge change is introduced by it, which is consistent with FTIR measurements which identify Glu122 as neutral in rhodopsin (30). In contrast to the lack of effect on Lumi formation, the E122Q mutation significantly slows deprotonation of the Schiff base. This can be seen directly in the time resolved absorbance data in Figure 4 and by comparing the microscopic rate constants in Figure 7 governing the E122Q Lumi - Meta I380 equilibrium with those for E134Q and E134R/R135E, which are similar to those of wild type rhodopsin.
In effect, the E122Q mutation shifts the balance in the square scheme (Figure 1) from the path normally seen in detergent solubilized rhodopsin (across the top and down the right side, through Meta I380) back toward what is seen in membrane suspensions of rhodopsin (down the left side and across the bottom, through Meta I480). This suggests that the isosteric nature of glutamine is no longer sufficient to stabilize Lumi and that stronger interactions between the chromophore and Glu122 exist at the Lumi stage that depend on the detailed nature of the 122 side chain, as for example its exact hydrogen-bonding character. Apparently some specific structural characteristic of Glu122 catalyzes Schiff base deprotonation and stabilizes the deprotonated form of the Schiff base, especially in Meta I380. However, ultimately the Schiff base does deprotonate in E122Q (analogously to rhodopsin in membrane suspensions at physiological temperatures), and our BCP data show that proton uptake at late times associated with transducin activation in E122Q is present. This suggests that Glu122 is not itself a proton uptake group, but its mutation affects protonation of other groups. The control of other protonatable residues is similar to the case of E134Q where mutation of a single residue blocks two or more protons from being taken up. Qualitatively, the slowing of Schiff base deprotonation we see in E122Q is consistent with the observation that Glu122 stabilizes Meta II (9), but the full proton uptake seen here in E122Q, indicates that the character of that stabilization does not come through direct participation of Glu122 in Meta II proton uptake.
Another unusual feature of E122Q is the large blue shift of its Lumi and Meta I480 photointermediates, compared to what is seen after photolysis of wild type rhodopsin. Since the spectra of retinylidene protonated Schiff bases blue shift as the counterion moves closer to the PSB, a simple interpretation of this observation would be that some hydrogen-bond network involving Glu122 maintains the distance between the PSB and counterion and that in E122Q some defect in the hydrogen bonding allows closer approach. This is of interest since it has recently been proposed that in Meta II the chromophore β-ionone ring has moved 4–5 Å toward helix 5, disrupting the hydrogen bond between Glu122’s carboxyl and the backbone carbonyl of His211 (see Figure 9, 7, 31). The spectral blue shift seen in E122Q Lumi and Meta I480 may suggest that the normal hydrogen bonding of Glu122 is important in regulating that movement at an earlier stage. However, the fact that E122Q ultimately forms Meta II, which displays proton uptake and is capable of activating transducin, shows that after some perturbation of the late protonated Schiff base photointermediates the mutation does not disable the receptor. 3 Interestingly, Glu122 is not preserved in cone pigments and the difference has been proposed to be responsible for the faster Meta II decay seen in those pigments (32,33).
Figure 9.

Hydrogen bonds involving side chains of Glu122 and His211. Fragments of rhodopsin helices 3 (red), 4 (orange) and 5 (yellow) are shown in relationship to the retinylidene chromophore (green). Shown by dotted lines are hydrogen bonds proposed to exist from Glu122 to the backbone carbonyl of His211 (2.8 Å) and to the side chain of Trp126 (3.1 Å). Also shown by a dotted line is the proposed rhodopsin hydrogen bond from the side chain of His211 to the hydroxyl of Tyr206 (2.9 Å). The distance from the hydroxyl of Tyr206 to the non-helical backbone carbonyl of Ala166 (2.6 Å) is shown by a solid line. Note that if His211 is unprotonated, Tyr206 can participate in only one of these potential hydrogen bonds. Also of interest is that the distance from His211 to Trp126 (3.3 Å) is only slightly greater than from Glu122. The coordinates used to generate this view were derived from molecule A of Li 3 et al. (5).
H211F: late photointermediate equilibria are membrane-like, no proton uptake
Similar to the other rhodopsin mutants studied here, the H211F mutation had minimal effect on the photointermediates preceding Lumi. This is consistent with the fact that the side chain of His211 is more distant from the chromophore β-ionone ring than is Glu122 and that again a fairly isosteric substitution was made. Although the kinetics of Lumi formation show no large perturbation, the properties of the H211F Lumi intermediate were strongly affected by this mutation. In contrast to the other mutants studied here, in H211F a time dependent spectral shift occurs on the same time scale as the Lumi I - Lumi II transition that has been observed in native rhodopsin (34). Although small amounts of pigment were used here, the Lumi I - Lumi II transition was detectable because the red-shift in going from H211F Lumi I to H211F Lumi II was twice as large as it is in rhodopsin (464 nm and 467 nm for H211F versus 488.5 nm and 490 nm for rhodopsin, 34). Even more distinctive is the fact that both H211F Lumi intermediates are dramatically blue shifted compared with the Lumi intermediates that appear in native rhodopsin (see Figure 8). A similar blue shift was seen for E122Q Lumi described above, but the blue shift in the H211F Lumi intermediates is much more pronounced, particularly when these shifts are compared to the respective pigment absorption maxima. Apparently both these mutations act similarly, but paradoxically the largest spectral shift occurs in the H211F mutant where the side chain modification is approximately twice as far from the chromophore β-ionone ring as it is for E122Q, which suggests that the inability of the phenylalanine side chain in H211F to meet the hydrogen-bonding requirements of the native histidine becomes significant at the Lumi stage and has a larger effect than the more limited hydrogen-bonding deficiencies produced by a glutamic acid to glutamine substitution closer to the chromophore. Figure 9 shows hydrogen-bonding possibilities in the vicinity of these two side chains. The only His211 side chain hydrogen bond in rhodopsin is to Tyr206 and the results presented here suggest that the breaking of this bond could contribute to the blue shift in going from Lumi to Meta I480.
Besides the pronounced effect the H211F mutation has on the Lumi spectrum, an unusually large amount of Meta I480 subsequently makes its appearance and persists for tens of milliseconds. This is again similar to what was seen in E122Q, but occurs to a greater degree. Remarkably, final deprotonation of the Schiff base in H211F is slower than normally occurs in native rhodopsin membrane suspensions instead of the factor of 100 faster that is typical for detergent solubilized preparations (compare data for H211F to what is seen here for E134R/R135E, which is very similar to rhodopsin). Clearly some feature of His211 acts to catalyze Schiff base deprotonation similarly to Glu122 but to a much larger degree. Given that a limited effect is seen in E122Q, which has perturbed hydrogen-bonding potential, while the effect is maximal in H211F, where no side chain hydrogen bonds are possible, to achieve a normal Lumi spectrum one of these two groups may be required to rearrange their hydrogen bonding beginning at Lumi from what prevails in the dark form of the pigment. Both residues may need to reach a specific hydrogen-bonding arrangement to achieve timely Schiff base deprotonation. While changes in the vicinity of H211 at a stage as early as the Lumi intermediate may be unexpected, they are consistent with the fact that the side chain of H211 is near the base of helix 4 where a phototagging reagent has been found to transfer from the β-ionone ring to Ala169 at Lumi (35).
Although the lack of proton uptake in H211F seen here agrees with previous observations of the effect of H211F on the pH dependence of the Meta I480 - Meta II equilibrium and would be consistent with His211 directly taking up a proton in the activation process, recent NMR results have suggested that His211 remains unprotonated in Meta II (7). Thus, the interpretation of the effect of the mutations studied here, both the suppression of proton uptake by a second group resulting from the E134Q and E134R/R135E mutations and the elimination of at least two protons taken up by the H211F mutation, must involve one or more residues connected to both positions 134 and 211. His152 is a strong candidate since it is conserved and is also known to affect the pK of the Meta I480 - Meta II equilibrium (8). Further, its pK has been predicted by molecular dynamics to be 5.7 (36), a value that would make it eligible for proton uptake if structural changes in the photointermediates affected its aqueous exposure near the cytoplasmic side of helix 4. As discussed above, and shown in Figure 9, His211 could plausibly cause such changes through hydrogen-bonding rearrangement near the base of helix 4. Further, His152 is near the beginning of cytoplasmic loop 2, which is known to be involved in transducin activation. The other end of loop 2 terminates near Glu134, another site of proton uptake, as discussed above. Connection through that loop could provide a path for the H211F mutation to affect proton uptake by the Glu134 associated site as well, accounting for the net proton release seen here.
Is reorganization of hydrogen bonding between helices 3, 4 and 5 normally coupled to the membrane?
A remarkable thing about the slow Schiff base deprotonation seen here in E122Q and even slower deprotonation in H211F is the mechanistic similarity to what is seen in membrane suspensions of rhodopsin. Solubilization in detergents like DM is well known to remove some constraint that opposes Schiff base deprotonation. The effect of detergent is especially pronounced at the Meta I480 stage where FTIR results have shown that significant differences exist between phospholipid vesicle and DM preparations in the amide I vibration (1662 cm−1) and carbonyl of carboxylic acid (near 1700 cm−1) regions (37). The same FTIR study concluded that Glu122 in Meta I480 significantly changes its hydrogen-bonding environment in a way affected either directly by His211 or indirectly through an unspecified intermediary, hydroxyl containing side chain. The breaking of the His211 - Tyr206 hydrogen bond and formation of one to the backbone carbonyl of Ala166 could account for this structural feature of Meta I480.
The kinetic results for the E122Q and H211F mutants studied here are consistent with a model where reorganization of hydrogen bonding into a specific structure involving Glu122 and especially His211 constitute an important transition state for Meta II formation. Apparently, achieving this transition state is normally opposed by the phospholipid bilayer. Presumably the His211 side chain needs to form new hydrogen bonds, possibly including one with Trp126 to help break the hydrogen bond between its backbone carbonyl and Glu122, in the transition state for Meta II formation. A change in the polarity of the Trp126 environment has previously been proposed to contribute to ultraviolet absorbance differences that appear during rhodopsin activation (38, 39). Breaking the Glu122 - His211 backbone carbonyl hydrogen bond and formation of a new one to the His211 ring could pull Glu122 out of the way of the chromophore β-ionone ring, triggering the ring-chain displacement toward helix 5 at Meta II seen in 15N NMR studies. Such a model can account for both our observations of a decreased rate of Meta I480 decay and the FTIR observations on the Meta I480 hydrogen-bonding changes in these rhodopsin mutants.
The model also is consistent with slower kinetics in membrane since the search for the specific transition state would be slower in a more constrained environment, as exists in membrane. However, while FTIR and NMR data are useful in understanding the Meta I480 decay path, in the absence of more detailed information from FTIR studies of Lumi in these rhodopsin mutants, the origin of their corresponding stabilization of the PSB at the Lumi stage (relative to Meta I380) is less clear. Since deprotonation of the Schiff base to form Meta I380 may take place directly to water, the stabilization by these less polar mutants may simply result from their reduced polarity generally stabilizing the hydrophobic core relative to the more permeable condition that presumably exists when interior hydrogen bonds are broken or strained. A more specific stabilization of the PSB in Lumi could result from premature formation of a Tyr206 - Ala166 backbone carbonyl if this could be shown to exist. Unfortunately, FTIR methods do not have sufficient time resolution to characterize the Meta I380 intermediate, but the presence of similar hydrogen-bonding patterns at Lumi temperatures in these mutants could suggest a similar mechanism of stabilization of this PSB intermediate.
The idea that Schiff base deprotonation takes place directly to water at the Lumi stage is compatible with the observation that Meta I380 is favored both by detergents and by higher temperatures in membrane suspensions of rhodopsin. Penetration of water into the hydrophobic region should be increased by both these factors since they disrupt the rigidity of the phospholipid bilayer environment. As a final note, it is intriguing to consider the fact that other changes in membrane properties produce the opposite effect from detergent solubilization, with the presence of short chain, saturated lipids (40) or cholesterol like substances (41,42) opposing Schiff base deprotonation. In light of this opposite tendency, it is interesting to note that in two dimensional crystals of rhodopsin, which also strongly favor the protonated Schiff base (6), a binding site for cholesterol has been found, and it is very near the top of helix 4, a region the proton uptake results for the mutants studied here suggest could be an important locus for proton uptake. Recent structural models have proposed that helices 1–4 form a fairly rigid structural unit (43). Given this emerging picture and its logical complement, it not surprising to find that an important site of functional reorganization of hydrogen bonds, showing sensitivity to the membrane environment, occurs near the end of this structure at helix 4. Another important hydrogen-bonded network occurs at the opposite end of the proposed helix 1–4 rigid structure (44), involving amino acid side chains and bound water molecules that possibly link the chromophore to the NP(x)2Y(x)6F domain at the top of helix 7. Future studies of the kinetic and spectral changes produced by modification of polar residues in that region will be required to complete the picture of hydrogen-bond reorganization and proton transfer in GPCR activation begun here.
TABLE 1.
Observed lifetimes obtained from fitting time-resolved absorbance difference spectra in the absence of BCP
| Pigment | τ1 (ns) | τ2 (ns) | τ3 (μs) | τ4 (μs) | τ5 (μs) | τ6 (ms) |
|---|---|---|---|---|---|---|
| E134R/R135E | 30 | 200 | a | 120 | 720 | b |
| E122Q | 310c | a | 180 | 3000 | 54 | |
| H211F | 140c | 20 | 100 | 3100 | 34 | |
| E134Q | 225c | a | 130 | 690 | b | |
No kinetic component was observed on the Lumi I - Lumi II time scale.
No slow component was detected.
Insufficient time points were collected to resolve two exponentials on the Batho decay time scale.
Acknowledgments
We thank Thomas Huber for helpful discussion of the hydrogen-bonded structures in rhodopsin.
This work was supported by Grant EY00983 from the National Eye Institute of the National Institutes of Health (to D.S.K.) and by the Allene Reuss Memorial Trust (T.P.S.).
Abbreviations
- Batho
bathorhodopsin
- BCP
bromcresol purple
- BSI
blue-shifted intermediate
- GPCR
G protein-coupled receptor
- DM
n-dodecyl-β-D-maltoside
- Lumi
lumirhodopsin
- Meta
metarhodopsin
- PSB
protonated Schiff base
- WT
wild type
References
- 1.Vogel R, Siebert F. Fourier transform IR spectroscopy study for new insights into molecular properties and activation mechanisms of visual pigment rhodopsin. Biopolymers. 2003;72:133–148. doi: 10.1002/bip.10407. [DOI] [PubMed] [Google Scholar]
- 2.Pan DH, Mathies RA. Chromophore structure in lumirhodopsin and metarhodopsin I by time-resolved resonance Raman microchip spectroscopy. Biochemistry. 2001;40:7929–7936. doi: 10.1021/bi010670x. [DOI] [PMC free article] [PubMed] [Google Scholar]
- 3.Pan DH, Ganim Z, Kim JE, Verhoeven MA, Lugtenburg J, Mathies RA. Time-resolved resonance Raman analysis of chromophore structural changes in the formation and decay of rhodopsin’s BSI intermediate. J Am Chem Soc. 2002;124:4857–4864. doi: 10.1021/ja012666e. [DOI] [PMC free article] [PubMed] [Google Scholar]
- 4.Okada T, Sugihara M, Bondar AN, Elstner M, Entel P, Buss V. The retinal conformation and its environment in rhodopsin in light of a new 2.2 angstrom crystal structure. J Mol Biol. 2004;342:571–583. doi: 10.1016/j.jmb.2004.07.044. [DOI] [PubMed] [Google Scholar]
- 5.Li J, Edwards PC, Burghammer M, Villa C, Schertler GFX. Structure of bovine rhodopsin in a trigonal crystal form. J Mol Biol. 2004;343:1409–1438. doi: 10.1016/j.jmb.2004.08.090. [DOI] [PubMed] [Google Scholar]
- 6.Ruprecht JJ, Mielke T, Vogel R, Villa C, Schertler GFX. Electron crystallography reveals the structure of metarhodopsin I. EMBO J. 2004;23:3609–3620. doi: 10.1038/sj.emboj.7600374. [DOI] [PMC free article] [PubMed] [Google Scholar]
- 7.Patel AB, Crocker E, Reeves PJ, Getmanova EV, Eilers M, Khorana HG, Smith SO. Changes in interhelical hydrogen bonding upon rhodopsin activation. J Mol Biol. 2005;347:803–812. doi: 10.1016/j.jmb.2005.01.069. [DOI] [PubMed] [Google Scholar]
- 8.Weitz CJ, Nathans J. Histidine residues regulate the transition of photoexcited rhodopsin to its active conformation, metarhodopsin II. Neuron. 1992;8:465–472. doi: 10.1016/0896-6273(92)90274-h. [DOI] [PubMed] [Google Scholar]
- 9.Weitz CJ, Nathans J. Rhodopsin activation: effects on the metarhodopsin I - metarhodopsin II equilibrium of neutralization or introduction of charged amino acids within putative transmembrane segments. Biochemistry. 1993;32:14176–14182. doi: 10.1021/bi00214a016. [DOI] [PubMed] [Google Scholar]
- 10.Yan ECY, Kazmi MA, De S, Chang BSW, Seibert C, Marin EP, Mathies RA, Sakmar TP. Function of extracellular loop 2 in rhodopsin: Glutamic acid 181 modulates stability and absorption wavelength of metarhodopsin II. Biochemistry. 2002;41:3620–3627. doi: 10.1021/bi0160011. [DOI] [PMC free article] [PubMed] [Google Scholar]
- 11.Yan ECY, Kazmi MA, Ganim Z, Hou J-M, Pan D, Chang BSW, Sakmar TP, Mathies RA. Retinal counterion switch in the photoactivation of the G protein coupled receptor rhodopsin. Proc Natl Acad Sci (USA) 2003;100:9262–9267. doi: 10.1073/pnas.1531970100. [DOI] [PMC free article] [PubMed] [Google Scholar]
- 12.Chan T, Lee M, Sakmar TP. Introduction of hydroxyl-bearing amino acids causes bathochromic spectral shifts in rhodopsin. Amino acid substitutions responsible for red-green color pigment spectral tuning. J Biol Chem. 1992;267:9478–80. [PubMed] [Google Scholar]
- 13.Fahmy K, Sakmar TP. Light-dependent transducin activation by an ultraviolet-absorbing rhodopsin mutant. Biochemistry. 1993;32:9165–9171. doi: 10.1021/bi00086a023. [DOI] [PubMed] [Google Scholar]
- 14.Zvyaga TA, Fahmy K, Sakmar TP. Characterization of rhodopsin-transducin interaction - a mutant rhodopsin photoproduct with a protonated Schiff base activates transducin. Biochemistry. 1994;33:9753–9761. doi: 10.1021/bi00198a046. [DOI] [PubMed] [Google Scholar]
- 15.Lewis JW, Kliger DS. Absorption spectroscopy in studies of visual pigments: Spectral and kinetic characterization of intermediates. Meth Enzymol. 2000;315:164–178. doi: 10.1016/s0076-6879(00)15842-2. [DOI] [PubMed] [Google Scholar]
- 16.Förster T. Fluoreszenzspektrum und Wasserstoffionenkonzentration. Naturwiss. 1949;36:186–187. [Google Scholar]
- 17.Jaffé HH, Jones HL. Excited state pK values. III. The application of the Hammett equation. J Org Chem. 1965;30:964–969. [Google Scholar]
- 18.Hug SJ, Lewis JW, Einterz CM, Thorgeirsson TE, Kliger DS. Nanosecond photolysis of rhodopsin: evidence for a new, blue-shifted intermediate. Biochemistry. 1990;29:1475–1485. doi: 10.1021/bi00458a019. [DOI] [PubMed] [Google Scholar]
- 19.Szundi I, Lewis JW, Kliger DS. Deriving reaction mechanisms from kinetic spectroscopy. Application to late rhodopsin intermediates. Biophys J. 1997;73:688–702. doi: 10.1016/S0006-3495(97)78103-7. [DOI] [PMC free article] [PubMed] [Google Scholar]
- 20.Szundi I, Mah TL, Lewis JW, Jäger S, Ernst OP, Hofmann KP, Kliger DS. Proton transfer reactions linked to rhodopsin activation. Biochemistry. 1998;37:14237–14244. doi: 10.1021/bi981249k. [DOI] [PubMed] [Google Scholar]
- 21.Menon ST, Han M, Sakmar TP. Rhodopsin: structural basis of molecular physiology. Physiol Rev. 2001;81:1659–1688. doi: 10.1152/physrev.2001.81.4.1659. [DOI] [PubMed] [Google Scholar]
- 22.Sakmar TP, Franke RR, Khorana HG. Glutamic acid-113 serves as the retinylidene Schiff base counterion in bovine rhodopsin. Proc Natl Acad Sci USA. 1989;86:8309–8313. doi: 10.1073/pnas.86.21.8309. [DOI] [PMC free article] [PubMed] [Google Scholar]
- 23.Jäger S, Szundi I, Lewis JW, Mah TL, Kliger DS. Effects of pH on rhodopsin photointermediates from lumirhodopsin to metarhodopsin II. Biochemistry. 1998;37:6998–7005. doi: 10.1021/bi9728194. [DOI] [PubMed] [Google Scholar]
- 24.Kuwata O, Yuan C, Misra S, Govindjee R, Ebrey TG. Kinetics and pH dependence of light-induced deprotonation of the Schiff base of rhodopsin: Possible coupling to proton uptake and formation of the active form of Meta II. Biochemistry (Moscow) 2001;66:1588–1608. doi: 10.1023/a:1013139520437. [DOI] [PubMed] [Google Scholar]
- 25.Fahmy K, Sakmar TP, Siebert F. Transducin -dependent protonation of glutamic acid 134 in rhodopsin. Biochemistry. 2000;39:10607–10612. doi: 10.1021/bi000912d. [DOI] [PubMed] [Google Scholar]
- 26.Arnis S, Fahmy K, Hofmann KP, Sakmar TP. A conserved carboxylic acid group mediates light-dependent proton uptake and signaling by rhodopsin. J Biol Chem. 1994;269:23879–23881. [PubMed] [Google Scholar]
- 27.Randall CE, Lewis JW, Hug SJ, Björling SC, Eisner-Shanas I, Friedman N, Ottolenghi M, Sheves M, Kliger DS. A new photolysis intermediate in artificial and native visual pigments. J Am Chem Soc. 1991;113:3473–3485. [Google Scholar]
- 28.Jäger S, Han M, Lewis JW, Szundi I, Sakmar TP, Kliger DS. Properties of early photolysis intermediates of rhodopsin are affected by glycine 121 and phenylalanine 261. Biochemistry. 1997;36:11804–11810. doi: 10.1021/bi971122f. [DOI] [PubMed] [Google Scholar]
- 29.Lewis JW, Fan GB, Sheves M, Szundi I, Kliger DS. Steric barrier to bathorhodopsin decay in 5-demethyl and mesityl analogues of rhodopsin. J Am Chem Soc. 2001;123:10024–10029. doi: 10.1021/ja010724q. [DOI] [PubMed] [Google Scholar]
- 30.Fahmy K, Jäger F, Beck M, Zvyaga TA, Sakmar TP, Siebert F. Protonation states of membrane-embedded carboxylic-acid groups in rhodopsin and metarhodopsin-ii - a Fourier-transform infrared-spectroscopy study of site-directed mutants. Proc Natl Acad Sci USA. 1993;90:10206–10210. doi: 10.1073/pnas.90.21.10206. [DOI] [PMC free article] [PubMed] [Google Scholar]
- 31.Patel AB, Crocker E, Eilers M, Hirshfeld A, Sheves M, Smith SO. Coupling of retinal isomerization to the activation of rhodopsin. Proc Natl Acad Sci USA. 2004;101:10048–10053. doi: 10.1073/pnas.0402848101. [DOI] [PMC free article] [PubMed] [Google Scholar]
- 32.Imai H, Kojima D, Oura T, Tachibanaki S, Terakita A, Shichida Y. Single amino acid residue as a functional determinant of rod and cone visual pigments. Proc Natl Acad Sci (USA) 1997;94:2322–2326. doi: 10.1073/pnas.94.6.2322. [DOI] [PMC free article] [PubMed] [Google Scholar]
- 33.Kuwayama S, Imai H, Morizumi T, Shichida Y. Amino acid residues responsible for the Meta III decay rates in rod and cone visual pigments. Biochemistry. 2005;44:2208–2215. doi: 10.1021/bi047994g. [DOI] [PubMed] [Google Scholar]
- 34.Szundi I, Lewis JW, Kliger DS. Two intermediates appear on the lumirhodopsin time scale after rhodopsin photoexcitation. Biochemistry. 2003;42:5091–5098. doi: 10.1021/bi0206964. [DOI] [PubMed] [Google Scholar]
- 35.Borhan B, Souto ML, Imai H, Shichida Y, Nakanishi K. Movement of retinal along the visual transduction path. Science. 2000;288:2209–2212. doi: 10.1126/science.288.5474.2209. [DOI] [PubMed] [Google Scholar]
- 36.Periole X, Ceruso MA, Mehler EL. Acid-base equilibria in rhodopsin: Dependence of the protonation state of Glu134 on its environment. Biochemistry. 2004;43:6858–6864. doi: 10.1021/bi049949e. [DOI] [PubMed] [Google Scholar]
- 37.Beck M, Sakmar TP, Siebert F. Spectroscopic evidence for interaction between transmembrane helices 3 and 5 in rhodopsin. Biochemistry. 1998;37:7630–7639. doi: 10.1021/bi9801560. [DOI] [PubMed] [Google Scholar]
- 38.Lin SW, Sakmar TP. Specific tryptophan UV-absorbance changes are probes of the transition of rhodopsin to its active state. Biochemistry. 1996;35:11149–11159. doi: 10.1021/bi960858u. [DOI] [PubMed] [Google Scholar]
- 39.Sakmar TP, Menon ST, Marin EP, Awad ES. Rhodopsin: Insights from recent structural studies. Annu Rev Biophys Biomol Struct. 2002;31:443–484. doi: 10.1146/annurev.biophys.31.082901.134348. [DOI] [PubMed] [Google Scholar]
- 40.Baldwin PA, Hubbell WL. Effects of lipid environment on the light-induced conformational-changes of rhodopsin. 2 Roles of lipid chain-length, unsaturation, and phase state. Biochemistry. 1985;24:2633–2639. doi: 10.1021/bi00332a007. [DOI] [PubMed] [Google Scholar]
- 41.Niu SL, Mitchell DC, Litman BJ. Manipulation of cholesterol levels in rod disk membranes by methyl-β-cyclodextrin. J Biol Chem. 2002;277:20139–20145. doi: 10.1074/jbc.M200594200. [DOI] [PubMed] [Google Scholar]
- 42.Schleicher A, Franke R, Hofmann KP, Finkelmann H, Welte W. Deoxylysolecithin and a new biphenyl detergent as solubilizing agents for bovine rhodopsin. Functional test by formation of metarhodopsin II and binding of G-protein. Biochemistry. 1987;26:5908–5916. doi: 10.1021/bi00392a050. [DOI] [PubMed] [Google Scholar]
- 43.Liu W, Eilers M, Patel AB, Smith SO. Helix packing moments reveal diversity and conservation in membrane protein structure. J Mol Biol. 2004;337:713–729. doi: 10.1016/j.jmb.2004.02.001. [DOI] [PubMed] [Google Scholar]
- 44.Nagata T, Terakita A, Kandori H, Shichida Y, Maeda A. The hydrogen- bonding network of water molecules and the peptide backbone in the region connecting Asp83, Gly120, and Glu113 in bovine rhodopsin. Biochemistry. 1998;37:17216–17222. doi: 10.1021/bi9810149. [DOI] [PubMed] [Google Scholar]