

Abstract
The partitioning of lipids among different microenvironments in a bilayer is of considerable relevance to characterization of composition variations in biomembranes. Atomistic simulation has been ill-suited to model equilibrated lipid mixtures because the time required for diffusive exchange of lipids among microenvironments exceeds typical submicrosecond molecular dynamics trajectories. A method to facilitate local composition fluctuations, using Monte Carlo mutations to change lipid structures within the semigrand-canonical ensemble (at a fixed difference in component chemical potentials, Δμ), was recently implemented to address this challenge. This technique was applied here to mixtures of dimyristoylphosphatidylcholine and a shorter-tail lipid, either symmetric (didecanoylphosphatidylcholine (DDPC)) or asymmetric (hexanoyl-myristoylphosphatidylcholine), arranged in two types of structure: bilayer ribbons and buckled bilayers. In ribbons, the shorter-tail component showed a clear enrichment at the highly curved rim, more so for hexanoyl-myristoylphosphatidylcholine than for DDPC. Results on buckled bilayers were variable. Overall, the DDPC content of buckled bilayers tended to exceed by several percent the DDPC content of flat ones simulated at the same Δμ, but only for mixtures with low overall DDPC content. Within the buckled bilayer structure, no correlation could be resolved between the sign or magnitude of the local curvature of a leaflet and the mean local lipid composition. Results are discussed in terms of packing constraints, surface area/volume ratios, and curvature elasticity.
INTRODUCTION
The equilibrium lateral distribution of lipids of different molecular structure across the different microenvironments found in a biomembrane is a topic of general biophysical interest. Inhomogeneities in lipid composition may arise through the inherent interactions of lipids and sterols that drive domain or “raft” formation (1–3) or through preferential association of particular lipid types with sites or areas close to membrane proteins (4,5). One important environmental factor is local curvature of the bilayer surface, which varies greatly within and among cell and organelle membranes. Although the control of local bilayer curvature by proteins (6,7) and the coupling of curvature and phase separation in micron-scale domains (8) have received recent attention, highly localized variations in lipid composition may also be important in stabilizing strongly curved membranes, either transient structures such as fusion pores or long-lived structures such as folded mitochondrial membranes. In a mixture of freely diffusing lipids at equilibrium, the different packing constraints imposed by local curvature variations will lead to local enrichment of lipids whose structures allow them to adapt to those constraints with lower free energy than their counterparts.
In this study, we consider binary mixtures of glycerophospholipids that have identical phosphatidyl choline (PC) headgroups but differ in the lengths of one or both acyl chains. A recently reported (9) semigrand-canonical ensemble mixed Monte Carlo/molecular dynamics (MCMD) method allows the equilibration of the lateral distribution of different lipid types in these systems, which is impractically slow via conventional molecular dynamics simulation using atomistic or united-atom models. The MCMD approach relies on Monte Carlo mutation moves to transform lipid molecules from one type to another—in this case, by extending or shortening the tail lengths. Through these mutation moves, equilibrium is established directly for each lipid with a pair of virtual reservoirs of the two lipid types. The difference in chemical potential (Δμ) between these virtual reservoirs is fixed during the simulation. Because exchanges with the same pair of virtual reservoirs determine the lipid composition at every position throughout the system, the system approaches equilibrium with respect to exchanging lipids between different sites at a rate that does not depend on the rate of mixing through lateral diffusion.
In our previous MCMD simulations (9), the lateral distribution of PC lipids differing in tail length by four methylene groups in both tails showed no detectable deviation from random mixing in fluid-phase mixed-lipid bilayers. No tendencies for like or unlike lipids to cluster or form neighboring pairs, either within or across leaflets, were seen. Here, we investigate the possibility of demixing driven by local environmental differences in systems exhibiting local curvature heterogeneity: bilayer ribbons, whose edges are characterized by a very tight radius of curvature of the order of the molecular thickness, and uniaxially buckled bilayers, which have regions of both positive and negative local curvature.
Pure bilayer ribbons have been investigated through simulation at the atomistic (10–12) and coarse-grained (13) levels. We have specifically investigated tail-length-dependent demixing associated with the bilayer edge using coarse-grained models (14,15). In general, the shorter-tail component was seen to favor the bilayer edge, consistent with the trend expected from experiments on “bicelle” mixtures of dimyristoylphosphatidylcholine (DMPC) and dihexanoylphosphatidylcholine (DHPC) (16,17). An advantage of the ribbon geometry is that it allows determination of the edge stability, as the line tension can be related to the pressure anisotropy in the system. Addition of a component that favors the edge (an “edge-actant” (18)) is associated with a drop in line tension, just as addition of a molecule that is enriched at a two-dimensional interface lowers interfacial surface tension.
Curvature effects leading to asymmetry in bilayer leaflet composition are usually measured through experiments on small vesicles. Typically, the curvature is varied by preparing vesicles of different size while the inner and outer leaflet compositions are determined through exposure to an external, nonbilayer-permeating agent (19–21). We have used a different approach to generate a curved bilayer. Compressing a (periodically repeated) bilayer sheet along one direction yields a buckled structure with a roughly sinusoidal cross section, with a degree of curvature (albeit nonuniform and confined to one direction) that is determined by the degree of compression. Although the buckled bilayer geometry may not represent an experimentally accessible structure, it offers some practical advantages over the vesicle geometry for our purposes. The greatest advantage is that a curved structure can be achieved in a buckled bilayer using many fewer lipid and solvent molecules than for even a small vesicle, which requires enormous computational resources to model at the atomistic level (22). Second, in contrast to the vesicle, the buckled bilayer does not require transmembrane lipid flip-flop to change the balance of lipids between negatively curved and positively curved areas: each leaflet of the buckled bilayer includes both positively and negatively curved regions that can exchange lipids through expansion or contraction. This is important, especially as compositions are changing, to allow the area per headgroup to equilibrate independently in different environments. The third advantage of the buckled bilayer geometry is that the curvature elasticity can in principle be related to the buckling pressure (23,24).
Asymmetry in lipid composition of the inner and outer leaflets of small fluid-phase vesicles has been observed for mixed lipids with different headgroups (19,20) and, in the presence of cholesterol, for lipids with different degrees of tail saturation (21). Curvature-driven demixing according to tail length in the fluid phase has not been reported to our knowledge. Experimental evidence that the inner leaflet of a single-component PC vesicle is significantly thinner than the outer leaflet (25) led us to predict that curvature-related asymmetry in molecular conformation could induce an asymmetry in composition based on tail-length effects.
Although most simulations in this study were performed on mixtures of DMPC with didecanoylphosphatidylcholine (DDPC), several further runs were performed with HMPC (hexanoyl-myristoylphosphatidylcholine). This mixed-tail lipid has the same average tail length as DDPC (10 carbons) but with tails that differ in length (14 and 6 carbons). The difference in molecular shape between symmetric- and asymmetric-tailed lipids may lead to different packing properties and different responses to local curvature. Results from coarse-grained simulations (26) and self-consistent field theory (27) indicate that bilayers formed by lipids with asymmetry in tail length have a significantly lower bending modulus than bilayers of symmetric lipids with the same average tail length, suggesting that they may adapt better to highly curved microenvironments.
METHODS
Molecular dynamics and MCMD simulations were performed according to the methods recently published by our group (9), using a customized version of Gromacs 3.2 (28). In all simulations, the lipid forcefield of Berger et al. (29) was used with the simple point charge water model (30). The stochastic Langevin thermostat was applied (31) with a temperature of 300 K and a time constant of 0.1 ps. The particle mesh Ewald algorithm was used for electrostatic force calculations in the periodic system (32). MCMD simulations were performed at constant activity ratio α, where α represents the ratio of the thermodynamic activity of the short-tail lipid to that of DMPC. The activity ratio can be expressed in terms of the difference in chemical potential, Δμ, as
 |
(1) |
where Δμ = μshort-tail − μDMPC. One lipid was selected at random after every 2-fs MD time step for a tail-elongation or tail-shortening mutation move attempt. Trial moves and acceptance probabilities were calculated using the configuration bias Monte Carlo algorithm (33–35). Mutation move success rates varied from 2 × 10⁻⁴ at low DDPC concentration to 1 × 10⁻³ at high DDPC concentration. A success rate of order 5 × 10⁻⁴ indicates an average of one successful mutation in the system per 4 ps, or ∼1 mutation/lipid/ns.
Compositions for simulation runs are shown in Table 1. One run was performed for each condition. For ribbon simulations, the initial configuration was taken from the endpoint of the 183 DMPC ribbon simulation of Jiang et al. (10). The box dimension normal to the ribbon bilayer plane (Y dimension) was reduced from ∼12 nm to ∼7 nm, however, to lower the number of waters in the simulation box and decrease computational cost. This reduction introduces the risk that if the ribbon were to rotate around the Z dimension (along the ribbon edge), the edges could come into contact and anneal to form a continuous bilayer sheet. Rotational diffusion of the whole structure was slow enough on the simulation timescale, however, that such a problem was not encountered.
TABLE 1.
Simulated lipid systems
| Short-tail component | Mol % short-tail component | Activity ratio (/1000) | Duration (ns) |
|---|---|---|---|
| Ribbon simulations (183 lipids) | |||
| DDPC | 100 | (∞) | 8 |
| DDPC | 90.6 ± 0.8 (± 0.2) | 100 | 8.4 |
| DDPC | 74.5 ± 1.8 (± 0.4) | 30 | 8 |
| DDPC | 48.7 ± 1.4 (± 0.7) | 10 | 8 |
| DDPC | 34.0 ± 2.0 (± 0.8) | 5 | 8 |
| DDPC | 10.4 ± 0.6 (± 0.5) | 1 | 8 |
| — | 0 | (0) | 8 |
| HMPC | 47.2 ± 0.9 (± 1.2) | 10 | 10 |
| HMPC | 36.0 ± 1.0 (± 1.9) | 5 | 8 |
| Buckled bilayer simulations (256 lipids) | |||
| DDPC | 100 | (∞) | 30 |
| DDPC | 69.6 ± 1.6 (± 1.4) | 30 | 24 |
| DDPC | 45.8 ± 0.8 (± 1.2) | 10 | 24 |
| DDPC | 27.9 ± 0.7 (± 0.9) | 5 | 24 |
| - | 0 | (0) | 30 |
| HMPC | 36.6 ± 0.8 (± 1.2) | 10 | 12 |
| Flat bilayer simulations (128 lipids) | |||
| DDPC | 100 | (∞) | 10 |
| DDPC | 89.9 ± 0.9 (± 1.9) | 100 | 8 |
| DDPC | 71.9 ± 1.6 (± 1.7) | 30 | 8 |
| DDPC | 42.3 ± 1.1 (± 1.6) | 10 | 8 |
| DDPC | 24.9 ± 0.9 (± 0.7) | 5 | 24 |
| DDPC | 7.2 ± 1.2 (± 0.6) | 1 | 8 |
| - | 0 | (0) | 10 |
| HMPC | 36.6 ± 1.1 (± 1.3) | 10 | 10 |
For DDPC ribbon simulations, the last four carbons of the DMPC tails were removed and the ribbon was reequilibrated for 5 ns. From the pure DMPC and equilibrated pure DDPC ribbon starting points, 5-ns MCMD simulations at an activity ratio of 10,000 were performed to confirm that both systems converge to ribbons of similar total composition (∼50%) and distribution of the two components, as seen in Fig. 1. One of these was then used as the starting configuration for ribbon simulations at three activity ratios: 1000, 5000, and 30,000. All of these were subject to 18 ns initial equilibration followed by 8 ns production. Intact bilayers, starting from a 128-lipid bilayer of pure DMPC, were subject to 8 ns equilibration under MCMD and at least 8 ns production.
FIGURE 1.

(Left) Change in composition versus time during semigrand-canonical MCMD simulation for bilayer ribbons initiated as pure DMPC (gray curve) and pure DDPC (black curve), both at an activity ratio of 10,000. (Right) Distribution of DMPC (dashed line) and DDPC (solid line) lipids along the Y dimension, extending from one edge to the other, averaged over the interval 3.8–5.0 ns of the equilibration period. Values are given in molecules/nm2 for the entire ribbon (i.e., including both leaflets in the ribbon center.)
To create a buckled bilayer, the pure 128-lipid intact DMPC bilayer system of Jiang et al. (10) was replicated in the Y dimension to give a 256-lipid bilayer solvated by 7310 waters, and a uniaxial pressure of 100 bar was applied in the Y dimension while the X dimension and Z dimension (normal to the mean bilayer plane) were allowed to relax independently at 1 bar pressure each. Over 4 ns, the X dimension decreased from 12.28 nm to 10.87 nm, and the bilayer adopted a roughly sinusoidal cross section along the y axis, remaining relatively flat along the x axis. The X and Y dimensions were then fixed and the system was equilibrated for 10 ns more before MCMD simulation runs were started. For simulations of buckled bilayers composed of DDPC, we first used an extremely large activity ratio to start an MCMD run that removed all DMPC in the bilayer. The system was then equilibrated using MD simulation for 12 ns. For both pure DMPC and pure DDPC simulations, data were collected for production runs of 24 ns. MCMD simulations started with pure DMPC buckled bilayers and carried on with different activity ratios, which generated three lipid compositions, as described in Table 1. For all MCMD simulations, the composition of the bilayers was monitored until it leveled out. Further 12-ns runs were carried out to assure equilibration, after which 12-ns or longer production runs were done to generate the data we used for further analysis.
In all simulations, pressure was equilibrated to 1 bar through the Berendsen weak-coupling method (36) with a time constant of 5 ps, based on an assumed compressibility of 4.5 × 10⁻¹⁰ Pa−1. Intact bilayer simulations were performed under semiisotropic pressure scaling (joint scaling in the X and Y dimensions, independent scaling normal to the bilayer) with zero applied surface tension. Semiisotropic scaling was also applied in ribbon simulations, with the Z dimension (along the edge) fixed. For buckled bilayer simulations, only the dimension normal to the mean bilayer surface was allowed to fluctuate. Fig. 2 shows cross-sectional snapshots of the ribbon and buckled bilayer structures, prepared using Visual Molecular Dynamics 1.8.6 (37), to illustrate the positioning of the bilayer structure within the simulation box. Periodic images of the ribbon are separated by a layer of ∼3 nm of water between bilayer surfaces and have a distance of nearest approach of 1.5 nm between the edges. Periodic images of the buckled bilayer are separated by a water layer of thickness varying between 1.5 and 3 nm, as the upper and lower surfaces are not exactly parallel.
FIGURE 2.

Cross-sectional snapshots of mixed-lipid ribbon (top) and buckled bilayer (bottom) structures, illustrating the dimensions of the simulation box. DMPC lipids are indicated with dark blue headgroups and light blue tails, and DDPC lipids with orange headgroups and red tails. Solvent is omitted for clarity.
RESULTS
MCMD simulations of DDPC/DMPC mixtures in the flat bilayer, ribbon, and buckled bilayer geometry systems yielded small but substantial differences in mean total composition at several fixed activity ratios. For instance, an activity ratio of 5000 (aDDPC/aDMPC) yielded 24.9% DDPC in the flat bilayer, 34.0% DDPC in the ribbon, and 27.9% DDPC in the buckled bilayer. The discrepancies, also plotted in Fig. 3, suggest that the ribbon and curved bilayer structures are environments that favor the shorter-chain lipid, DDPC. At higher DDPC fractions, these differences shrink to within the uncertainties of the composition fluctuations. For flat bilayers, activity ratio increases sublinearly with mole ratio in the 25–75% DDPC range, consistent with a positive excess free energy of mixing, as seen in a previous study (9) of DLPC/DPPC fluid phase mixtures at 323 K. Trends in bilayer thickness (Supplementary Material, Fig. 1, Data S1) and methylene CH order parameter (Supplementary Material, Fig. 2, Data S1) are also qualitatively consistent with the DLPC/DPPC results, with a roughly linear dependence of thickness on composition, and with order decreasing in both components with increasing DDPC content. Toward the composition extremes, the relationship between mole ratio and activity ratio moves toward the linear, as expected for the ideal-dilute solution limit.
FIGURE 3.

Relationship between set activity ratio and average resulting mole ratio for three system types. Circles with solid line are flat bilayers, triangles with dashed line are ribbons, and open diamonds with dotted lines are buckled bilayers. Error bars affixed to symbols were calculated according to Eq. 2. The heavy gray line shows linear dependence as a reference for the ideal mixing case.
Two approaches were considered to estimate the uncertainty in composition at fixed chemical potential. The first uncertainty range in mole fraction X shown in Table 1 for each trajectory is calculated directly and exclusively from the trajectory of composition versus time:
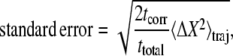 |
(2) |
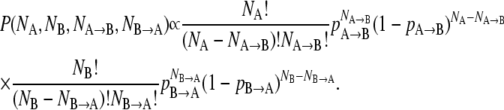
where ttotal is the length of the trajectory, tcorr is the correlation time of the composition X(t), and 〈ΔX2〉traj is the variance of the composition over the trajectory (38). Correlation times in the range 0.5–1.0 ns were observed upon calculating the time correlation function of composition fluctuations; these times are relatively fast in comparison with the ∼2-ns relaxation time one would infer from the approach to equilibrium in Fig. 1, which may reflect some slow collective response required for the initial equilibrium approach. Uncertainties calculated according to this formula were ≤2 mol %. For comparison, we considered an ideal stochastic model of the simulation as a set of uncorrelated two-state systems with fixed probabilities of undergoing a transition. The ratio of the transition probabilities pAB and pBA gives the theoretical long-time composition ratio. For a single lipid, the probability of obtaining a trajectory in which the lipid spends NA steps as lipid type A, NB steps as lipid type B, NA→B transitions from A to B, and NB→A transitions from B to A is proportional to:
 |
(3) |
Fixing the total number of transitions, NS (including both A→B and B→A transitions), one can estimate the standard deviation in the mole fraction X as
 |
(4) |
(Note that the number of lipids does not enter into this equation; including more lipids at fixed NS increases the sample size and lowers the transition probability per lipid by an equal factor.) Application of this formula to the current system yields uncertainties comparable to those of Eq. 2. These uncertainties are given in parentheses in Table 1. This second method of error analysis relies on an approximation of equal rates for all lipids in the system, which is unfounded for the ribbon cases.
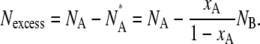
In the ribbon geometry, over the entire range of compositions studied, the shorter-chain DDPC lipid was enriched close to the ribbon edges, as shown in Fig. 4. It is difficult to unambiguously define which lipids belong to the edge, and therefore how to define the composition of the edge. Instead, the excess number of shorter-chain lipids per unit edge length was calculated according to the definition used in the Gibbs adsorption isotherm (39). The excess number of molecules of one component, A, at the interface of a mixture of NA molecules of that component and NB molecules of another component can be defined unambiguously as the difference between the actual number of A molecules and the number, NA*, that would exist in a hypothetical system with the same NB, but with a uniform composition throughout determined by the bulk mole fraction xA of the actual system:
 |
(5) |
FIGURE 4.

Mole fraction of the short-chain lipid as a function of displacement along the y axis (i.e., from left edge to right edge) of mixed-lipid ribbons. Solid lines represent the DDPC fraction in DDPC/DMPC mixtures, with increasing DDPC content as listed in Table 1. Dotted lines represent the HMPC content in HMPC/DMPC mixtures.
The ribbons do not have a true bulk phase, but we can approximate a bulk mole fraction as the mole fraction of short-chain lipid in a strip down the center of the ribbon within 1.8 nm to either side of the center axis, where the composition is roughly constant. (An alternate definition of the bulk mole fraction is the mole fraction of the unbroken, flat bilayer simulated at the same activity ratio. The two definitions give very similar results.) As shown in Fig. 5, the range in magnitude of the excess, of order 1–4 lipids per nanometer of edge length, is similar to that found in coarse-grain model simulations of a similar system (14).
FIGURE 5.

Excess DDPC or HMPC molecules found at the edge of mixed-lipid bilayer ribbons versus bulk mole fraction of DMPC.
From Fig. 5 it is also evident that the asymmetric-tail lipid HMPC showed a greater excess linear density at the edge than symmetric-tail lipids with the same total tail length. Fig. 4 suggests that the greater linear density for HMPC occurs because the zone where the short-chain component is enriched is wider—that is, extends farther into the center of the ribbon—when HMPC is present instead of DDPC.
Uniaxially buckled bilayers composed of mixed DMPC and DDPC lipids, with compositions determined through MCMD simulation at three fixed activity ratios, show a small enrichment of the short-tail lipid compared with flat bilayers simulated at the same activity ratios in two of three cases, as seen in Table 1 and Fig. 2. The difference in composition is most pronounced at low DDPC content (28% DDPC in the buckled versus 25% DDPC in the flat bilayer at an activity ratio of 5000) and vanishes to within statistical error at high DDPC content (70% DDPC in the buckled versus 71% DDPC in the flat bilayer at an activity ratio of 30,000).
Like the ribbon structure, the uniaxially buckled bilayer structure encompasses a range of local environments for its constituent lipids. The roughly sinusoidal buckled cross-sectional profile was nearly static at each composition, with amplitude fluctuations <0.7 nm and lateral fluctuations (i.e., changes in the phase of the sine wave) <1.2 nm over the course of a 24-ns simulation. The slowness of change to the structure may be due to the strong degree of curvature stress. Unlike simulations of bilayers under zero surface tension, where a number of bending modes can be thermally excited—interfere with each other dynamically, and relax—here the constraints of the box geometry yield one dominant bending mode whose amplitude is roughly fixed. The only collective change to the system that does not drastically increase the bending or compressive energy of the bilayer is the change in the phase of the sine wave, which might be hindered by the slow dynamics of the collective solvent flow that would have to accompany it. Because the structure does not change, an individual lipid does not experience a full range of curvature environments; however, with simulation times of 24 ns, each lipid is able to sample an ensemble of conformations according to its fixed curvature environment, and also to undergo several (on the order of 10) mutation events.
Because of the absence of dynamic undulations, lipid position along the y axis can be directly correlated to the local curvature: for instance, the strongest positive curvature was near y = 2 nm for the lower leaflet and y = 8 nm for the upper leaflet. As an indicator of how the local curvature influences lipid conformation, we measured the degree of alignment of the two tails as a function of lateral position for each leaflet, as plotted in Fig. 6.
FIGURE 6.

Tail alignment factors of mixed buckled bilayer (48.7% DDPC). (Upper) Contour of buckled bilayer along the y axis for reference. (Middle and Lower) Local averages of tail alignment factors along the y axis for the bottom leaflet (solid line) and top leaflet (dot-dashed line). The tail alignment factor averaged over an entire unbuckled bilayer is shown for reference as a heavy gray line.
The intramolecular “tail alignment factor” was defined as the cosine of the average splay angle between the two tail vectors of each lipid, with a tail vector defined as the vector originating at the carbonyl carbon and pointing to the terminal methyl group. A tail alignment factor of 1 indicates perfectly aligned tails, whereas an alignment factor of 0 indicates tails at right angles to each other. Compared with average values for lipids in flat mixed-lipid bilayers, the alignment factor was consistently higher (indicating less tail splay) for lipids in regions of positive curvature (convex lipid surface), and substantially lower for lipids in regions of negative curvature (indicating more tail splay). This trend was consistent for both long and short lipids at all mixing fractions. The intramolecular tail alignment was somewhat lower for DDPC than for DMPC in all cases.
In contrast to the clear dependence of intramolecular tail alignment on local curvature, no clear correlation between composition and lateral position is evident for mixtures of DMPC with either the symmetric-tail DDPC or the asymmetric-tail HMPC. No tendency of lipids in these mixtures to partition by type among local environments of different magnitude or direction of curvature is evident in Fig. 7 or in Fig. 8. Any systematic equilibrium differences in local concentration are hidden within the apparently random noise. As each of the 40 points on each graph corresponds to a section of an average of 2.5% of the total number of lipids, the uncertainty associated with each point can therefore be estimated to be of order of the square root of 40 times the uncertainty of the total composition, or ∼6–12 mol %, depending on the method used to calculate uncertainties. We can therefore infer that our inability to observe correlations indicates an upper bound of ∼10% for possible equilibrium differences in mole fraction across different curvature environments of these buckled bilayer mixtures.
FIGURE 7.

Composition in mixed buckled bilayers for the three DDPC/DMPC mixed-lipid buckled bilayer systems listed in Table 1. The upper panel shows the contour of the buckled bilayer along the Y dimension for reference. The Y (buckled) dimension of the simulation box was divided into 20 slabs, in which the local composition in each leaflet was calculated. Solid lines correspond to the lower leaflet, and dot-dashed lines to the upper leaflet.
FIGURE 8.

Composition in buckled DMPC/HMPC bilayers. The Y (buckled) dimension of the simulation box was divided into 20 slabs, in which the local composition in each slab was calculated. The solid line corresponds to the lower leaflet and the dot-dashed line to the upper leaflet.
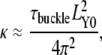
The mean pressure anisotropy in both buckled bilayer and ribbon systems was determined in an attempt to relate it to elastic properties. Pressure fluctuations in small, incompressible systems are large, and these values are notably slow to converge. It is possible that the relatively large volume fluctuations required to accommodate the fluctuating system composition further prolong the time needed for convergence. In ribbons, the pressure along the edge dimension is always lower than in the perpendicular dimensions, indicating a positive line tension (10,12). Mean line tensions in the range 15–40 pN were calculated from pressure anisotropies in all the simulated ribbon systems, but uncertainties were too great for any meaningful comparison of line tensions for systems of different composition. For buckled bilayers, the pressure in the buckling dimension is always greater than in the surface normal or unbuckled dimensions. Excess buckling surface pressures were on the order of 0.01 N m−1, but again slow to converge. Previous work on buckling through uniform surface pressures has uncovered an approximate relationship between the critical surface pressure of buckling of a bilayer, τbuckle, and the bilayer's bending elastic modulus, κ (23):
 |
(6) |
As the derivation brings the contour area, A, into this equation as the square of the largest box dimension of the system in the absence of surface pressure, for the present uniaxial case, it may be more appropriate to use (24)
 |
(7) |
with LY0 the dimension of the box before buckling, in this case 12.2 nm. The result is κ ≈ 5 × 10⁻²⁰ J, consistent (fortuitously, we expect) with the value of 5.6 × 10⁻²⁰ measured for DMPC (40).
DISCUSSION
Mixed-lipid ribbons
The enrichment of shorter-tail component DDPC at the edge of mixed DMPC/DDPC ribbons provides the first (to our knowledge) observation of equilibrium inhomogeneous mixing in an atomically detailed simulation of a mixed-lipid bilayer. To achieve these distributions through conventional MD simulation, starting from a random distribution, would require trajectories of duration ∼1 μs or more, given the rate of lateral diffusion within the bilayer.
The observed enrichment of the shorter-tail lipid at the edge is anticipated by previous computational, experimental, and theoretical work. Simulations using coarse-grained molecular models, for which faster diffusion rates and lower computational costs allow equilibrium distribution to be achieved through conventional MD, have also shown enhancement of the short-chain lipid component at bilayer edges (14,15). One interesting result from earlier coarse-grained studies (14) was that, at certain compositions, a zone enriched in the long-tail component was observed to collocate with a bulge in the rim. Although thickening at the edges is still evident in the current ribbon structures, a peak in the long-tail component near the edge is either absent in the behavior of the more realistic models used here, or is less pronounced and hidden within the statistical noise.
Experimental data concerning the edge composition in DMPC/DDPC mixtures have not been reported. As DDPC itself forms a stable bilayer, its presence is not expected to yield thermodynamically stable edges: we found significant line tensions (∼15–40 pN) for all compositions studied from pure DDPC to pure DMPC. (Unfortunately, unlike in previous studies using coarse-grained models, we were not able to reliably resolve any composition effects on edge line tension due to slow convergence of the pressure tensor elements.) However, qualitative confirmation for the tendency of shorter-chain lipids to favor the bilayer-edge environment is available from experiments on “bicelle” mixtures of DMPC and DHPC. The six-carbon tails of DHPC lipids, which form micelles rather than bilayers on their own (41), drives substantial partitioning of the shorter-tail lipid toward bilayer edges (17). The affinity of DHPC for the edge reduces or eliminates the line tension to the extent that edge-bearing morphologies such as disks and porous vesicles (42) and ribbonlike (or flattened wormlike) micelles (43) are observed. Converged distributions of DMPC-DHPC binary mixtures have not been attained through this MCMD algorithm, as the acceptance probability of mutation moves drops roughly exponentially with the number of methylene groups to be added or removed.
Following the simple yet powerful theoretical approach developed by Israelachvili et al. (44), we can explain the affinity of DDPC for the edge in terms of the optimal area covered by an amphiphile headgroup and the volume occupied by its tail or tails. If each rim of the ribbon is approximated as a hemicylinder with diameter equal to the bilayer thickness, then the area/volume ratio at the edge is twice the ratio in the ribbon interior. Assuming that the tails are approximately incompressible, this leads to an area/lipid headgroup at the edge that is greater than the (presumably optimal, or near-optimal) value present in a simple bilayer by a factor of 2. Such a doubling of area/headgroup was measured in simulations of a pure DMPC ribbon (10). Since the tail volume of DDPC is lower than that of DMPC, DDPC can be packed with a less severe expansion of the headgroup area than DMPC, and is therefore expected to reside at the edge with a higher equilibrium probability. Partial demixing of DMPC and DDPC, with a higher DDPC fraction at the edge and a higher DMPC fraction in the interior, is therefore expected to lower the ribbon free energy.
The results of our simulations show a greater excess linear density of the short-tail component at the edge for mixed ribbons containing the asymmetric HMPC than for DDPC. This result suggests that lipids with asymmetry in tail length are more edge-active than symmetric-tail lipids with the same mean tail length. This finding is consistent with the “packing parameter” concept of Israelachvili et al., in which the ratio p ≡ vtail/(aheadltail), with vtail the volume of hydrophobic tail of the molecule, ahead the area of the headgroup, and ltail the effective maximum extension of the tail, is predictive of the morphology of amphiphile aggregation (44). On the basis of area/volume ratio alone, the packing behavior of symmetric and asymmetric tail lipids would be the same, but the packing parameter for the asymmetric-tail lipid is lower. Tail length plays a role because the longer tail is better able to extend to the center axis of the hemicylindrical edge and pack more efficiently, as can be observed by comparing snapshots of a DMPC/DDPC ribbon with a DMPC/HMPC ribbon of similar total composition (Fig. 9). The edges of the former appear as a shell of DDPC surrounding a core of DMPC, whereas those of the latter appear more like a solid semicircle of HMPC. Another striking difference is that the ribbon containing the asymmetric lipids is thicker. It is difficult to disentangle the thickness from the degree of demixing, as bilayer thickness varies directly with composition. For whatever reason, these results suggest that asymmetric-tail lipids are more effective edge-actants than symmetric-tail lipids of the same molecular weight.
FIGURE 9.

Snapshot of the final structures of DMPC/DDPC (upper) and DMPC/HMPC (lower) mixed-lipid bilayer ribbon cross sections, both at α = 10,000. DMPC is in gray, and the shorter-tail component in black. The arrow indicates the “DMPC core” mentioned in the text.
Mixed-lipid buckled bilayers
Given the inhomogeneity of local lipid environments in the buckled bilayer structure, some degree of inhomogeneity in composition might be expected. The idea that the asymmetry of interior and exterior leaflets of a curved bilayer has an effect on molecular properties has a long history. Based on experimental measurements of the number ratio of lipids in outer and inner leaflets of small (∼20 nm diameter) unilamellar vesicles, Huang and Mason (25) have suggested that in such vesicles, the lipid area/headgroup and thickness are significantly (20–30%) greater for the outer layer than for the inner. Although it is difficult to define the area and thickness in the nonuniform buckled bilayer structure, the current simulations do show a clear influence of local curvature on conformation in that tails are splayed to a wider angle where local curvature is negative (i.e., like the inner leaflet). However, this conformational difference does not lead to a measurable asymmetry in composition in the current mixtures of PC lipids with different average tail lengths, whether the shorter-tail component is symmetric or asymmetric. To a first approximation, the buckled bilayer geometry does not introduce constraints to the volume/area ratio in the same way as the ribbon edge geometry: the thickness of each leaflet of the buckled bilayer can vary freely. The absence of local demixing suggests an absence of strong intrinsic curvature preferences of lipids of different tail length (or tail length symmetry): curvature seems to be important primarily insofar as it constrains the area/volume ratio.
It is possible that the degree of saturation of tail chains may influence the tendency to splay; in that case, a coupling of curvature to composition might be observable in mixtures of saturated and monounsaturated lipids, which are systems of interest for further MCMD simulations. Effects of headgroup differences are likely to play an even greater role in curvature/composition coupling. These are more challenging to address via MCMD due to the close interactions with solvent.
In addition to allowing rapid equilibration of the lateral distribution, semigrand-canonical ensemble simulation gives further information about the thermodynamics of mixing and demixing. Previously, a positive excess free energy of mixing for DPPC/DLPC mixed bilayers was determined through deviation from a linear relationship between activity ratio and mole ratio (9). The flat DMPC/DDPC mixture shows similar behavior here (Fig. 3). In this study, we can take further advantage of the use of a fixed activity ratio in the simulations: two separate simulations whose compositions are converged at the same activity ratio can be considered to be at equilibrium with each other with respect to lipid exchange. Although no evidence for coupling of local curvature to composition could be established within the buckled bilayer simulations, it is noteworthy that at activity ratios of 5000 and 10,000, DDPC content is slightly higher in the buckled bilayer systems than in the flat bilayers, by ∼3% (greater than the sum of the uncertainties in the two systems' compositions). Therefore, we may infer that in a large system encompassing both flat and curved bilayer environments with an equilibrated lateral distribution of DDPC and DMPC, DDPC would be slightly enriched in the strongly curved region. The magnitude of the enhancement is reasonable according to back-of-the-envelope approximations of the bending elastic energies in the system. As the bending modulus of DMPC has been found via simulation (45) and experiment (40) to be ∼10 kBT, and coarse-grain model simulations have shown a reduction in κbend by nearly a factor of 2 for even a 25% reduction in tail length (26), DDPC is likely to have a bending modulus that is ∼3–5 kBT lower than that of DMPC. The mean radius of curvature of the buckled bilayer is of the order of 5–10 nm, giving curvatures of 0.1–0.2 nm−1, and the area/lipid is ∼0.6 nm2. The bending energy/lipid is ∼1/2κbendc2a, where c2 is the mean square curvature and a the area/lipid. Therefore, substitution of a shorter-chain lipid for a longer-chain lipid is estimated to give a ∼0.01–0.06 kBT reduction in the bending free energy, sufficient to drive a few percent enrichment of the DDPC content in the curved region.
This simple approach does not, however, account for two observations. One unexplained result is that, as the composition of the mixed bilayer shifts toward DDPC, the enhancement of DDPC in the buckled environment drops and is in fact slightly reversed at the highest activity ratio studied for a buckled bilayer (∼70% DDPC). An implicit assumption of the back-of-the-envelope approach described above is that the bending modulus of the mixture is a composition-weighted average of the pure components' bending moduli—in other words, that the bending modulus can be calculated by a “lever rule”. This assumption has been challenged in simulations (46) using a coarse-grained model to study how bending modulus, κbend, depends on composition in mixed long- and short-tailed amphiphile bilayers containing a range of mole fractions xB of a short-tail component “B”. The mixed bilayer's bending modulus declined steeply with increasing xB at low xB, then leveled off to a minimum at xB ≈ 0.6, and rose slowly up to xB = 1. The behavior of the atomistic model in this study is consistent with a similar dependence of κbend on composition. At low DDPC fractions, where the coarse-grained model results would suggest that increasing DDPC content has the greatest lowering effect on κbend, we find the greatest enrichment of DDPC in the buckled bilayer. The enrichment becomes weaker at higher DDPC fractions, where the coarse-grained model results show that the dependence of κbend on composition is weaker. At a DDPC mole fraction of ∼0.7, the tendency is yet weaker and also reversed, consistent with the bending modulus reaching a minimum at some DDPC content <70%.
For mixtures of DMPC with the mixed-tail-length lipid HMPC, the picture is not so complete. Pure bilayers formed by mixed-tail lipids are expected (based on theory (27) and simulation (26)) to have even lower bending modulus than their symmetric counterparts with the same mean tail length. In this study, flat and buckled DMPC/HMPC bilayers simulated at the same activity ratio yielded indistinguishable mole fractions of 37% HMPC, suggesting that bending modulus is insensitive to composition at that mixing ratio. It is quite possible that this is another case in which the lever rule does not hold. Direct determination of bending modulus of simulated lipid mixtures containing a mix of symmetric and asymmetric lipids, through sampling thermal undulations of a large bilayer surface (45), could resolve this question.
Although the buckled-bilayer geometry is not one that can be duplicated experimentally, strong curvature along one dimension might be achievable in supported bilayer overlaid on a surface patterned with a line defect. The current results suggest that for the lipid mixtures considered in this report, there would be at most a few percent difference in composition for such a feature compared with flat regions. Whereas the buckled bilayer differs from spherical vesicles in its lack of Gaussian curvature (i.e., simultaneous bending in two directions), we can speculate that this difference is minor and that small composition differences would be seen in an equilibrated mixed-lipid system of vesicles of different sizes, or of vesicles in equilibrium with a lamellar phase. Regarding the difference in composition between the inner and outer leaflets of a strongly curved bilayer, the results of Figs. 7 and 8 suggest that there is no general trend for lipids with long or short tails to favor leaflets with positive or negative curvature, although due to the noise of the results we could not rule out a composition difference as large as 10% between the leaflets. In cases where there is spontaneous phase separation of lipids according to chain length in the absence of curvature, the current results are not applicable and the coupling between curvature and composition can be greatly enhanced by the difference in bending elasticity of the different phases, as has been observed in experiments (8).
CONCLUSIONS
A simulation method combining MD with semigrand-canonical ensemble configuration bias mutation moves allows efficient equilibration of the lateral distribution of phospholipids differing only in the length of their tails, specifically DMPC and DDPC, within bilayers containing edges or regions of strong curvature. An enrichment at the edge of the shorter-tail DDPC component was observed, as expected based on theoretical considerations, earlier coarse-grained model simulations, and analogy to experimental results on the DMPC-DHPC “bicelle” systems. Although low acceptance probabilities for tail-length-change mutation moves involving more than eight carbons in total make direct application of the current MCMD method to bicelle systems impractical, the results shown here suggest that it would be practical to simulate a DMPC-DDPC-DHPC ternary mixture with a low-percentage DDPC, affording a good approximation to the binary DMPC-DHPC mixture of longstanding experimental interest. A mixed-tail lipid containing one C14 tail and one C6 tail showed greater edge enrichment when mixed with DMPC than did the di-C10 tail lipid DDPC, as would be predicted based on molecular shape concepts.
In contrast to the clear segregation of shorter-tail lipids to the edge defect, in uniaxially buckled mixed lipid bilayers, no correlation was seen between local lipid composition (within ∼10% statistical uncertainty) and the degree or sign of local curvature. Local curvature was shown to have an effect on the molecular conformation, specifically to decrease the degree of intramolecular alignment of the two tails for lipids in the locally “inner” leaflet (that is, the leaflet with a concave interface with the solvent) and to increase intramolecular tail alignment for lipids on the locally “outer” leaflet. This conformational effect suggests that lipids with a lower intrinsic tendency to have parallel tails—perhaps lipids with unsaturated acyl chains—could naturally tend to the inner leaflet when mixed with saturated lipids in curved bilayer structures. Further MCMD studies are planned to address this question. Although demixing was not directly observed in mixed buckled bilayers, the interpretation of composition differences between buckled and flat bilayers simulated at common activity ratios suggests that the bending modulus of our atomistic DDPC/DMPC model follows the same qualitative trends with changing composition as observed previously in coarse-grain model simulations (46).
SUPPLEMENTARY MATERIAL
To view all of the supplemental files associated with this article, visit www.biophysj.org.
Supplementary Material
Acknowledgments
We thank the National Science Foundation (grant CHE-0616383), the Arthur P. Sloan Foundation, and the Camille and Henry Dreyfus Foundation for financial support. B. Albrecht was supported through the Cherry L. Emerson Center Visiting Fellows Program.
Editor: Peter Tieleman.
References
- 1.Edidin, M. 2003. The state of lipid rafts: from model membranes to cells. Annu. Rev. Biophys. Biomol. Struct. 32:257–283. [DOI] [PubMed] [Google Scholar]
- 2.Binder, W. H., V. Barragan, and F. M. Menger. 2003. Domains and rafts in lipid membranes. Angew. Chem. Int. Ed. 42:5802–5827. [DOI] [PubMed] [Google Scholar]
- 3.Veatch, S. L., O. Soubias, S. L. Keller, and K. Gawrisch. 2007. Critical fluctuations in domain-forming lipid mixtures. Proc. Natl. Acad. Sci. USA. 104:17650–17655. [DOI] [PMC free article] [PubMed] [Google Scholar]
- 4.Soubias, O., and K. Gawrisch. 2005. Probing specific lipid-protein interaction by saturation transfer distance NMR spectroscopy. J. Am. Chem. Soc. 127:13110–13111. [DOI] [PubMed] [Google Scholar]
- 5.Dumas, F., M. M. Sperotto, M. C. Lebrun, J. F. Tocanne, and O. G. Mouritsen. 1997. Molecular sorting of lipids by bacteriorhodopsin in dilauroylphosphatidylcholine / distearoylphosphatidylcholine lipid bilayers. Biophys. J. 73:1940–1953. [DOI] [PMC free article] [PubMed] [Google Scholar]
- 6.Peter, B. J., H. M. Kent, I. G. Mills, Y. Vallis, P. J. G. Butler, P. R. Evans, and H. T. McMahon. 2004. BAR domains as sensors of membrane curvature: the amphiphysin BAR structure. Science. 303:495–499. [DOI] [PubMed] [Google Scholar]
- 7.Martens, S., M. M. Kozlov, and H. T. McMahon. 2007. How synaptotagmin promotes membrane fusion. Science. 316:1205–1208. [DOI] [PubMed] [Google Scholar]
- 8.Parthasarathy, R., and J. T. Groves. 2007. Curvature and spatial organization in biological membranes. Soft Matter. 3:24–33. [DOI] [PubMed] [Google Scholar]
- 9.de Joannis, J., Y. Jiang, F. Yin, and J. T. Kindt. 2006. Equilibrium distributions of dipalmitoyl phosphatidylcholine and dilauroyl phosphatidylcholine in a mixed lipid bilayer: atomistic semigrand canonical ensemble simulations. J. Phys. Chem. B. 110:25875–25882. [DOI] [PubMed] [Google Scholar]
- 10.Jiang, F. Y., Y. Bouret, and J. T. Kindt. 2004. Molecular dynamics simulations of the lipid bilayer edge. Biophys. J. 87:182–192. [DOI] [PMC free article] [PubMed] [Google Scholar]
- 11.Kasson, P. M., and V. S. Pande. 2004. Molecular dynamics simulation of lipid reorientation at bilayer edges. Biophys. J. 86:3744–3749. [DOI] [PMC free article] [PubMed] [Google Scholar]
- 12.Wohlert, J., W. K. den Otter, O. Edholm, and W. J. Briels. 2006. Free energy of a trans-membrane pore calculated from atomistic molecular dynamics simulations. J. Chem. Phys. 124:154905. [DOI] [PubMed] [Google Scholar]
- 13.Tolpekina, T. V., W. K. den Otter, and W. J. Briels. 2004. Nucleation free energy of pore formation in an amphiphilic bilayer studied by molecular dynamics simulations. J. Chem. Phys. 121:12060–12066. [DOI] [PubMed] [Google Scholar]
- 14.de Joannis, J., F. Y. Jiang, and J. T. Kindt. 2006. Coarse-grained model simulations of mixed lipid systems: composition and line tension of a stabilized bilayer edge. Langmuir. 22:998–1005. [DOI] [PubMed] [Google Scholar]
- 15.Jiang, Y., and J. T. Kindt. 2007. Simulations of edge behavior in a mixed-lipid bilayer: fluctuation analysis. J. Chem. Phys. 126:045105. [DOI] [PubMed] [Google Scholar]
- 16.Sanders, C. R., and J. P. Schwonek. 1992. Characterization of magnetically orientable bilayers in mixtures of dihexanoylphosphatidylcholine and dimyristoylphosphatidylcholine by solid-state NMR. Biochemistry. 31:8898–8905. [DOI] [PubMed] [Google Scholar]
- 17.Triba, M. N., D. E. Warschawski, and P. F. Devaux. 2005. Reinvestigation by phosphorus NMR of lipid distribution in bicelles. Biophys. J. 88:1887–1901. [DOI] [PMC free article] [PubMed] [Google Scholar]
- 18.Fromherz, P. 1983. Lipid-vesicle structure: size control by edge-active agents. Chem. Phys. Lett. 94:259–266. [Google Scholar]
- 19.Roy, M. T., M. Gallardo, and J. Estelrich. 1997. Bilayer distribution of phosphatidylserine and phosphatidylethanolamine in lipid vesicles. Bioconjug. Chem. 8:941–945. [DOI] [PubMed] [Google Scholar]
- 20.Victorov, A. V., N. Janes, T. F. Taraschi, and J. B. Hoek. 1997. Packing constraints and electrostatic surface potentials determine transmembrane asymmetry of phosphatidylethanol. Biophys. J. 72:2588–2598. [DOI] [PMC free article] [PubMed] [Google Scholar]
- 21.Williams, E. E., J. A. Cooper, W. Stillwell, and L. J. Jenski. 2000. The curvature and cholesterol content of phospholipid bilayers alter the transbilayer distribution of specific molecular species of phosphatidylethanolamine. Mol. Membr. Biol. 17:157–164. [DOI] [PubMed] [Google Scholar]
- 22.de Vries, A. H., A. E. Mark, and S. J. Marrink. 2004. Molecular dynamics simulation of the spontaneous formation of a small DPPC vesicle in water in atomistic detail. J. Am. Chem. Soc. 126:4488–4489. [DOI] [PubMed] [Google Scholar]
- 23.den Otter, W. K. 2005. Area compressibility and buckling of amphiphilic bilayers in molecular dynamics simulations. J. Chem. Phys. 123:214906. [DOI] [PubMed] [Google Scholar]
- 24.Gaulding, J. C. 2006. Buckling properties of a lipid bilayer system using coarse-grained simulations. Honors thesis. Emory University, Atlanta, GA.
- 25.Huang, C., and J. T. Mason. 1978. Geometric packing constraints in egg phosphatidylcholine vesicles. Proc. Natl. Acad. Sci. USA. 75:308–310. [DOI] [PMC free article] [PubMed] [Google Scholar]
- 26.Illya, G., R. Lipowsky, and J. C. Shillcock. 2005. Effect of chain length and asymmetry on material properties of bilayer membranes. J. Chem. Phys. 122:244901. [DOI] [PubMed] [Google Scholar]
- 27.Dan, N. 2007. Lipid tail chain asymmetry and the strength of membrane-induced interactions between membrane proteins. Biochim. Biophys. Acta. 1768:2393–2399. [DOI] [PubMed] [Google Scholar]
- 28.Lindahl, E., B. Hess, and D. van der Spoel. 2001. GROMACS 3.0: A package for molecular simulation and trajectory analysis. J. Mol. Model. 7:306–317. [Google Scholar]
- 29.Berger, O., O. Edholm, and F. Jähnig. 1997. Molecular dynamics simulations of a fluid bilayer of dipalmitoylphosphatidylcholine at full hydration, constant pressure, and constant temperature. Biophys. J. 72:2002–2013. [DOI] [PMC free article] [PubMed] [Google Scholar]
- 30.Berendsen, H. J. C., J. P. M. Postma, W. F. van Gunsteren, and J. Hermans. 1981. Interaction models for water in relation to protein hydration. In Intermolecular Forces. B. Pullman, editor. D. Reidel, Dordrecht. 331–342.
- 31.van Gunsteren, W. F., and H. J. C. Berendsen. 1988. A leap-frog algorithm for stochastic dynamics. Mol. Simul. 1:173–185. [Google Scholar]
- 32.Essmann, U., L. Perera, M. L. Berkowitz, T. Darden, H. Lee, and L. G. Pedersen. 1995. A smooth particle mesh Ewald method. J. Chem. Phys. 103:8577–8592. [Google Scholar]
- 33.Siepmann, J. I., and D. Frenkel. 1992. Configurational bias Monte Carlo: a new sampling scheme for flexible chains. Mol. Phys. 75:59–70. [Google Scholar]
- 34.Siepmann, J. I., and I. R. McDonald. 1992. Monte Carlo simulations of mixed monolayers. Mol. Phys. 75:255–259. [Google Scholar]
- 35.Frenkel, D., and B. Smit. 1996. Understanding Molecular Simulation. Academic Press, San Diego.
- 36.Berendsen, H. J. C., J. P. M. Postma, A. DiNola, and J. R. Haak. 1984. Molecular dynamics with coupling to an external bath. J. Chem. Phys. 81:3684–3690. [Google Scholar]
- 37.Humphrey, W., A. Dalke, and K. Schulten. 1996. VMD: Visual Molecular Dynamics. J. Mol. Graph. 14:33–38. [DOI] [PubMed] [Google Scholar]
- 38.Frenkel, D., and B. Smit. 2002. Understanding molecular simulation: from algorithms to applications. Academic Press, San Diego.
- 39.Chandler, D. 1987. Introduction to Modern Statistical Mechanics. Oxford University Press, New York.
- 40.Rawicz, W., K. C. Olbrich, T. McIntosh, D. Needham, and E. Evans. 2000. Effect of chain length and unsaturation on elasticity of lipid bilayers. Biophys. J. 79:328–339. [DOI] [PMC free article] [PubMed] [Google Scholar]
- 41.Lin, T.-L., S.-H. Chen, N. E. Gabriel, and M. F. Roberts. 1986. Use of small-angle neutron scattering to determine the structure and interaction of dihexanoylphosphatidylcholine micelles. J. Am. Chem. Soc. 108:3499–3507. [Google Scholar]
- 42.van Dam, L., G. Karlsson, and K. Edwards. 2004. Direct observation and characterization of DMPC/DHPC aggregates under conditions relevant for biological solution NMR. Biochim. Biophys. Acta. 1664:241–256. [DOI] [PubMed] [Google Scholar]
- 43.Nieh, M.-P., V. A. Raghunathan, C. J. Glinka, T. A. Harroun, G. Pabst, and J. Katsaras. 2004. Magnetically alignable phase of phospholipid “bicelle” mixtures is a chiral nematic made up of wormlike micelles. Langmuir. 20:7893–7897. [DOI] [PubMed] [Google Scholar]
- 44.Israelachvili, J. N., D. J. Mitchell, and B. W. Ninham. 1976. Theory of self-assembly of hydrocarbon amphiphiles into micelles and bilayers. J. Chem. Soc., Faraday Trans. 72:1525–1568. [Google Scholar]
- 45.Lindahl, E., and O. Edholm. 2000. Mesoscopic undulations and thickness fluctuations in lipid bilayers from molecular dynamics simulations. Biophys. J. 79:426–433. [DOI] [PMC free article] [PubMed] [Google Scholar]
- 46.Imparato, A., J. C. Shillcock, and R. Lipowsky. 2005. Shape fluctuations and elastic properties of two-component bilayer membranes. Europhys. Lett. 69:650–656. [Google Scholar]
Associated Data
This section collects any data citations, data availability statements, or supplementary materials included in this article.