Abstract
Using Langevin modeling, we investigate the role of the experimental setup on the unbinding forces measured in single-molecule pulling experiments. We demonstrate that the stiffness of the pulling device, Keff, may influence the unbinding forces through its effect on the barrier heights for both unbinding and rebinding processes. Under realistic conditions the effect of Keff on the rebinding barrier is shown to play the most important role. This results in a significant increase of the mean unbinding force with the stiffness for a given loading rate. Thus, in contrast to the phenomenological Bell model, we find that the loading rate (the multiplicative value KeffV, V being the pulling velocity) is not the only control parameter that determines the mean unbinding force. If interested in intrinsic properties of a molecular system, we recommend probing the system in the parameter range corresponding to a weak spring and relatively high loading rates where rebinding is negligible.
Single-molecule force experiments have been proved powerful in obtaining information on intrinsic properties of molecular systems, such as energy landscape and kinetics of conformational changes (1–6). Although these measurements have enabled the sampling of individual unbinding events in ligand-receptor complexes, there has been considerable disagreement among results of experiments conducted under different experimental conditions for the same systems (7–9). This indicates that results of force measurements are not determined solely by intrinsic properties of molecular systems but depend also on the characteristics of experimental setup.
In unbinding measurements, the externally applied force is not acting on the ligand-receptor complex directly but is rather applied through a linkage that can be considered a spring. For example, in atomic force microscopy (AFM) experiments, the force is applied by a soft cantilever coupled to the bonded complex via a polymer linker. The effective spring constant of the linkage, Keff, can be represented by two coupled springs in series, which are associated with the elastic deformation of cantilever, K, and polymer, k, according to  The stiffness of the linkage between the complex and the pulling device plays an important role in determining the rupture forces measured in single-molecule force experiments (1,8,9).
The phenomenological Bell model (1,10) predicts that the stiffness Keff influences the measured unbinding forces through the loading rate, r = KeffV, only
 |
(1) |
where  is the mean unbinding force, V is the pulling velocity, xb is the distance from the potential minimum to the barrier, koff is the intrinsic rate of dissociation in the absence of the applied force, kB is the Boltzmann constant, and T is the temperature. However, even for the well-studied biotin-streptavidin complex, the forces measured at the same loading rate differ by as much as 200% (9). The effect of the linkage stiffness on the molecular energy landscape and therefore on the measured forces has been taken recently into account in a Kramers' description of irreversible rupture over a barrier (11), leading to the following equation for the mean unbinding force that differs from Eq. 1:
 |
(2) |
Here, Fc is the zero-temperature value of the unbinding force (the force in the absence of thermal fluctuations) that is given by the maximal slope of the molecular potential U(x), R is a characteristic length scale of the potential,  is the dissipation coefficient during molecular motion, and
  is a dimensionless parameter of the order of unity. Note that
  For the potential U(x) described by the Morse equation,
  the parameters entering Eq.2 are:
  and
and  In contrast to the phenomenological Bell model, Eq. 2 shows that the loading rate (the multiplicative value KeffV) is not the only control parameter that determines the mean unbinding force. For a given loading rate, the mean force increases with the stiffness, Keff, as observed experimentally (9). Equation 2 shows that this effect is determined by the parameter
  which for typical experimental conditions,
  and
and  should be relatively small, of the order of
  The effect of linkage stiffness on the molecular energy landscape of the bound complex and its dependence on the applied force have been recently studied using molecular dynamics simulations (9). It has been found that for a given loading rate the unbinding forces grow significantly with Keff. However, these simulations have been performed for very high values of the effective stiffness,
  which are more than an order of magnitude higher than that used experimentally.
Here we further investigate the role of the experimental setup on the measured unbinding forces through Langevin simulations under realistic conditions, namely  Contrary to previous studies (7–9,12,13), our Langevin calculations include effects of rebinding, which, as we demonstrate, contribute to a strong dependence of unbinding forces on the stiffness.
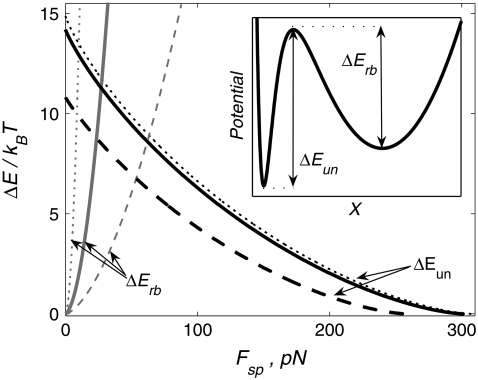
To mimic the mechanical pulling of a ligand-receptor complex, we focus on a one-dimensional description of unbinding and rebinding processes along a single reaction coordinate, x. The inset in Fig. 1 shows the total potential experienced by the pulled molecule,  where
where  is a distance between the pulling device and the complex, and
  is the molecular potential that defines the energy landscape. As an example, we assume here that
  is the Morse potential. The rates of unbinding and rebinding are determined by the heights of potential barriers
  which separate bound and unbound molecular states associated with the left and right minima of
FIGURE 1.
Barrier heights for the unbinding and rebinding as a function of the applied force Fsp = KeffX0(t) calculated for different stiffness values: Keff = 10−1 N/m (dashed curve), 10−2 N/m (solid curve), and 10−3 N/m (dotted curve). Inset shows a total potential experienced by the pulled molecule. Parameter values: U0 = 15 kBT, Rc = 0.3 nm, b = 1.5.
Fig. 1 demonstrates the effect of the pulling device stiffness on the barrier heights for both unbinding and rebinding as a function of the applied force,  For unbinding, the influence of Keff is significant for
  For lower Keff values,
  usually used in single-molecule force experiments, the dependence on Keff is rather weak. On the other hand, for rebinding, the effect of Keff on the barrier height is found to be pronounced over the whole interval of stiffness values,
  The figure clearly shows that for a given force, the barrier for rebinding increases with the decrease in Keff, which results in a reduction of rebinding probability for small Keff values. We find that the height of the barrier for rebinding can be well approximated by
 |
(3) |
where  is the zero-temperature value of the rebinding force. The effects of Keff on the unbinding and rebinding barriers, ΔEun and ΔErb, are manifested in the dependence of the mean unbinding force,
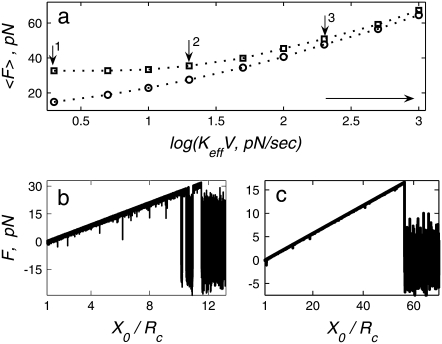
  on the loading rate (see Fig. 2 a). Our calculations predict a pronounced increase of
  with Keff for low loading rates that is dominated by the influence of Keff on the probability of rebinding. Fig. 2, b and c, illustrate that for a given loading rate, the rebinding is much more probable for
  than for
  At higher rates, where rebinding is negligible, the effect of Keff on the dependence of
  on the loading rate is weak since it is now determined by the influence of Keff on the unbinding barrier only. However, the latter effect can be significant for higher stiffness values.
FIGURE 2.
(a) Dependence of the mean unbinding force on the loading rate calculated for two values of stiffness: Keff = 10−2 N/m (squares) and 10−3 N/m (circles). (b and c) Typical force traces calculated for the rate KeffV = 2 pN/s (point 1 in a), Keff = 10−2 N/m (b), and Keff = 10−3 N/m (c). Parameter values as in Fig. 1, 
Moreover, in Fig. 2 the dependence of  on
on  can be well approximated by two different slopes, which might be interpreted as detecting an energy profile with two potential wells (1). Here we show, however, that the behavior stems from a single well potential exhibiting two regimes of unbinding, with and without rebinding.
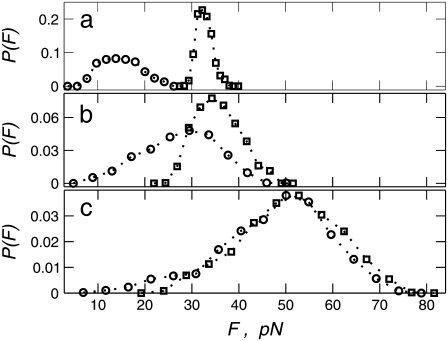
Another way to demonstrate the effect of stiffness emphasizing that the loading rate, KeffV, cannot serve as a control parameter is by measuring the probability distribution function (PDF) of unbinding forces for a given loading rate and different stiffness values. Fig. 3 a shows a dramatic effect of Keff on the PDF for low loading rates  where contribution of rebinding is important, whereas Fig. 3 b displays a milder effect for higher rates
  where rebinding is less pronounced. It should be noted that for
  the PDF of forces changes considerably under variation of
  in the range 2–20 pN/s, which reflects a change of mechanism of unbinding, but the mean unbinding force remains almost constant in this interval of loading rates. Fig. 3 c shows that for high loading rates, the PDFs of unbinding forces are determined by the loading rate only; namely for a given value of KeffV, the PDFs are almost independent of Keff itself.
FIGURE 3.
PDFs of the unbinding forces calculated for two values of stiffness, Keff = 10−2 N/m (squares) and 10−3 N/m (circles), and three loading rates: (a) KeffV = 2 pN/s (point 1 in Fig. 2 a), (b) 20 pN/s (point 2 in Fig. 2 a), and 200 pN/s (point 3 in Fig. 2 a). Parameter values as in Fig. 2.
We conclude that to obtain an insight to the intrinsic properties of a molecular system, we recommend probing the system in the parameter range corresponding to a weak spring and relatively high loading rates where rebinding is negligible (range marked by a horizontal arrow in Fig. 2 a). Too high rates, however, could be subject to effects of viscous dissipation (11).
Editor: Michael Edidin.
References
- 1.Evans, E. 2001. Probing the relation between force-lifetime and chemistry in single molecular bonds. Annu. Rev. Biophys. Biomol. Struct. 30:105–128. [DOI] [PubMed] [Google Scholar]
- 2.Oesterhelt, F., D. Oesterhelt, M. Pfeiffer, A. Engel, H. E. Gaub, and D. J. Muller. 2000. Unfolding pathways of individual bacteriorhodopsins. Science. 288:143–146. [DOI] [PubMed] [Google Scholar]
- 3.Onoa, B., S. Dumont, J. Liphardt, S. B. Smith, I. Jr. Tinoco, and C. Bustamante. 2003. Identifying kinetic barriers to mechanical unfolding of the T. thermophila ribozyme. Science. 299:1892–1895. [DOI] [PMC free article] [PubMed] [Google Scholar]
- 4.Fernandez, J. M., and H. B. Li. 2004. Force-clamp spectroscopy monitors the folding trajectory of a single protein. Science. 303:1674–1678. [DOI] [PubMed] [Google Scholar]
- 5.Woodside, M. T., P. C. Anthony, W. M. Behnke-Parks, K. Larizadeh, D. Herschlag, and S. M. Block. 2006. Direct measurement of the full, sequence-dependent folding landscape of a nucleic acid. Science. 314:1001–1004. [DOI] [PMC free article] [PubMed] [Google Scholar]
- 6.Hinterdorfer, P., W. Baumgartner, H. J. Gruber, K. Schilcher, and H. Schindler. 1996. Detection and localization of individual antibody-antigen recognition events by atomic force microscopy. Proc. Natl. Acad. Sci. USA. 93:3477–3481. [DOI] [PMC free article] [PubMed] [Google Scholar]
- 7.Pincet, F., and J. Husson. 2005. The solution to the streptavidin-biotin paradox: the influence of history on the strength of single molecular bonds. Biophys. J. 89:4374–4381. [DOI] [PMC free article] [PubMed] [Google Scholar]
- 8.Ray, C., J. R. Brown, and B. B. Akhremiychev. 2007. Corrections of systematic errors in single-molecule force spectroscopy with polymeric tethers by atomic force microscopy. J. Phys. Chem. B. 111:1963–1974. [DOI] [PubMed] [Google Scholar]
- 9.Walton, E. B., S. Lee, and K. J. Van Vilet. 2008. Extending Bell's model: how force transducer stiffness alters measured unbinding forces and kinetics of molecular complexes. Biophys. J. 94:2621–2630. [DOI] [PMC free article] [PubMed] [Google Scholar]
- 10.Bell, G. I. 1978. Models for the specific adhesion of cells to cells. Science. 200:618–627. [DOI] [PubMed] [Google Scholar]
- 11.Dudko, O. K., A. E. Filippov, J. Klafter, and M. Urbakh. 2003. Beyond the conventional description of dynamic force spectroscopy of adhesion bonds. Proc. Natl. Acad. Sci. USA. 100:11378–11381. [DOI] [PMC free article] [PubMed] [Google Scholar]
- 12.Dudko, O. K., G. Hummer, and A. Szabo. 2006. Intrinsic rates and activation free energies from single-molecule pulling experiments. Phys. Rev. Lett. 96:108101. [DOI] [PubMed] [Google Scholar]
- 13.Friddle, R. W. 2008. Unified model of dynamic forced barrier crossing in single molecules. Phys. Rev. Lett. 100:138302. [DOI] [PubMed] [Google Scholar]


