

Abstract
We investigate the structure of cholesterol-containing membranes composed of either short-chain (diC14:1PC) or long-chain (diC22:1PC) monounsaturated phospholipids. Bilayer structural information is derived from all-atom molecular dynamics simulations, which are validated via direct comparison to x-ray scattering experiments. We show that the addition of 40 mol % cholesterol results in a nearly identical increase in the thickness of the two different bilayers. In both cases, the chain ordering dominates over the hydrophobic matching between the length of the cholesterol molecule and the hydrocarbon thickness of the bilayer, which one would expect to cause a thinning of the diC22:1PC bilayer. For both bilayers there is substantial headgroup rearrangement for lipids directly in contact with cholesterol, supporting the so-called umbrella model. Importantly, in diC14:1PC bilayers, a dynamic network of hydrogen bonds stabilizes long-lived reorientations of some cholesterol molecules, during which they are found to lie perpendicular to the bilayer normal, deep within the bilayer's hydrophobic core. Additionally, the simulations show that the diC14:1PC bilayer is significantly more permeable to water. These differences may be correlated with faster cholesterol flip-flop between the leaflets of short-chain lipid bilayers, resulting in an asymmetric distribution of cholesterol molecules. This asymmetry was observed experimentally in a case of unilamellar vesicles (ULVs), and reproduced through a set of novel asymmetric simulations. In contrast to ULVs, experimental data for oriented multilamellar stacks does not show the asymmetry, suggesting that it results from the curvature of the ULV bilayers.
INTRODUCTION
It is now generally accepted that the function, insertion, orientation, and subcellular localization of integral membrane proteins are affected by the physical properties of the membrane (1). These properties, which include the membrane's hydrophobic thickness and bending rigidity, are dictated by the lipid, cholesterol, and protein composition (2,3). Varied distributions of these molecules lead to the wide range of membrane thicknesses found in the different organelles of eukaryotic cells (4). Because of the structural flexibility of lipid hydrocarbon chains, a membrane can adjust its thickness to minimize unfavorable thermodynamic interactions between water and the hydrophobic surface of the protein, a process known as hydrophobic matching (5). Likewise, membrane proteins themselves can deform to match the hydrophobic thickness of the bilayer (1), undergoing conformational changes, in the process, that can affect their specific function.
An example of this is sarcoplasmic reticulum Ca2+-transporting ATPase reconstituted into bilayers made up of monounsaturated phospholipids and biological detergent (6). Enzymatic activity was found to be maximal in bilayers composed of medium length (18-carbon) lipids, and decreased, as much as fourfold, in both short- (14-carbon) and long-chain (22-carbon) lipid bilayers. Similarly, the activity of Na,K-ATPase was shown to be sensitive not only to phospholipid chain length, but also to cholesterol content (7), a molecule known to affect bilayer thickness (8,9). Maximal protein activation was seen in long-chain (22 carbon) phospholipids in the absence of cholesterol, and medium-chain (18 carbon) phospholipids in the presence of 40 mol % cholesterol. This suggests that cholesterol increased the thickness of the shorter bilayer such that it was comparable to the thickness of the pure long-chain bilayer—assuming that the hydrophobic matching between the lipid and protein dominates the free energy of activation. In addition to protein function, the connection between cholesterol content and membrane thickness has been suggested in the sorting and trafficking of membrane proteins along the exocytic pathway, specifically though the Golgi apparatus. Transmembrane domains of plasma membrane proteins are on average five amino acids longer than those of the Golgi, and membranes along the exocytic pathway increasingly thicken from the endoplasmic reticulum to the plasma membrane (4). This progressive thickening of the membranes has been correlated with a concomitant increase in cholesterol content along the secretory pathway, suggesting that cholesterol determines the thickness of the membrane and controls the destination of proteins based on hydrophobic matching. However, it should be noted that the precise role of cholesterol in controlling the thickness of biological membranes has been a subject of debate (3,10).
Interest in cholesterol has increased recently because of its presence in lipid rafts. Current understanding of rafts comes from studies of lateral phase separation in model bilayers composed of a ternary mixture of lipids and cholesterol. Separation of these domains is likely caused by distinct interactions between cholesterol and different lipid chains: in mixtures of saturated and unsaturated lipids, cholesterol preferentially partitions into the saturated part and forms a liquid ordered phase (11–13). Cholesterol's rigid sterol ring must be accommodated by the fluctuating lipid chains thereby reducing lipid chain entropy—presumably the energetic penalty is greater in the case of more flexible, unsaturated lipid chains. In nonraft, binary lipid/cholesterol mixtures, increased lipid acyl chain order results in increased bilayer thickness, as has been reported for egg lecithin (14) and bilayers made up of a wide range of saturated lipids (8). In contrast, a decrease in bilayer thickness was reported for long-chain saturated lipids in the gel state (8). In the case of unsaturated lipids, however, published studies are less extensive and the precise effects of cholesterol remain less understood. It has been suggested that unsaturated lipids are mainly affected by hydrophobic mismatch, and bilayer thinning has been observed in a long-chain lipid, although the experimental uncertainties were large (15). On the other hand, recent small-angle neutron-scattering experiments of unsaturated lipids (9) have reported that cholesterol increases bilayer thickness regardless of chain-length in unsaturated lipids.
Understanding the role of cholesterol in cellular physiology requires a high-resolution description of its effect on bilayer structure. Pioneering work in the field (8) used diffraction and multilamellar lipid systems, where the characteristic Bragg reflections were Fourier transformed according to the sampling theorem. Great progress has been made over the past decades in tackling these membrane structures via experiment, theory, and, more recently, computational molecular dynamics (MD) simulations (16,17). To confidently probe the atomic-scale detail provided by simulations, the importance of carefully matching structural data from the simulations with experimental scattering measurements has recently emerged in the case of pure lipid systems (18–22). Thus, validation of the simulations involves the direct comparison of simulated and experimental data. Simulations provide direct access to both real- and reciprocal-space information, and therefore can be validated most directly by comparison to experiment in Fourier space, namely to the form factors.
The goal of this study is to determine the effect of cholesterol on the thickness of “thin” and “thick” bilayers made of monounsaturated lipids. Addition of 40 mol % cholesterol to these two bilayers, which represent models of biological membranes of two extreme thicknesses, allows for the direct evaluation of the membrane's response to a potential hydrophobic mismatch between the lipid and cholesterol. To this end, we have carried out MD simulations to investigate these effects at a resolution significantly higher than could be attained through experiment alone. Additionally, we have made experimental x-ray scattering measurements on unilamellar vesicles (ULVs) and oriented multilamellar bilayers (ORIs) comprised of the same lipids and cholesterol content, which we use to validate our choice of simulation parameters (namely the cross-sectional area). The bilayer structure obtained from these simulations is an important result in understanding the fundamental molecular interactions that determine the effects of cholesterol on critical membrane properties.
MATERIALS AND METHODS
Sample preparation
Synthetic 1,2-dimyristoleoyl-sn-glycero-phosphatidylcholine (diC14:1PC) and 1,2-dierucoyl-sn-glycero-phosphatidylcholine (diC22:1PC) were purchased from Avanti Polar Lipids (Alabaster, AL) and used without further purification. Cholesterol was obtained from Sigma-Aldrich (St. Louis, MO). All other chemicals were reagent grade. Lipid was cosolubilized in chloroform with 40 mol % cholesterol in a glass vial. Before preparation of ULV samples, the chloroform was evaporated under a stream of nitrogen gas, followed by vacuum pumping. The lipid film was then dispersed in 18 MΩ-cm water (Millipore, Billerica, MA) at a total lipid concentration of 20 mg/mL. The lipid dispersions were extruded using two polycarbonate filters with pore diameters of 500 Å (25 times); hence a final ULV size ∼600 Å (23).
Nonextruded samples were also prepared, as described above, and were examined for the presence of cholesterol crystals in separate x-ray measurements carried out at the University of Minnesota's Characterization Facility. In agreement with the literature (24), we have detected peaks corresponding to crystallized cholesterol at a cholesterol concentration of 75 mol %, but not at and below 45 mol % (Supplementary Material, Data S1).
Oriented samples were prepared using the rock-and-roll method (25). First, the lipid sample (4 mg) in chloroform (200 μl) was deposited onto a flat 15 × 30 × 1 mm acid cleaned silicon wafer, subjected to shear during evaporation of the organic solvent in a glove box. The sample was dried for 1 day in the fume hood and then trimmed to 5 mm along the beam direction (for details see Tristram-Nagle (26)). Hydration was carried out from water vapor in a thick-walled hydration chamber.
X-ray scattering from ULVs
X-ray data on ULVs were taken at the D-1 station located at the Cornell High Energy Synchrotron Source (CHESS). Scattered x-rays (λ = 1.18 Å) were collected using a Medoptics charge-coupled device (CCD, 1024 × 1024 pixel array), with linear dimensions of 47.19 μm per square pixel. The sample-to-detector distance was 322 mm, determined using a silver behenate standard. Standard 1.5 mm quartz capillaries were used as sample cells. Collected images were “dezingered” and processed for CCD distortion and intensity corrections using calibrated files supplied by CHESS. All data sets were normalized using the incident beam intensity measured through a semitransparent beam stop made out of a 225-μm thick molybdenum foil. Subtraction of the scattering from water was done according to Kučerka et al. (23) (see Data S1 for primary data).
X-ray scattering experiments measure the amount of x-rays scattered (i.e., intensity) from a given system. Unlike the case of Bragg diffraction from multilamellar structures (8,14,27,28), which result in a series of discrete scattering peaks, single bilayer systems offer scattering curves that are continuous in scattering vector q [q = 4π/λ sin(θ/2), where λ is the wavelength and θ is the scattering angle]. The intensity is made up of scattering from the lipid bilayer itself, as well as scattering from the ULVs and their associated interparticle contributions, referred to commonly as the structure factor. However, the assumption of nonspecific association of vesicles predicts that the structure factor is almost unity for q > 0.01 Å−1, confirmed experimentally for neutral ULVs with total lipid concentrations of <3 wt% (23). In addition, scattering contributions from the ULV spheres decay rapidly and are practically nonexistent for q > 0.03 Å−1 (23), leaving only the lamellar scattering contribution at higher q. Therefore, over the q range of our experiment the scattering intensity is proportional to the square of the bilayer form factor and a correction due to the random orientation of bilayers (q−2). To facilitate the structural analysis of a single bilayer it is convenient to express experimental measurements in terms of the form factor, which we calculate from the following equation:
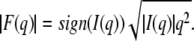 |
(1) |
Note the possibility of unphysical negative values for |F(q)|, which result as the intensity approaches zero. The statistical noise in the experimental data requires an equal distribution of values above and below zero, otherwise the averaged data would be biased toward a nonzero intensity.
X-ray scattering from ORIs
X-ray data on ORIs were taken at Carnegie Mellon University using the Rigaku RUH3R rotating anode with wavelength 1.5418 Å. A Xenocs FOX 2D focusing collimator produced a horizontally parallel beam that was then further collimated using a Huber slit to 1.2 mm tall to fully cover the sample at all rotation angles, and 1.2 mm wide. The flat samples inside the hydration chamber were rotated from −3° to 7° in θ during the data collection. Data were collected in 5-min scans using a Rigaku Mercury CCD detector. Silver behenate was used to determine the sample-to-detector distance of 313.5 mm.
Analysis of diffuse x-ray scattering from oriented lipid samples (see Data S1 for primary data) was pioneered by the Nagle lab (29). The diffuse x-ray scattering is quasi-elastic and the dynamic time range is very short, so the data represent the thermal average of many snapshots of the positional disorder in the sample. The detailed theory to calculate the structure factor includes the bilayer bending modulus KC and the compression modulus B, which appear in the well established fluctuational energy for smectic liquid crystals (30). The membrane-membrane pair correlation functions follow from this statistical theory and a computer program calculates the structure factor S(q) for given values of KC and B (29). Once the structure factor is calculated, KC and B are fixed and the form factor is determined as
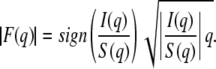 |
(2) |
All-atom MD simulations
Bilayer systems were constructed using the widely used MD simulation program, CHARMM (version 32). Periodic boundary conditions were applied using a constant number of atoms (N), temperature (T), lateral area (A), and normal pressure (PN), to form NAPNT ensembles. The temperature in each simulation was set to 303 K. In this study we consider two types of monounsaturated lipids namely, diC14:1PC and diC22:1PC. In each case, the single component systems were constructed of 200 lipids (i.e., 100 per leaflet) and hydrated with 42.6 water molecules per lipid. 40 mol % cholesterol systems were built by substituting 80 randomly selected lipids (i.e., 40 per leaflet) with cholesterol molecules. All systems were run for 20 ns using NAMD, and analysis was carried out from 10 to 20 ns of the simulation trajectory. A cutoff of 10 Å was used for van der Waals interactions (31), and particle mesh Ewald summation was used for electrostatic interactions. The time step was 2 fs and all bonds involving hydrogens were fixed using the SHAKE algorithm with a numerical convergence tolerance (relative deviation) of 10−8 Å.
The primary parameter obtained from MD simulations is the area of the entire simulation box, AMD. However, to facilitate the comparison of results for different systems, it is more appropriate to express results in terms of the area that corresponds to a single lipid molecule, AL, and/or a single unit cell, AUC, comprised of a single lipid molecule and the appropriate fractional amount of cholesterol (40 mol % in our case). These two parameters correspond to the same entity in the case of single component systems. The combined areas for the lipid and fractional cholesterol can be determined in accordance with the definition of the partial specific area (32), which, however, requires simulations for several concentrations of cholesterol. As this is not our primary focus, we report only the values of unit cell areas AUC, where AUC = AMD/nL, with nL being the number of lipids per monolayer (100 lipids in pure systems and 60 in the cholesterol systems).
Simulation snapshots of the system were averaged and the positions of different atoms transformed into number histograms. Electron density profiles ρ(z) were calculated as products of number densities simulated for each atom and the number of electrons contained by that atom. The scattering form factors, F(q), were then calculated from the water subtracted Δρ(z) = ρ(z) − ρW as
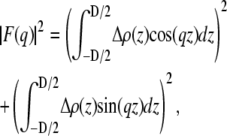 |
(3) |
where D is the length of the simulation cell in the z direction and ρW is the electron density of bulk water. Note, that the contribution from the sine part is non-zero for an asymmetric bilayer only. Fig. 1 shows an example of F(q) calculated for diC22:1PC + cholesterol bilayers simulated at three different areas and compared to the experimentally obtained F(q). It should be noted that the absolute scale of the experimental data is not known from the experiment, but has to be determined by other means. In our case, this can be done by scaling the experimental data to the simulated form factors (expressed in absolute units) by carrying out the simple calculation
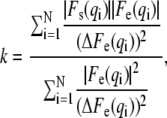 |
(4) |
where |Fe(q)| and ΔFe(q) are the experimental form factor (Eq. 1 and/or 2) and its uncertainty, respectively, measured at a scattering vector q. |Fs(q)| is a simulated form factor (Eq. 3), calculated at the same position in q, and N is a total number of data points.
FIGURE 1.

Form factors, F(q), from experimental ULV x-ray scattering and MD simulations. Simulations were carried out at three different areas of the simulation box, AMD, fixed at 75 × 75 Å2 (AUC = 93.8 Å2), 68 × 68 Å2 (AUC = 77.1 Å2) and 70 × 70 Å2 (AUC = 81.7 Å2), respectively. Vertical lines mark the positions of the three minima that are clearly evident in the experimental scattering curves.
An important consideration in these simulations is determining if and when the system has converged. To ensure that the bilayer thicknesses were in a pseudo-equilibrated state, we extended the diC14:1PC + cholesterol simulations out to 50 ns. We found no discernible change in the calculated F(q), with the location of the peaks and minima varying <0.005 Å−1. As will be discussed, on these timescales the overall equilibration in the bilayer normal direction does not necessarily ensure convergence of the structural properties in the plane of the bilayer, as for example with regards to the diffusion of lipid and cholesterol and domain formation.
Simulation-based analysis
The data analysis used in this work is based on atomic-level MD simulations, which are compared to experimentally obtained x-ray scattering form factors in q-space. Unlike model-based analyses carried out in real space, this approach does not make any assumptions about bilayer structure, volumes, or distances between the different lipid components needed to analyze experimental data. Such additional information is necessary to evaluate lipid area from scattering data (17) whereas it is an inherent parameter in MD simulations. Combining MD simulations with experimental data then permits the use of simulation-based methods to determine lipid area, as suggested in Klauda et al. (19).
According to this notion, we start with MD simulations carried out at a fixed area, approximated from a lipid whose area has been determined previously. For example, a simulation box area AMD = 75 × 75 Å2, corresponding to an area per lipid of AUC = 93.8 Å2, was used in the case of bilayers made up of diC22:1PC and 40 mol % cholesterol. It is obvious from Fig. 1 that our initial choice for area strongly disagrees with experimental data and had to be modified in subsequent simulations. Such a conclusion is drawn from the comparison of the minima and maxima positions, as these are the most important features of the F(q) curve (23). The positions of the three minima that can clearly be identified from the experimental scattering curves are highlighted by the vertical lines shown in Fig. 1. These “fingerprints” for the scattering curve corresponding to the initial simulation appear at q-values other than those for the experimental data. Based on this comparison, and the well-known inverse relation between the distances in real space and q-space, we can readily deduce the direction in which to change AUC. As the bilayer simulated at AUC = 93.8 Å2 proved to be too thin, we carried out a subsequent simulation at a smaller value of AUC (77.1 Å2). Although an improvement, the discrepancies (now in other direction) were still unacceptably large. Our final simulation was carried out with the area fixed at 81.7 Å2. The simulated and experimental form factors match almost perfectly (Fig. 2). Typically, it took at least three separate simulations before converging on the correct area.
FIGURE 2.

Top panels show comparison of experimental ULV form factors, F(q), and those calculated from the simulation carried out at a fixed area which was obtained from the simulation-based analysis of diC22:1PC bilayers without (left top panel) and with (right top panel) 40 mol % cholesterol. The two bottom panels show the electron density profiles (EDP) of half a bilayer as obtained from simulations (black). The lipid molecule is divided into terminal methyl groups (red), double bonded moiety (green), methylenes (blue), carbonyl (cyan), glycerol (magenta), phosphate (yellow), choline (dark yellow), all of which add up to the EDP of a single lipid. The EDP of a total bilayer consists then of lipid EDP, water profile (navy blue) and the EDP of cholesterol (purple).
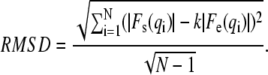
The agreement/disagreement can be visually detected from the plots such as those shown in Fig. 1, or can be quantified by calculating the root mean-square deviations (RMSD) as in Klauda et al. (19). In this procedure, the experimental data have to be scaled to the simulated form factors (following Eq. 3) before RMSD is calculated from
 |
(5) |
An RMSD value of 0.088 was calculated for our final simulation, supporting our conclusion of a good match between the simulated and experimental data. In addition, RMSD values calculated for the three simulated areas allowed us to plot a parabolic function, allowing us to estimate the area minimum. Surprisingly, this estimate yielded a value of 84.0 Å2. However, additional simulations carried out using this area resulted in RMSD = 0.116, larger than what we expected. On the other hand, the assumption that RMSD is parabolic with respect to area (19) is likely valid in the vicinity of the minima, only. It seems that when using our largest area (93.8 Å2) RMSD value to determine area, the analysis is derailed. When we plot RMSD on a more refined area range (79.4–84 Å2), we obtain an estimated area of 81.6 Å2. This result is in good agreement with our conclusion which was drawn from a direct comparison of the simulated to experimental data. Note that although this discrepancy can be further decreased by carrying out additional simulations in the vicinity of the estimated minima, it is limited by the experimental uncertainty, which is ∼0.5 Å2 (33).
RESULTS
Bilayer structure: ρ(z) from F(q)
We have run all-atom MD simulations and carried out x-ray scattering experiments on four different bilayer systems, consisting of either diC22:1PC or diC14:1PC, with and without 40 mol % cholesterol. Using both the experimental and computationally derived form factors, F(q), we have applied the simulation-based analysis approach to determine the appropriate cross-sectional areas, i.e., AL in the case of pure lipid bilayers and AUC in the case of the cholesterol/lipid mixtures. The results are shown in Figs. 2–5, as well as in Table 1.
FIGURE 3.

Comparison of experimental form factors, F(q) (top panels), and those calculated from a simulation carried out at a fixed area which was obtained from the simulation-based analysis of diC14:1PC bilayers without (left top panel) and with (right top panel) 40 mol % cholesterol. The two bottom panels show the EDP of half a bilayer as determined from simulations. The system is divided into components with the coloring scheme as in Fig. 2.
FIGURE 4.

Experimental ULV form factors F(q) of diC14:1PC bilayers with 40 mol % cholesterol compared to the simulation carried out with an asymmetric (51/29) distribution of cholesterol. Bottom panel shows the electron density profiles with the coloring scheme as in Fig. 2.
FIGURE 5.

Experimental ORI form factors F(q) of diC14:1PC bilayers with 40 mol % cholesterol compared to the simulation. Bottom panel shows the electron density profiles with the coloring scheme as in Fig. 2.
TABLE 1.
Bilayer parameters obtained from simulation-based analysis
| Bilayer | Area AUC (Å2) | RMSD | Thickness DHH/2 (Å) | Thickness DC/2 (Å) | Thickness DB/2 (Å) | Average lipid chain tilt angle (°) | Average nearest lipid chain tilt (°) | Average nearest ipid chain tilt above db (°) | Average cholesterol tilt angle (°) |
|---|---|---|---|---|---|---|---|---|---|
| diC22:1PC | 68.3 | 0.156 | 22.3 | 17.5 | 22.1 | 36.9 | — | — | — |
| diC22:1PC + chol | 81.7 | 0.088 | 24.0 | 19.7 | 23.7 | 27.4 | 26.5 | 18.7 | 15.2 |
| diC14:1PC | 70.2 | 0.081 | 15.2 | 10.8 | 15.4 | 15.2 | — | — | — |
| diC14:1PC + chol (ORI-symmetric) | 91.3 | 0.103 | 17.3 | 13.3 | 16.5 | 34.9 | 32.3 | 32.7 | 24.2 |
| diC14:1PC + chol (ULV-averages) | 91.3 | 0.086 | 17.0 | 13.2 | 16.5 | 35.8 | 32.2 | 32.2 | 22.5 |
| diC14:1PC + chol (Chol.-enriched) | 91.3 | 0.086 | 18.1 | 14.0 | 17.3 | 29.7 | 26.9 | 28.1 | 19.3 |
| diC14:1PC + chol (Chol.-depleted) | 91.3 | 0.086 | 15.9 | 12.3 | 15.8 | 42.0 | 37.6 | 36.4 | 28.2 |
The last three rows report results of an asymmetric simulation that was used to match the ULV experimental data.
In the case of single component, cholesterol-free bilayers, we determined lipid areas of 68.3 and 70.2 Å2 for diC22:1PC and diC14:1PC, respectively (Figs. 2 and 3). The value for the long-chain lipid agrees well with the value of 69.3 ± 0.5 Å2 obtained from a model-based analysis of x-ray scattering data (33). Our present results also coincide with small angle neutron scattering (SANS) experiments that showed lipid area being maximal for diC18:1PC, decreasing linearly with both increasing and decreasing chain length (9). As a result, the per lipid areas of diC14:1PC and diC22:1PC bilayers are expected to be similar to one another, but less than that of diC18:1PC [72.4 Å2 as determined in Kučerka et al. (33)], as is indeed the case (Table 1). We note, however, that our experimental values are ∼5 Å2 larger than those calculated from SANS experiments although the inconsistencies between x-ray and neutron experimental results have been discussed recently (9).
Fig. 2 shows results for diC22:1PC without (left panel) and with (right panel) 40 mol % cholesterol. Excellent agreement between experimental and simulated form factors can be seen throughout the first three lobes of both bilayers, including the minima. Although there is increased noise in the fourth lobe of the experimental data, there is still good agreement as far out as q ∼ 0.6 Å−1, extremely high resolution for ULV experiments. The matching of simulated and experimental scattering intensity amplitudes over the entire q-range remains a challenge to all lipid force-fields (21). However, the agreement between our experimental and simulated data over an extended range in q is an improvement when compared to simulation-based studies published previously (19,22,34).
These form factors are the Fourier transform (Eq. 3) of the total bilayer electron density profile (EDP). The headgroup-to-headgroup thickness, DHH, is defined by the distance between the peaks in the EDP and is widely used as a measure of the overall bilayer thickness, especially in x-ray experiments. More refined descriptions of intramolecular distances are commonly obtained in the literature via alternate definitions of thickness (DC and DB), which cannot be obtained directly from the total EDP. Instead, the positions and/or widths of the separate functional groups obtained in the simulations must be used to calculate these thicknesses (17). The bottom panels of Fig. 2 show the simulated EDPs of the total bilayer and of the individual chemical group distributions, along with DC and DB. DC represents the hydrocarbon thickness, important when considering the hydrophobic matching of lipids, proteins and cholesterol. DB is the Luzzati thickness and corresponds to the Gibbs dividing surface between water and the bilayer. The dividing surface criterion for DB and DC is that the integrated probability of the bilayer fraction (hydrocarbon chain) outside DB (DC) is equal to the integrated deficit probability inside DB (DC) (17). For diC22:1PC, the addition of 40 mol % cholesterol increases DHH by 3.5 Å and DC by 4.4 Å, suggesting that the impact of cholesterol, with regards to the thickness, is almost entirely within the hydrocarbon core of the membrane, although the difference of ∼1 Å indicates a minor change in projected headgroup length as well. Consistent with the change in DHH, cholesterol increases DB of diC22:1PC bilayers by 3.3 Å.
Fig. 3 shows our initial diC14:1PC results. For the pure bilayer (left panel), the form factors show good agreement through the first and second lobes, the most reliable part of the data. Note that q-values of, for example, the third lobe correspond (in q, Å−1) to the fourth lobe of the diC22:1PC lipid (compare Figs. 2 and 3), as the q-values are simply shifted in accordance with the bilayer thickness. As a result, the agreement between the experimental ULV scattering and simulation is not as good when it comes to the third lobe, where there are large uncertainties associated with the experimental data. Moreover, with increasing q there is a rapid decrease in signal/noise, which becomes evident when the water background is subtracted. This poor signal/noise is further amplified after multiplication by q2 when calculating the form factors (Eq. 1). To clarify these data for the diC14:1PC samples, we have also carried out x-ray scattering experiments on oriented multilamellar stacks, whose resolution is considerably better at higher q. The agreement between the simulation, ULV and ORI samples is excellent for q < 0.5 Å−1. As can be seen, the agreement between the simulation and experimental data is significantly improved for q > 0.5 Å−1 by including ORI scattering data. This is consistent with previous studies that used combined experimental data obtained from ULV and ORI samples (33,35). It was shown, that for small q, the |F(q)| results from ULVs are distinctly superior to the results from diffuse scattering from oriented stacks. For large q, in contrast, the scattering from ULVs is much weaker than background whereas the diffuse scattering from ORIs remains strong enough for analysis. More importantly, the |F(q)| results from ORIs overlap nicely with the ULV results confirming that both sample preparations comprise the same bilayers.
Our most complicated result comes from diC14:1PC bilayers with cholesterol. Initial simulations were not able to reproduce the behavior of the ULV experimental data in the region of the first minimum, which unlike the other systems does not reach zero (Fig. 3, top right panel). We have seen this same feature in similar experiments (where we increased the diC14:1PC ULV size by a factor of two, as well as for diCn:1PC with 45 mol % cholesterol, where n = 14, 16, and 18) suggesting that this phenomenon is invoked by the higher concentrations of cholesterol in short-chain lipid bilayers. We have recently discussed the structural implications of non-zero minima, showing that for single-component ULVs (of a size >600 Å) comprised of electrically charged phosphatidylserine lipids, but not neutral PC lipids, the bilayer electron density profile is asymmetric (23). To ensure that this “lift-off” in the first minimum was not an experimental artifact (e.g., formation of cholesterol crystals), we carried out x-ray scattering measurements on samples of multi-lamellar vesicles. Consistent with previous reports (24), no crystals were detected in samples with 45 mol % cholesterol or less.
To confirm the effect of bilayer asymmetry on the F(q) (namely the ‘lift-off’ in the first minimum), we simulated a series of asymmetric bilayers. Although a relatively novel approach, there is recent precedent for such asymmetries in simulation (36). Starting with the equilibrated, symmetric diC14:1PC + cholesterol bilayer, we built and ran 10 additional simulations, varying the degree of cholesterol asymmetry in each case. One at a time, we flipped cholesterol molecules, simulating increasingly cholesterol-depleted and cholesterol-enriched leaflets. Each progression included minimization and short dynamics, from which the F(q) was calculated (using Eq. 3 that, unlike previous analyses of simulations, includes the imaginary part of the Fourier transform). With increasing cholesterol asymmetry, the magnitude of the first minimum in F(q) grew progressively more positive without affecting the lateral features of the data. Once the degree of asymmetry was established by matching the magnitude of this “lift-off” to that in the experimental curve, the box-area of the simulation was modified to match the positions of the minima. Fig. 4 shows the best match with the ULV experimental data, wherein a final cholesterol distribution of 51/29 and a fixed area of AMD = 74 × 74 Å2 (corresponding to a per-lipid unit cell area AUC = 91.3 Å2) led to an almost 20% improvement in the agreement between the experiment and simulation.
The bottom panel of Fig. 4 shows the EDPs from MD simulations whose form factors best fit the experimental data of diC14:1PC + cholesterol ULV samples. The cholesterol asymmetry can be detected in subtle changes in the total EDP, with the asymmetry sharpening the lipid-component distributions in the cholesterol-depleted side, while broadening them in the cholesterol-enriched side.
It is highly likely that the physical properties of the ULVs themselves promote this asymmetry. Thus, to ensure our simulations were matched against data from the appropriate sample conditions, Fig. 5 presents the scattering data for diC14:1PC + 40 mol % cholesterol ORI sample. Unlike the ULVs, these data clearly reach zero at the minima (this is also clearly seen from the primary data (Data S1)). The figure shows excellent matching between the simulation and the ORI data throughout q, validating the parameters for our simulation (AUC = 91.3 Å2). All subsequent analyses for diC14:1PC + cholesterol samples will refer to this simulation.
The bottom panels of Figs. 3 and 5 show the EDPs from MD simulations whose form factors best fit the experimental data of diC14:1PC samples. We find cholesterol induces DHH to increase by 4.3 Å, DC by 5.1 Å, but DB by only 2.3 Å. Thus, the first two parameters changed similarly to those observed in diC22:1PC bilayers, whereas the change in the latter thickness suggests even more noticeable reorganization of headgroup structure. This observation that cholesterol has a different impact on the bilayer's hydrocarbon and lipid headgroup regions would not be possible via a model-based approach, in which the various intrabilayer distances are usually derived from DHH only.
Having established excellent matches between our simulated and experimental data, we now proceed with a detailed, quantitative analysis of the effect of cholesterol on diC14:1PC and diC22:1PC bilayers, and address the changes in their structures. The addition of 40 mol % cholesterol to long- and short-chain lipid bilayers increases the lateral area per unit cell by 13.4 Å2 and 21.1 Å2, respectively. The difference between these two changes, unlike in a case of bilayer thickness, is non-negligible. However, by considering changes to bilayer thickness (i.e., DB) in conjunction with changes in area, we calculate that the addition of 40 mol % cholesterol increases the total volume of these bilayers (i.e., diC14:1PC and diC22:1PC) by ∼425 Å3 per lipid, corresponding to a total volume of ∼640 Å3 per cholesterol molecule. This is in good agreement with a previously reported value of 630 ± 10 Å3 (37).
The fact that unit cell area, on addition of cholesterol, increases more in the shorter-chain lipid when the hydrocarbon thickness change is nearly the same for both lipids suggests a variety of compensating mechanisms. As can be seen from the component EDPs (Fig. 5), in the case of diC14:1PC there is significant cholesterol density at the bilayer center. This is because cholesterol tails are not restricted to one monolayer, but instead interdigitate with those from the apposing monolayer. This is not the case in diC22:1PC bilayers (Fig. 2) where the tails do not extend beyond the bilayer center. Because there is no overlap in diC22:1PC bilayers we can extract a projected cholesterol length of 15.2 Å, based on the Gibbs dividing surface for the diC22:1PC cholesterol density distribution. For comparison, our value for DC/2 in pure diC22:1PC is 17.5 Å, which is more than thick enough to accommodate a cholesterol molecule.
Interestingly, our value of DC/2 = 10.8 Å for pure diC14:1PC is significantly shorter than would be required to accommodate an unbent, untilted cholesterol molecule. Thus, in addition to the previously discussed cholesterol tail interdigitation, that likely serves to ameliorate this mismatch, several other adjustments emerge from the analysis of our simulations. The most obvious adjustment is molecular tilt. One can think of cholesterol as being anchored in the lipid headgroup region by hydrogen bonds between its hydroxyl group and the lipid carbonyl and phosphate moieties, as has been reported previously (38), and as we have observed. Thus, cholesterol's hydroxyl group acts as a pivot point around which cholesterol tilts. Fig. 6 shows the distribution of cholesterol tilt angles with respect to the bilayer normal—the cholesterol vector is defined along the length of the molecule. In the thick bilayer, cholesterol's mean tilt angle is only ∼15.2°, whereas it is ∼24.2° in the case of the thinner bilayer. Using the previous diC22:1PC results for a projected length and tilt of cholesterol, and simple trigonometry, we then estimate the average length of cholesterol to be ∼15.7 Å, a number very close to the 16.6 Å value reported for 50 mol % cholesterol embedded in diC16:0PC bilayers (39). We note that our value overestimates the hydrophobic length of cholesterol by at least 1 Å, due to the hydrophilicity of the hydroxyl group.
FIGURE 6.

The distribution of cholesterol tilt angles in diC14:1PC and diC22:1PC bilayers. A value of zero indicates a state in which cholesterol is perpendicular to the bilayer plane.
The obvious advantage of a simulation-based analysis using an all-atom simulation is that structural information beyond just the overall thickness is made available. Probing more deeply into the simulation data shows subtle differences in the molecular organization of these systems. In the thinner bilayer, the cholesterol's hydroxyl group is positioned ∼1 Å above the lipid carbonyls, its hinge point (connecting the sterols to the acyl tail) is aligned with the lipid's double bond, and its tail is interdigitated with the apposing monolayer. In the thicker bilayer, the cholesterol's hydroxyl is aligned with the carbonyl (thus translated into the bilayer center as compared to the thinner bilayer), its hinge point is above the double bond and its tail is not interdigitated. Although there are instances in which the lipid chains interdigitate in both bilayers, these events are relatively rare.
Lipid tilt and order parameters
As shown in Table 1, we have calculated lipid chain tilt on a per chain basis (i.e., our calculation does not distinguish between splayed sn1 and sn2 chains, so we are not reporting the overall lipid tilt). We observe that in cholesterol-free systems, diC14:1PC has a greater degree of chain tilt, suggesting a greater degree of bilayer disorder. On insertion of cholesterol, average acyl chain tilt angles are reduced by approximately the same amount in both lipids. One might anticipate that insertion of a rigid rod (cholesterol) into these tilted chain bilayers might lead to tilt-match between the lipid chains and cholesterol. We have analyzed these tilts using both entire molecules, as well as by breaking the lipid and cholesterol molecules into moieties (i.e., sterol rings and chain in the case of cholesterol, and above and below the double bond in the case of the lipid). After extensive comparisons we conclude that in diC22:1PC bilayers there is a greater degree of matching between the cholesterol and the upper portion of its closest lipid neighbor than in diC14:1PC bilayers (last two columns of Table 1). The greater degree of mismatch in diC14:1PC is most likely the source of the greater increase in AUC. In all other cases, we find no significant degree of tilt matching, though we note again that cholesterol reduces the overall lipid chain tilt in both bilayers.
The overall chain disorder in bilayers is frequently measured experimentally by way of the NMR deuterium order parameter, SCD, which can be calculated directly from simulations via analysis of the acyl chain C-H bonds. Fig. 7 shows that for all systems studied here, there is a nearly flat region starting at carbon C3. This region is interrupted by a sharp dip at the location of the double bond and its nearest neighbors, which is then followed by another plateau region. Such behavior is typical for monounsaturated lipid bilayers and has been reported for 18 carbon phosphatidylcholines (40–42). Overall, the simulated order parameters are lower for diC14:1PC bilayers, which is reflected in the larger area per molecule and smaller membrane thickness for this system compared to diC22:1PC. As would be expected, in the asymmetric simulation the chain order is greater in the more densely packed cholesterol-enriched leaflet than in the cholesterol-depleted leaflet (not shown), though the shape of the function does not change. More importantly, addition of cholesterol increases chain order in the phospholipid tails of both bilayers. We observe a chain order increase by a factor of ∼1.5, in good agreement with a previous report of diC16:0PC bilayers containing 50 mol % cholesterol (39). This result supports the conclusion that, like thickness, cholesterol affects the chain order of “thin” and “thick” lipid bilayers in a similar manner.
FIGURE 7.

Deuterium order parameters (−SCD) for the phospholipid tails of diC14:1PC and diC22:1PC bilayers, with and without cholesterol, and averaged over the two leaflets of the bilayer. The values are also averaged over both sn-1 and sn-2 chains, as they were found to be very similar.
Dynamic cholesterol re-orientations
Fig. 8 shows a snapshot from the diC14:1PC + cholesterol simulation, highlighting a very interesting finding of our study. The predominant configuration of cholesterol in both bilayers is the canonical one. However, in the thin bilayer there are many cases where cholesterol molecules transiently orient perpendicular to the bilayer normal, with the hydroxyl group submerged in the center of the bilayer. This is in contrast to the behavior of cholesterol in the thick bilayer, where we see no such reorientations. The reorientation of cholesterol may be biologically significant when viewed as a possible mechanism for its transport across the membrane.
FIGURE 8.

Snapshot of the diC14:1PC + cholesterol bilayer highlighting a cholesterol molecule in the perpendicular orientation. The cholesterol bodies are shown in yellow and hydroxyls in red, with the perpendicular cholesterol shown in space filling form for emphasis; water molecules are omitted for clarity.
To quantify the propensity of cholesterol to adopt the perpendicular configuration, we arbitrarily define such a state based on the angle made between the long-axis of cholesterol and the bilayer normal (θ), whereby angles >75° are considered perpendicular. Given this definition, we observed 42 independent occurrences over a 30 ns stretch of the asymmetric simulation of the diC14:1PC + cholesterol bilayer. Of these 42 occurrences, all but one occurred on the cholesterol-depleted side. We have defined the lifetime of these orientations based on when the cholesterol enters the perpendicular state and when it has reestablished itself in an upright orientation, in this case, θ < 45° (when cholesterol reaches 75° it is considered to be in the perpendicular orientation all the way down to θ = 45°). Using this definition the average lifetime of the perpendicular configurations is ≈800 ps, although in several instances it is >1 ns, and in one case lasts over 5 ns. It should be noted, that although Fig. 6 shows that the likelihood of finding a cholesterol at >75° is small (<1%), according to the previously defined dynamics of reorientation there are, at any time, 1.4% of the cholesterol molecules involved in such events. These reorientation events were also seen (with only slightly less frequency and slightly shorter lifetimes) in the symmetric diC14:1PC + cholesterol simulation. Thus, we conclude that the cholesterol reorientation is not induced by the bilayer asymmetry, but is rather a property intrinsic to leaflets with relatively large areas (e.g., in the diC14:1PC systems, compared to the diC22:1PC systems). Our conclusion is also consistent with similar observations in the case of polyunsaturated lipids (43,44).
We have observed in almost all instances of reorientation that as the cholesterol tilts there is a concurrent switching of the hydroxyl's hydrogen bonding partner to a different acceptor atom on either the same or an adjacent lipid. An example of this process is shown in Fig. 9, wherein the hydrogen bonding partner switches from the phosphate to the carbonyl as the cholesterol becomes perpendicular. However, these types of hydrogen bonds also occur in the diC22:1PC bilayers, without leading to the perpendicular orientation. Therefore, to understand what differences lead to the reorientation, it is necessary to consider other, more macroscopic structural features of the two bilayers.
FIGURE 9.

Sequential snapshots of a single lipid (right), cholesterol (left), and water molecules within 5 Å of the cholesterol hydroxyl, showing with detail the dynamically changing interactions that facilitate a cholesterol's transition from an upright to a perpendicular orientation. Other nearby molecules have been omitted to emphasize the relevant details. Black dashed lines suggest potential hydrogen bonds.
Compared to the thicker bilayer, our results show that the thinner bilayer is more disordered, has higher molecular tilts, and has a large degree of cholesterol interdigitation between the two bilayer leaflets. Perhaps most significantly, the overall lateral area is greater in the thinner bilayer. Collectively, these data suggest that decreased lipid order and density confer greater conformational freedom to cholesterol and accommodate the reorientation. In addition to these differences between the thin and thick bilayers, the simulations show two additional structural differences that allow and encourage the reorientation in the thin bilayer. First, the diC14:1PC + cholesterol bilayer is significantly more permeable to water than diC22:1PC + cholesterol. These waters participate in the cholesterol reorientation, as we observe numerous instances, including the example shown in Fig. 9, where water molecules interact with the cholesterol hydroxyl as it submerges into the nonpolar bilayer center. Second, the carbonyls of the shorter lipid are significantly closer to the bilayer center than those of the thicker bilayer. We speculate that these two features create a locally polar environment, which stabilizes the cholesterol hydroxyl within the nonpolar bilayer core.
One might assume that cholesterol molecules that reach a fully perpendicular state are primed for a flip-flop event. It is likely that for cholesterol to successfully flip, the stabilizing hydrogen bonds formed with either water, or the lipids of the originating leaflet, must first be broken and then reformed with the molecules in the destination leaflet. Once laying flat in the center of the bilayer, a cholesterol is equally likely to flip or return to its original leaflet. We observed six events in which cholesterol was found tilted to >85°. Of these, only one was both submerged to the center of the bilayer and lacked hydrogen bonds to lipids or water, remaining “unpartnered” for ≈300 ps (it subsequently returned to a parallel orientation in its original leaflet after ≈500 ps).
In the symmetric diC14:1PC + cholesterol simulations, we observed a single event over a 50 ns span in which a cholesterol molecule flipped entirely across the bilayer, starting in the parallel configuration, momentarily pausing in the center of the bilayer in the perpendicular configuration (as in Fig. 8), and then eventually righting itself in the opposite leaflet. The time-span for this flip was ∼5 ns. Whereas extracting quantitative parameters from single events in simulations must be approached with a measure of skepticism, we present them here given their potential importance. With this caveat, we calculate a rate of flip-flop on the order of 107/s, corresponding to a half-life of ∼10−8 sec, consistent with recent coarse-grained simulations (44), but significantly faster than has been reported experimentally.
DISCUSSION
It has been shown previously that cholesterol can either increase or decrease bilayer thickness, depending on the phospholipid's thermodynamic state, acyl chain length, and saturation (8,9,15). According to the widely accepted model of lipid-cholesterol interactions, cholesterol affects membrane structure in two ways (2,8,15,45–49). First, due to its rigid structure, cholesterol increases the chain order of lipid molecules resulting in an increased bilayer thickness. On the other hand, it is commonly assumed that the relatively inflexible hydrophobic sterol backbone of cholesterol determines the hydrocarbon thickness of the bilayer by way of a matching mechanism. Based on this second assertion, it might be expected that cholesterol would decrease the thickness of long-chain lipid bilayers whose hydrophobic thickness, DC, is greater than the hydrophobic length of cholesterol. However, our results prove otherwise. We observe bilayer thickening even in the case of the very long-chain diC22:1PC system, for which DC is several angstroms greater than that of the cholesterol molecule itself. Additionally, one typically thinks of the tilting of membrane insertions (e.g., cholesterol, peptides) in the context of minimizing mismatch. It is thus counterintuitive that cholesterol should adopt a nonzero tilt in the diC22:1PC bilayer. It is not clear whether the difference in overall cholesterol tilt in the two bilayers (Fig. 6) is due to hydrophobic matching, or matching between the cholesterol and the upper portion of its lipid neighbor (Table 1). It is interesting, however, and perhaps informative, that cholesterol reduces the underlying lipid chain tilt in both cases. Collectively, these results imply that the overriding influence of cholesterol is on the ordering of lipid hydrocarbon chains, rather than on rectifying the hydrophobic mismatch.
It is well established that cholesterol adopts an orientation parallel to the lipid chains in a bilayer. That is, the lipid headgroups and cholesterol hydroxyls sit in approximately the same plane, a configuration thought to be stabilized by hydrogen bonding (38,50). Furthermore, the body of the cholesterol (sterols and acyl tail) aligns with the acyl chains of the lipid. That cholesterol so strongly prefers this orientation has implications for its ability to move across membranes. Movement between membrane leaflets is a necessary process for the intracellular trafficking of cholesterol, and plays an important role in cell homeostasis. Therefore, there has been a long and evolving discussion regarding cholesterol transport across membranes. Biophysical studies, in particular, have focused on the time-scale for cholesterol “flip-flop”, with a wide range of estimates (51–55).
An asymmetric transbilayer distribution of lipid and cholesterol has been detected in the case of short-chain lipid bilayers in ULVs, which was not observed in oriented, fully hydrated samples. Although this ULV result was readily concluded from the specific features of the scattering curve, information about the “orientation” of the asymmetry is obscured. The experimental data do not allow us to distinguish between the inner and outer leaflet of the bilayer, as the effective change in vesicle structure corresponds to only a few angstroms compared to ∼600 Å total size. Nevertheless, we can hypothesize that there are more cholesterol molecules located on the inner side of the bilayer, based on the information available from the literature and our results. The conical shape of cholesterol has been known to impart a negative curvature to lipid bilayers, with a tendency to accumulate in high curvature regions (56), which in the case of ULVs, is the inner leaflet for both lipids studied. However, our observation of the asymmetric distribution of cholesterol only in the case of diC14:1PC suggests that additional factors are at play. It is likely that the large mismatch between the cholesterol and lipid tilts that we observed in our simulation underlies the partial demixing of the two compounds. Consistently, the same separation does not occur in the case of diC22:1PC + cholesterol, for which the tilt mismatch is decreased and the two molecules are less distinguishable.
We have shown that the tilt of the cholesterol molecule does not exactly match the tilt of the lipid chains, regardless of whether we compare the molecules as a whole or parsed. Such discrepancies have also been discussed in comparing orientations of cholesterol and epicholesterol in lipid bilayers (57), and in theoretical treatments (58). We have observed, that larger tilt values for both cholesterol and lipid chains lead to a more substantial cholesterol induced increase in AUC (e.g., in the case of diC14:1PC), which can result in an exposure of the hydrophobic portion of the cholesterol and lipid molecules to water. This unfavorable energetic dilemma for the system would be worsened on the cholesterol-depleted side in the asymmetric bilayer. However, it has been proposed that lipid headgroups may reorient to provide coverage for exposed regions of cholesterol, minimizing contact with water. Further, it has been suggested that cholesterol may avoid clustering (domain formation) in certain cases to minimize the free energy strain presented by these types of headgroup rearrangements (clusters would not be as easily covered). These phenomena have collectively been termed the “umbrella model” (59).
We have analyzed both cholesterol simulations to determine what effect high cholesterol content has on the structural behavior of lipid headgroups. Although in both lipids the bilayer averaged headgroup tilt (defined by the angle made by the PN dipole relative to the bilayer normal) is unaffected by cholesterol (data not shown), for both lipid types we have detected significant alterations in the position of the headgroups relative to the cholesterol hydroxyls. Fig. 10 shows distributions of the in-plane distance from the cholesterol hydroxyl oxygen to the nitrogen and phosphate atoms from its three closest lipids. A complete lack of preferential headgroup orientation would be reflected in overlapping distributions for the choline and phosphate groups. Instead, in the two closest neighboring lipids the choline group is, on average, positioned in the bilayer plane more closely to the hydroxyl than is the phosphate. In other words, PC headgroups are arranged to best cover cholesterol molecules, supporting the basic premise suggested by the umbrella model. This effect is fully dissipated by the third lipid, indicating that the umbrella is formed by one, or possibly two lipids. We note that the specific size of the umbrella may be sensitive to cholesterol concentrations given that in our systems there are less than two lipids per cholesterol. Fig. 11 shows an actual snapshot from the diC14:1PC + cholesterol simulation that clearly shows the formation of an umbrella.
FIGURE 10.

Distribution of distances in the xy-plane from cholesterol's oxygen to the nitrogen and phosphorus of nearest neighbor, next nearest neighbor, and third nearest neighbor diC22:1PC molecules. A value of zero would indicate a position directly above the cholesterol oxygen. The overlapping distributions of the third nearest neighbor reflect a complete lack of preferential headgroup orientation, whereas the nearest lipids show a significant rearrangement.
FIGURE 11.

A snapshot from the diC14:1PC + cholesterol simulation. The cholesterol molecule is covered by the headgroups of its two neighboring lipids, thus avoiding contact with water molecules. The cholesterol hydroxyl is shown as a red sphere. Surface representations of the lipid headgroups are shown in green. Lipid chains are removed for clarity. Water molecules within 11 Å of the cholesterol hydroxyl are shown in blue.
Elucidating the connection between transverse (e.g., thickness) and lateral (e.g., area, domains) structure in lipid bilayers has become increasingly important given the attention being paid to rafts in cell biology. The primary focus of this study has been on how cholesterol affects thickness, although through the evaluation of in-plane headgroup orientation (the umbrella model) and cholesterol-induced changes in area, we have begun to address lateral properties as well. Our simulations likely do not sample enough of the necessary lateral diffusion of lipid and cholesterol molecules to capture the effects of domain formation, an ongoing struggle for simulations of complex lipid mixtures (60). Understanding the impact of domains on the small-angle scattering profile will be the subject of future studies that combine simulation and experiments in similar ways as done in this study.
We have expended an atypical amount of computational resources in the process of carefully matching our simulated F(q) to that derived from our scattering measurements. The process required considerable patience as the cross-sectional area was refined for each system, and in the case of the asymmetric bilayer, as the degree of cholesterol asymmetry was determined. Generating our best-matching F(q) curves (Figs. 2–5) required over 350 ns of total simulation time (over 100,000 cpu hours). Given this enormous computational expense, it was initially disheartening to recognize the deficiencies of the symmetric diC14:1PC + cholesterol bilayer simulations with respect to their ability to match the “lift-off” in the ULV experimental data. On the other hand, the process of addressing this important detail in the comparison of the data highlights the importance of expanding our approach to simulating bilayer structures from the traditional small, flat patches. Although it remains to be seen exactly what causes the asymmetric distribution of cholesterol in diC14:1PC ULVs (likely an interplay between thickness, area and curvature), our study underscores the importance of careful matching of simulation to experiment. Given the desire to increase the size and time-scale of simulated membrane systems, and the apparent necessity to reduce the chemical details in that process, it becomes critical that simple systems be used to probe the critical structural details that may, or may not, be captured by the simulations.
CONCLUSIONS
We have investigated the influence of cholesterol on the structure of “thin” and “thick” phospholipid bilayers using the joint refinement of all-atom MD simulations and x-ray scattering experimental data. An almost perfect fit of the form factors evaluated in the simulation-based analysis to the main features of the experimental data supports the reliability of the results obtained from the simulations. In response to cholesterol, the bilayer thickness changed in a similar manner in both systems, whereas the impact on the lateral area was more pronounced in the diC14:1PC bilayers. The thickness increase was rationalized by the cholesterol's ordering effect on lipid acyl chains, which dominates over the possibility of rectifying the hydrophobic mismatch, even between the hydrocarbon thickness of the long-chain diC22:1PC lipid and the length of cholesterol molecule. Similarly, the same impact of cholesterol on lipid headgroup structure was concluded for both lipid types. Moreover, we find strong evidence to support the “umbrella model”, in which the polar headgroups of lipid molecules are suggested to rearrange in response to cholesterol, thereby shielding the bilayer's hydrophobic region from water.
The results of our combined experimental and computational study show that lipid acyl chain length has a significant impact on cholesterol orientation in mono-unsaturated bilayers. The distinct physical and chemical properties of the two lipids lead to radically dissimilar orientations of cholesterol, expanding the catalog of lipids in which such behavior has been elucidated recently (43). In general, accommodation of polar moieties in the nonpolar region of lipid membranes is not unique to cholesterol (61). We speculate that similar structural rearrangements as those presented here may facilitate the insertion and stabilization of other biological molecules, such as proteins, into the membrane. As membrane thickness is assumed to play a key role in the proper functioning of proteins, understanding the cell's ability to modulate the thickness of its various membranes is an essential step in elucidating the relationship between the structure and function of biological membranes.
SUPPLEMENTARY MATERIAL
To view all of the supplemental files associated with this article, visit www.biophysj.org.
Supplementary Material
Acknowledgments
The authors thank Prof. Pavol Balgavý for his encouragement at the early stages of this work, and Dr. Scott E. Feller for stimulating discussions and assistance with the MD simulations at various stages of this work.
Access to instruments at the Cornell High Energy Synchrotron Source (CHESS) was funded by a National Science Foundation grant DMR-0225180. N.K was supported through the Visiting Fellow program of the Natural Sciences and Engineering Research Council of Canada. Computational resources were provided by the Minnesota Supercomputer Institute, as well as by Yale University, with the support of Nicholas Carriero and Robert Bjornson. S.T.N. and J.P. were supported by the General Medicine Institute of the National Institutes of Health (GM 44976).
Editor: Thomas J. McIntosh.
References
- 1.Lee, A. G. 2004. How lipids affect the activities of integral membrane proteins. Biochim. Biophys. Acta. 1666:62–87. [DOI] [PubMed] [Google Scholar]
- 2.Cornelius, F., N. Turner, and H. R. Christensen. 2003. Modulation of Na,K-ATPase by phospholipids and cholesterol. II. Steady-state and presteady-state kinetics. Biochemistry. 42:8541–8549. [DOI] [PubMed] [Google Scholar]
- 3.Mitra, K., I. Ubarretxena-Belandia, T. Taguchi, G. Warren, and D. M. Engelman. 2004. Modulation of the bilayer thickness of exocytic pathway membranes by membrane proteins rather than cholesterol. Proc. Natl. Acad. Sci. USA. 101:4083–4088. [DOI] [PMC free article] [PubMed] [Google Scholar]
- 4.Bretscher, M. S., and S. Munro. 1993. Cholesterol and the Golgi apparatus. Science. 261:1280–1281. [DOI] [PubMed] [Google Scholar]
- 5.Harroun, T. A., W. T. Heller, T. M. Weiss, L. Yang, and H. W. Huang. 1999. Experimental evidence for hydrophobic matching and membrane-mediated interactions in lipid bilayers containing gramicidin. Biophys. J. 76:937–945. [DOI] [PMC free article] [PubMed] [Google Scholar]
- 6.Karlovská, J., D. Uhríková, N. Kučerka, J. Teixeira, F. Devínsky, I. Lacko, and P. Balgavý. 2006. Influence of N-dodecyl-N,N-dimethylamine N-oxide on the activity of sarcoplasmic reticulum Ca(2+)-transporting ATPase reconstituted into diacylphosphatidylcholine vesicles: effects of bilayer physical parameters. Biophys. Chem. 119:69–77. [DOI] [PubMed] [Google Scholar]
- 7.Cornelius, F. 2001. Modulation of Na,K-ATPase and Na-ATPase activity by phospholipids and cholesterol. I. Steady-state kinetics. Biochemistry. 40:8842–8851. [DOI] [PubMed] [Google Scholar]
- 8.McIntosh, T. J. 1978. The effect of cholesterol on the structure of phosphatidylcholine bilayers. Biochim. Biophys. Acta. 513:43–58. [DOI] [PubMed] [Google Scholar]
- 9.Kučerka, N., J. Pencer, M. P. Nieh, and J. Katsaras. 2007. Influence of cholesterol on the bilayer properties of monounsaturated phosphatidylcholine unilamellar vesicles. Eur. Phys. J. E. 23:247–254. [DOI] [PubMed] [Google Scholar]
- 10.Rolls, M. M., M. T. Marquardt, M. Kielian, and C. E. Machamer. 1997. Cholesterol-independent targeting of Golgi membrane proteins in insect cells. Mol. Biol. Cell. 8:2111–2118. [DOI] [PMC free article] [PubMed] [Google Scholar]
- 11.Mitchell, D. C., and B. J. Litman. 1998. Effect of cholesterol on molecular order and dynamics in highly polyunsaturated phospholipid bilayers. Biophys. J. 75:896–908. [DOI] [PMC free article] [PubMed] [Google Scholar]
- 12.Pitman, M. C., F. Suits, A. D. Mackerell, Jr., and S. E. Feller. 2004. Molecular-level organization of saturated and polyunsaturated fatty acids in a phosphatidylcholine bilayer containing cholesterol. Biochemistry. 43:15318–15328. [DOI] [PubMed] [Google Scholar]
- 13.Silvius, J. R. 2003. Role of cholesterol in lipid raft formation: lessons from lipid model systems. Biochim. Biophys. Acta. 1610:174–183. [DOI] [PubMed] [Google Scholar]
- 14.Levine, Y. K., and M. H. Wilkins. 1971. Structure of oriented lipid bilayers. Nat. New Biol. 230:69–72. [DOI] [PubMed] [Google Scholar]
- 15.Gallová, J., D. Uhríková, M. Hanulová, J. Teixeira, and P. Balgavý. 2004. Bilayer thickness in unilamellar extruded 1,2-dimyristoleoyl and 1,2-dierucoyl phosphatidylcholine vesicles: SANS contrast variation study of cholesterol effect. Colloids Surf. B Biointerfaces. 38:11–14. [DOI] [PubMed] [Google Scholar]
- 16.Kučerka, N., M.-P. Nieh, J. Pencer, T. Harroun, and J. Katsaras. 2007. The study of liposomes, lamellae and membranes using neutrons and X-rays. Curr. Opin. Coll. Int. Sci. 12:17–22. [Google Scholar]
- 17.Nagle, J. F., and S. Tristram-Nagle. 2000. Structure of lipid bilayers. Biochim. Biophys. Acta. 1469:159–195. [DOI] [PMC free article] [PubMed] [Google Scholar]
- 18.Armen, R. S., O. D. Uitto, and S. E. Feller. 1998. Phospholipid component volumes: determination and application to bilayer structure calculations. Biophys. J. 75:734–744. [DOI] [PMC free article] [PubMed] [Google Scholar]
- 19.Klauda, J. B., N. Kučerka, B. R. Brooks, R. W. Pastor, and J. F. Nagle. 2006. Simulation-based methods for interpreting x-ray data from lipid bilayers. Biophys. J. 90:2796–2807. [DOI] [PMC free article] [PubMed] [Google Scholar]
- 20.Petrache, H. I., S. E. Feller, and J. F. Nagle. 1997. Determination of component volumes of lipid bilayers from simulations. Biophys. J. 72:2237–2242. [DOI] [PMC free article] [PubMed] [Google Scholar]
- 21.Sachs, J. N., H. I. Petrache, and T. B. Woolf. 2003. Interpretation of small angle X-ray measurements guided by molecular dynamics simulations of lipid bilayers. Chem. Phys. Lipids. 126:211–223. [DOI] [PubMed] [Google Scholar]
- 22.Benz, R. W., F. Castro-Roman, D. J. Tobias, and S. H. White. 2005. Experimental validation of molecular dynamics simulations of lipid bilayers: a new approach. Biophys. J. 88:805–817. [DOI] [PMC free article] [PubMed] [Google Scholar]
- 23.Kučerka, N., J. Pencer, J. N. Sachs, J. F. Nagle, and J. Katsaras. 2007. Curvature effect on the structure of phospholipid bilayers. Langmuir. 23:1292–1299. [DOI] [PMC free article] [PubMed] [Google Scholar]
- 24.Huang, J., J. T. Buboltz, and G. W. Feigenson. 1999. Maximum solubility of cholesterol in phosphatidylcholine and phosphatidylethanolamine bilayers. Biochim. Biophys. Acta. 1417:89–100. [DOI] [PubMed] [Google Scholar]
- 25.Tristram-Nagle, S., R. Zhang, R. M. Suter, C. R. Worthington, W. J. Sun, and J. F. Nagle. 1993. Measurement of chain tilt angle in fully hydrated bilayers of gel phase lecithins. Biophys. J. 64:1097–1109. [DOI] [PMC free article] [PubMed] [Google Scholar]
- 26.Tristram-Nagle, S. A. 2007. Preparation of oriented, fully hydrated lipid samples for structure determination using X-ray scattering. Methods Mol. Biol. 400:63–75. [DOI] [PMC free article] [PubMed] [Google Scholar]
- 27.Torbet, J., and M. H. Wilkins. 1976. X-ray diffraction studies of lecithin bilayers. J. Theor. Biol. 62:447–458. [DOI] [PubMed] [Google Scholar]
- 28.Franks, N. P. 1976. Structural analysis of hydrated egg lecithin and cholesterol bilayers. I. X-ray diffraction. J. Mol. Biol. 100:345–358. [DOI] [PubMed] [Google Scholar]
- 29.Lyatskaya, Y., Y. Liu, S. Tristram-Nagle, J. Katsaras, and J. F. Nagle. 2001. Method for obtaining structure and interactions from oriented lipid bilayers. Phys. Rev. E Stat. Nonlin. Soft Matter Phys. 63:011907. [DOI] [PMC free article] [PubMed] [Google Scholar]
- 30.de Gennes, P. G., and J. Prost. 1995. The Physics of Liquid Crystals. Oxford University Press, New York.
- 31.Feller, S. E., and R. W. Pastor. 1999. Constant surface tension simulations of lipid bilayers: the sensitivity of surface areas and compressibilities. J. Chem. Phys. 111:1281–1287. [Google Scholar]
- 32.Edholm, O., and J. F. Nagle. 2005. Areas of molecules in membranes consisting of mixtures. Biophys. J. 89:1827–1832. [DOI] [PMC free article] [PubMed] [Google Scholar]
- 33.Kučerka, N., S. Tristram-Nagle, and J. F. Nagle. 2005. Structure of fully hydrated fluid phase lipid bilayers with monounsaturated chains. J. Membr. Biol. 208:193–202. [DOI] [PubMed] [Google Scholar]
- 34.Pandit, S. A., G. Khelashvili, E. Jakobsson, A. Grama, and H. L. Scott. 2007. Lateral organization in lipid-cholesterol mixed bilayers. Biophys. J. 92:440–447. [DOI] [PMC free article] [PubMed] [Google Scholar]
- 35.Kučerka, N., Y. Liu, N. Chu, H. I. Petrache, S. Tristram-Nagle, and J. F. Nagle. 2005. Structure of fully hydrated fluid phase DMPC and DLPC lipid bilayers using X-ray scattering from oriented multilamellar arrays and from unilamellar vesicles. Biophys. J. 88:2626–2637. [DOI] [PMC free article] [PubMed] [Google Scholar]
- 36.Gurtovenko, A. A., and I. Vattulainen. 2007. Lipid transmembrane asymmetry and intrinsic membrane potential: two sides of the same coin. J. Am. Chem. Soc. 129:5358–5359. [DOI] [PubMed] [Google Scholar]
- 37.Greenwood, A. I., S. Tristram-Nagle, and J. F. Nagle. 2006. Partial molecular volumes of lipids and cholesterol. Chem. Phys. Lipids. 143:1–10. [DOI] [PMC free article] [PubMed] [Google Scholar]
- 38.Pasenkiewicz-Gierula, M., T. Rog, K. Kitamura, and A. Kusumi. 2000. Cholesterol effects on the phosphatidylcholine bilayer polar region: a molecular simulation study. Biophys. J. 78:1376–1389. [DOI] [PMC free article] [PubMed] [Google Scholar]
- 39.Smondyrev, A. M., and M. L. Berkowitz. 1999. Structure of dipalmitoylphosphatidylcholine/cholesterol bilayer at low and high cholesterol concentrations: molecular dynamics simulation. Biophys. J. 77:2075–2089. [DOI] [PMC free article] [PubMed] [Google Scholar]
- 40.Mashl, R. J., H. L. Scott, S. Subramaniam, and E. Jakobsson. 2001. Molecular simulation of dioleoylphosphatidylcholine lipid bilayers at differing levels of hydration. Biophys. J. 81:3005–3015. [DOI] [PMC free article] [PubMed] [Google Scholar]
- 41.Feller, S. E., D. Yin, R. W. Pastor, and A. D. Mackerell, Jr. 1997. Molecular dynamics simulation of unsaturated lipid bilayers at low hydration: parameterization and comparison with diffraction studies. Biophys. J. 73:2269–2279. [DOI] [PMC free article] [PubMed] [Google Scholar]
- 42.Chiu, S. W., E. Jakobsson, S. Subramaniam, and H. L. Scott. 1999. Combined Monte Carlo and molecular dynamics simulation of fully hydrated dioleyl and palmitoyl-oleyl phosphatidylcholine lipid bilayers. Biophys. J. 77:2462–2469. [DOI] [PMC free article] [PubMed] [Google Scholar]
- 43.Harroun, T. A., J. Katsaras, and S. R. Wassall. 2006. Cholesterol hydroxyl group is found to reside in the center of a polyunsaturated lipid membrane. Biochemistry. 45:1227–1233. [DOI] [PubMed] [Google Scholar]
- 44.Marrink, S. J., A. H. de Vries, T. A. Harroun, J. Katsaras, and S. R. Wassall. 2008. Cholesterol shows preference for the interior of polyunsaturated lipid membranes. J. Am. Chem. Soc. 130:10–11. [DOI] [PubMed] [Google Scholar]
- 45.Yeagle, P. L. 1985. Lanosterol and cholesterol have different effects on phospholipid acyl chain ordering. Biochim. Biophys. Acta. 815:33–36. [DOI] [PubMed] [Google Scholar]
- 46.Marsh, D. 2002. Membrane water-penetration profiles from spin labels. Eur. Biophys. J. 31:559–562. [DOI] [PubMed] [Google Scholar]
- 47.McMullen, T. P., R. N. Lewis, and R. N. McElhaney. 1993. Differential scanning calorimetric study of the effect of cholesterol on the thermotropic phase behavior of a homologous series of linear saturated phosphatidylcholines. Biochemistry. 32:516–522. [DOI] [PubMed] [Google Scholar]
- 48.Nezil, F. A., and M. Bloom. 1992. Combined influence of cholesterol and synthetic amphiphilic peptides upon bilayer thickness in model membranes. Biophys. J. 61:1176–1183. [DOI] [PMC free article] [PubMed] [Google Scholar]
- 49.Pasenkiewicz-Gierula, M., W. K. Subczynski, and A. Kusumi. 1991. Influence of phospholipid unsaturation on the cholesterol distribution in membranes. Biochimie. 73:1311–1316. [DOI] [PubMed] [Google Scholar]
- 50.Tu, K., M. L. Klein, and D. J. Tobias. 1998. Constant-pressure molecular dynamics investigation of cholesterol effects in a dipalmitoylphosphatidylcholine bilayer. Biophys. J. 75:2147–2156. [DOI] [PMC free article] [PubMed] [Google Scholar]
- 51.Hamilton, J. A. 2003. Fast flip-flop of cholesterol and fatty acids in membranes: implications for membrane transport proteins. Curr. Opin. Lipidol. 14:263–271. [DOI] [PubMed] [Google Scholar]
- 52.Lange, Y., C. M. Cohen, and M. J. Poznansky. 1977. Transmembrane movement of cholesterol in human erythrocytes. Proc. Natl. Acad. Sci. USA. 74:1538–1542. [DOI] [PMC free article] [PubMed] [Google Scholar]
- 53.Op den Kamp, J. A. 1979. Lipid asymmetry in membranes. Annu. Rev. Biochem. 48:47–71. [DOI] [PubMed] [Google Scholar]
- 54.Schroeder, F., J. R. Jefferson, A. B. Kier, J. Knittel, T. J. Scallen, W. G. Wood, and I. Hapala. 1991. Membrane cholesterol dynamics: cholesterol domains and kinetic pools. Proc. Soc. Exp. Biol. Med. 196:235–252. [DOI] [PubMed] [Google Scholar]
- 55.Steck, T. L., J. Ye, and Y. Lange. 2002. Probing red cell membrane cholesterol movement with cyclodextrin. Biophys. J. 83:2118–2125. [DOI] [PMC free article] [PubMed] [Google Scholar]
- 56.Wang, W., L. Yang, and H. W. Huang. 2007. Evidence of cholesterol accumulated in high curvature regions: implication to the curvature elastic energy for lipid mixtures. Biophys. J. 92:2819–2830. [DOI] [PMC free article] [PubMed] [Google Scholar]
- 57.Murari, R., M. P. Murari, and W. J. Baumann. 1986. Sterol orientations in phosphatidylcholine liposomes as determined by deuterium NMR. Biochemistry. 25:1062–1067. [DOI] [PubMed] [Google Scholar]
- 58.Kessel, A., N. Ben Tal, and S. May. 2001. Interactions of cholesterol with lipid bilayers: the preferred configuration and fluctuations. Biophys. J. 81:643–658. [DOI] [PMC free article] [PubMed] [Google Scholar]
- 59.Huang, J., and G. W. Feigenson. 1999. A microscopic interaction model of maximum solubility of cholesterol in lipid bilayers. Biophys. J. 76:2142–2157. [DOI] [PMC free article] [PubMed] [Google Scholar]
- 60.Pandit, S. A., S. Vasudevan, S. W. Chiu, R. J. Mashl, E. Jakobsson, and H. L. Scott. 2004. Sphingomyelin-cholesterol domains in phospholipid membranes: atomistic simulation. Biophys. J. 87:1092–1100. [DOI] [PMC free article] [PubMed] [Google Scholar]
- 61.Sachs, J. N., and T. B. Woolf. 2003. Understanding the Hofmeister effect in interactions between chaotropic anions and lipid bilayers: molecular dynamics simulations. J. Am. Chem. Soc. 125:8742–8743. [DOI] [PubMed] [Google Scholar]
Associated Data
This section collects any data citations, data availability statements, or supplementary materials included in this article.