Abstract
The reversible aggregation of human red blood cells (RBC) by proteins or polymers continues to be of biologic and biophysical interest, yet the mechanistic details governing the process are still being explored. Although a depletion model with osmotic attractive forces due to polymer depletion near the RBC surface has been proposed for aggregation by the neutral polyglucose dextran, its applicability at high molecular mass has not been established. In this study, RBC aggregation was measured over a wide range of dextran molecular mass (70 kDa to 28 MDa) at concentrations ≤2 g/dL. Our results indicate that aggregation does not monotonically increase with polymer size; instead, it demonstrates an optimum dextran molecular mass around 200-500 kDa. We used a model for depletion-mediated RBC aggregation to calculate the expected depletion energies. This model was found to be consistent with the experimental results and thus provides new insight into polymer-RBC interactions.
INTRODUCTION
The reversible aggregation of human red blood cells (RBC) continues to be of interest in the field of hemorheology because RBC aggregation is a major determinant of the in vitro rheological properties of blood. Enhanced aggregation increases low shear blood viscosity and the degree of non-Newtonian behavior (1,2). In addition, the in vivo flow dynamics and flow resistance of blood are influenced by RBC aggregation (3), and marked increases of RBC aggregation have been observed in several diseases associated with vascular disorders (e.g., diabetes mellitus, hypertension). Measures of RBC aggregation, such as the erythrocyte sedimentation rate (ESR), are commonly used as diagnostic tests and as one index to the efficacy of therapy. For example, ESR is measured during drug therapy for rheumatoid arthritis, and has been shown to be normalized by improved glycemic control in diabetes (4). There is now general agreement regarding the correlations between elevated levels of fibrinogen or other large plasma proteins and enhanced RBC aggregation, and the effects of molecular mass and concentration for neutral polymers have been reported (5). However, the specific mechanisms involved in RBC aggregation have not been fully elucidated, and thus it is not yet possible to fully understand the relations between pathology and altered RBC aggregation.
RBC form multicell linear or branched aggregates in vitro when they are suspended in either plasma or solutions containing large polymers (e.g., dextran ≥40 kDa); RBC aggregates also form in vivo in regions of low flow or stasis and, hence, in regions of low shear. These linear forms are often termed rouleaux because they resemble a stack of coins. It is important to note that RBC aggregation is a reversible process, with aggregates dispersed by mechanical or fluid flow forces and then reforming when the forces are removed. Conversely, RBC agglutination and blood coagulation are irreversible processes due to either protein polymerization or strong antigen-antibody attractive forces. RBC aggregation is primarily determined by the type and concentration of polymers in solution or the plasma level of large proteins and by RBC aggregability (i.e., the intrinsic cell characteristics affecting RBC aggregation) (6). In blood, the protein fibrinogen is a primary determinant of blood viscosity due to its strong tendency to increase both plasma viscosity and RBC aggregation (7). In the past, most reports have primarily examined the ability of plasma proteins to promote aggregation; for example, higher fibrinogen levels have been linked to elevated blood viscosities in hypertensive patients (8).
To our knowledge, there are two coexisting models for RBC aggregation: bridging and depletion. In the bridging model, RBC aggregation is proposed to occur when the bridging forces due to the adsorption of macromolecules onto adjacent cell surfaces exceed disaggregating forces due to electrostatic repulsion, membrane strain, and mechanical shearing (9). This model seems to be similar to other cell interactions such as agglutination; the only difference is that the suggested adsorption energy of the macromolecules is much smaller to be consistent with the relative weakness of the aggregation forces. In contrast, the depletion model proposes quite the opposite. In this model, RBC aggregation occurs as a result of a lower localized protein or polymer concentration near the cell surface compared to the suspending medium (i.e., relative depletion near the cell surface). This exclusion of macromolecules near the cell surface leads to an osmotic gradient, depletion interaction, and attractive forces (10). As with the bridging model, disaggregation forces are electrostatic repulsion, membrane strain, and mechanical shearing.
Several previous reports have examined the experimental and theoretical aspects of depletion aggregation, often termed depletion flocculation, as applied to the general field of colloid chemistry (11–13). However, polymer depletion as a mechanism for RBC aggregation has received much less attention, with only a few reports in the literature relevant to this approach (10,14–17). Although the depletion model is consistent with reports of polymer-induced aggregation (18,19), an apparent flaw of the model arises from the description of RBC-RBC interactions for cells suspended in solutions of very high molecular mass polymers (e.g., dextran > 500 kDa). Using dextran fractions ranging in molecular mass from 40 to 500 kDa and conductance, optical, ultrasound, and viscometric methods, several investigators have indicated that, with increasing molecular weight, dextran fractions become increasingly more effective in causing rouleaux formation (20–22). Conversely, a depletion-mediated aggregation mechanism is more likely to have a nonmonotonic dependence on molecular mass (i.e., declining aggregation above a certain molecular mass), with the relation dependent on the polymer's physicochemical properties and on the nature of the RBC soft surface layer (i.e., its glycocalyx). This study was thus designed to examine the relations between RBC aggregation and affinity versus dextran molecular mass.
MATERIAL AND METHODS
Sample preparation
Blood was drawn from the antecubital vein of healthy adult volunteers into EDTA (1.5 mg/mL), and all measurements were performed within 6 h after venesection. The following dextran fractions were dissolved in phosphate-buffered saline (PBS, 0.01 M phosphate, pH 7.4, 295 ± 5 mOsmL/kg) at the desired final concentrations (in molecular mass): 40 kDa, 70 kDa, 250 kDa, 500 kDa, 2 MDa, and 28 MDa. The dextran fractions were obtained from Sigma Chemical, St. Louis, MO; TDB Consultancy, Uppsala, Sweden; and Amersham Pharmacia Biotech, Uppsala, Sweden. The 28 MDa dextran was prepared by dialyzing a 10-20 MDa fraction from Amersham Pharmacia Biotech to remove some lower molecular mass species, then analyzed by viscometry and quasielastic light scattering (Wyatt Technology, Santa Barbara, CA); only viscometry was used for the other fractions. RBC were separated from whole blood via 2,000 × g centrifugation for 10 min, and the plasma and buffy coat were removed. The RBC were washed twice in PBS, then resuspended in the desired polymer solution at a hematocrit of 40 ± 0.3% for aggregation studies.
Aggregation measurements
The extent of RBC aggregation at stasis was measured using a transparent cone-plate shearing instrument (Aggregometer Model MA-2; Myrenne, Roentgen, Germany) that uses the light transmission method of Klose et al. (23). This technique is based on the increase of light transmission through an RBC suspension that occurs when individual cells aggregate into rouleaux or rouleaux-rouleaux complexes; gaps in the suspending medium between the aggregates allow more light to pass through the RBC suspension. In our study, the Myrenne Aggregometer was modified, as described previously (24): 1), light transmission data were digitized and recorded using an analog/digital converter interfaced to a laboratory computer; and 2), the computer controlled the shear rate in the cone-plate portion of the instrument. In operation, the blood sample is first briefly sheared at 600 s−1 to disperse all preexisting aggregates; then the shear rate abruptly is decreased to zero, after which light transmission is integrated for 10 seconds. The dimensionless numeric value resulting from this integration is termed M. The sample is then again briefly sheared at 600 s−1, after which the shear rate is abruptly reduced to 3 s−1, and the light transmission is again integrated for 10 s. The dimensionless numeric value resulting from this integration is termed M1. Note that M reflects the extent of RBC aggregation at stasis and that M1 reflects the extent of aggregation under conditions at which low fluid shear promotes cell-cell contact; both M and M1 increase with increasing RBC aggregation (24).
Miscellaneous techniques
RBC suspension hematocrits were determined by an automated hematology analyzer (Micros; ABX Diagnostics, Irvine, CA), solution osmolalities by a freezing-point osmometer (model 5004; Precision Systems, Natick, PA), and pH by an Orion system (model 410A; Orion Research, Boston, MA). The viscosity of all suspending media was measured at 25°C by capillary viscometry (Plasma Viscometer II; Coulter Electronics, Luton, UK. In addition, the viscometer was used to determine the intrinsic viscosity [η] of the various polymers by extrapolation of their specific viscosity/concentration ratios to zero concentration (25); intrinsic viscosity values were used to obtain aggregation-molecular mass relations at several fixed levels of suspending media viscosity. The presence of RBC aggregation was observed microscopically using low hematocrit wet mounts of cells suspended in the appropriate medium.
Theory
We have recently proposed a theoretical model to evaluate depletion-mediated RBC interactions in polymer solutions (18). In this study, we outline a simplified approach for evaluating depletion energies in polymer solutions. If a surface is in contact with a polymer solution and the loss of configuration entropy of the polymer is not balanced by adsorption energy, a depletion layer develops near the surface. Within this layer. the polymer concentration is lower than in the bulk phase. Thus, as two RBC approach, the difference of solvent chemical potential (i.e., the osmotic pressure difference) between the intercellular polymer-poor depletion zone and the bulk phase results in solvent displacement into the bulk phase and hence depletion interaction. Due to this interaction, an attractive force develops that tends to minimize the polymer-reduced space between the cells and thus promotes aggregation (26).
Examination of the energetics of depletion layers requires distinguishing between so-called hard and soft or hairy surfaces. Hard surfaces are considered to be smooth and do not allow polymer penetration into the surface, whereas soft surfaces, such as the RBC glycocalyx, are characterized by a layer of attached macromolecules that can be penetrated, in part or entirely, by the free polymer in solution (13,26). For two adjacent cells with soft surfaces at a separation distance d, a glycocalyx thickness δ, a depletion layer thickness Δ, and a penetration p of the polymers into the glycocalyx, the depletion interaction energy wD can be approximated by the following (18):
 |
(1) |
for (d/2 − δ + p) ≤ Δ and is zero for (d/2 − δ + p) > Δ. For small polymer concentrations the osmotic pressure term Π is given by the following:
 |
(2) |
where R, T, and M are the gas constant, absolute temperature, and the molecular mass of the polymer, respectively, and cb represents the bulk polymer concentration. The depletion layer thickness Δ depends on the polymer concentrations. However, at small concentrations, it can be approximated by 1.4 × Rg, with Rg being the polymer's radius of gyration. In turn, Rg can be calculated by the relation Rg =  with Aec for dextran equal to 0.88 nm·mol0.5·kg−0.5.
To compute the dependence of the depletion energy on molecular mass, we can set the distance d in Eq. 1 equal to twice the glycocalyx thickness δ. This leads to the following expression for the depletion energy:
 |
(3) |
Because the depletion energy is zero if the term in brackets is smaller or equal to zero,  together with the penetration p defines a threshold molecular mass for depletion interaction.
It should be noted that the penetration depth p of the free polymer into the attached layer should depend on the polymer type, concentration, and molecular size. It also would be expected to be larger for small molecules and to increase with increasing polymer concentration due to increasing osmotic pressure. One possibility is to calculate p by assuming that penetration proceeds until the local osmotic pressure developed in the attached layer is balanced by the osmotic pressure of the bulk solution (13). It is also possible to consider that the attached polymers collapse under the osmotic pressure of the bulk polymer (27). However, it is difficult to accurately apply such a model to RBC in polymer or protein solution because too little is known about the physicochemical properties of the glycocalyx and, in particular, about the interaction between the glycocalyx and different polymers or proteins.
RESULTS
RBC aggregation
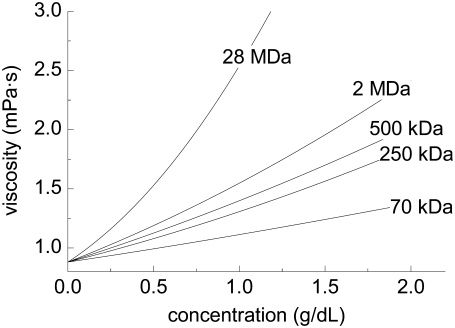
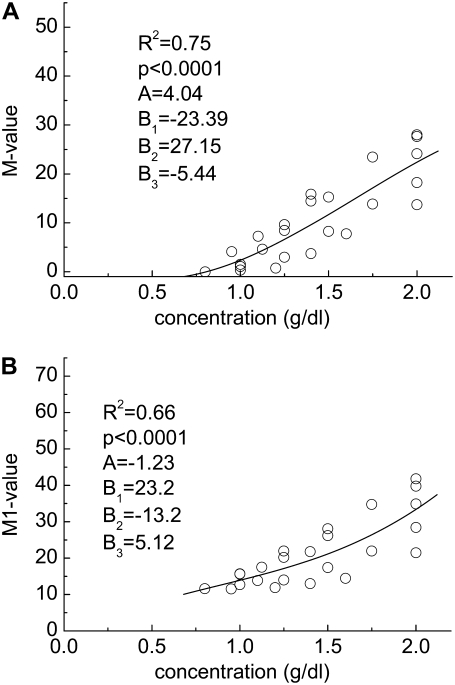
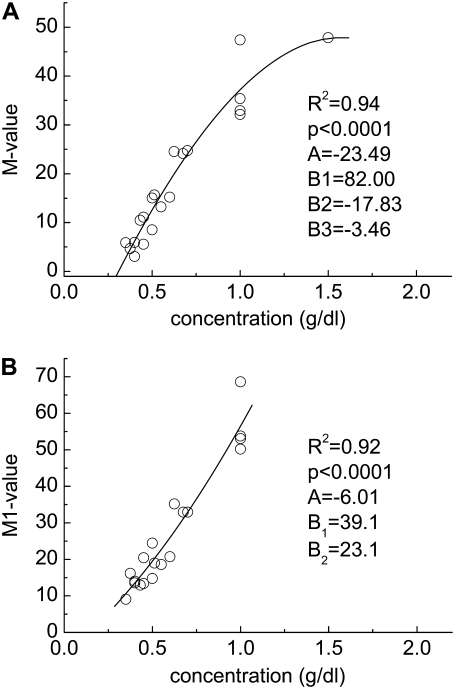
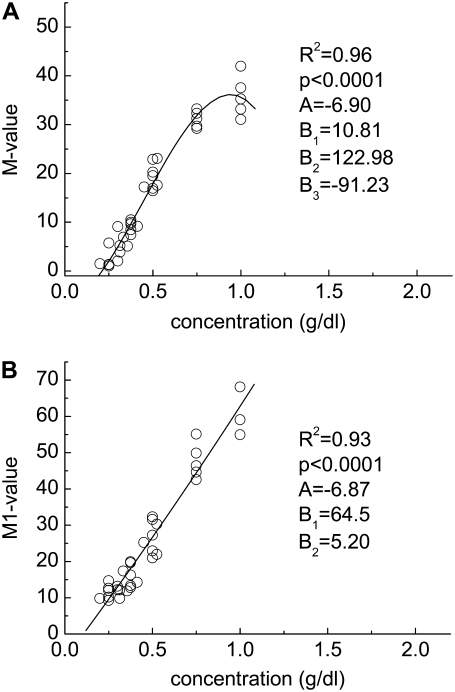
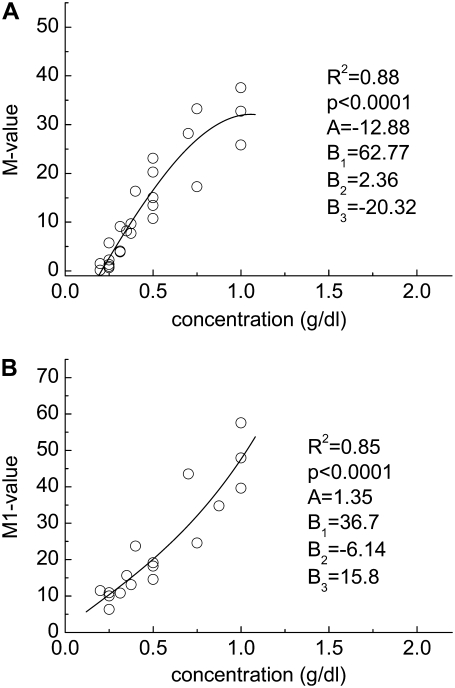
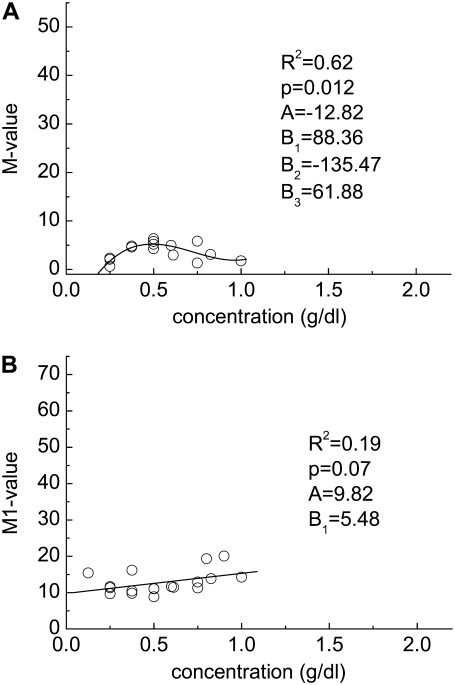
Prior studies of dextran-induced RBC aggregation have focused on molecular mass ≤2 MDa (28), and thus a series of measurements were conducted using five molecular mass dextran fractions (i.e., 70, 250, and 500 kDa; 2 and 28 MDa) at concentrations of ≥2 g/dL. The viscosities of the suspending phase solutions are shown in Fig. 1. RBC aggregation results for 3–5 different donors are presented in Figs. 2 through Fig. 6, with panel A in each Fig. showing the M values and panel B showing the M1 values. The relatively small variations of the aggregation indices at the same concentration are expected, because the data points were obtained using different donors and, hence, are affected by donor/donor differences of cellular factors affecting aggregation in a defined polymer solution (i.e., differences of RBC aggregability) (1). Further, the experimental data indicate that the aggregation-concentration relations for the 70 kDa through 2 MDa fractions have similar shapes, with a minimum concentration needed to initiate aggregation (M value > 0) and a steady increase of aggregation with concentration. The 28 MDa fraction (Fig. 6) also exhibits a minimum concentration to initiate aggregation, but reaches a maximal M value of ∼5 around 0.5 g/dL and then declines with increasing concentration. The range of the M values for RBC in 28 MDa dextran indicate only very low levels of aggregation (Fig. 6 A), and the M1 values (Fig. 6 B) show relatively weak dependence on the polymer concentration with an average value of ∼12.8, thus indicating no stable rouleaux formation at a shear rate of 3 s−1.
FIGURE 1.
Viscosity concentration results for dextran molecular mass fractions used in this study. Data were obtained at 25°C using an automated tube viscometer.
FIGURE 2.
Experimentally determined polymer concentration-RBC aggregation data. (A) M value and (B) M1 value for cells suspended in solutions of dextran having a molecular mass of 70 kDa. Solid lines represent the best fits via a third-order polynomial (y = A + B1x + B2x2 + B3x3).
FIGURE 3.
Experimentally determined polymer concentration-RBC aggregation data. (A) M value and (B) M1 value for cells suspended in solutions of dextran having a molecular mass of 250 kDa. Solid lines represent the best fits via a third-order polynomial (y = A + B1x + B2x2 + B3x3).
FIGURE 4.
Experimentally determined polymer concentration-RBC aggregation data. (A) M value and (B) M1 value for cells suspended in solutions of dextran having a molecular mass of 500 kDa. Solid lines represent the best fits via a third-order polynomial (y = A + B1x + B2x2 + B3x3).
FIGURE 5.
Experimentally determined polymer concentration-RBC aggregation data. (A) M value and (B) M1 value for cells suspended in solutions of dextran having a molecular mass of 2 MDa. Solid lines represent the best fits via a third-order polynomial (y = A + B1x + B2x2 + B3x3).
FIGURE 6.
Experimentally determined polymer concentration-RBC aggregation data. (A) M value and (B) M1 value for cells suspended in solutions of dextran having a molecular mass of 28 MDa. Solid lines represent the best fits via a third-order polynomial (y = A + B1x + B2x2 + B3x3).
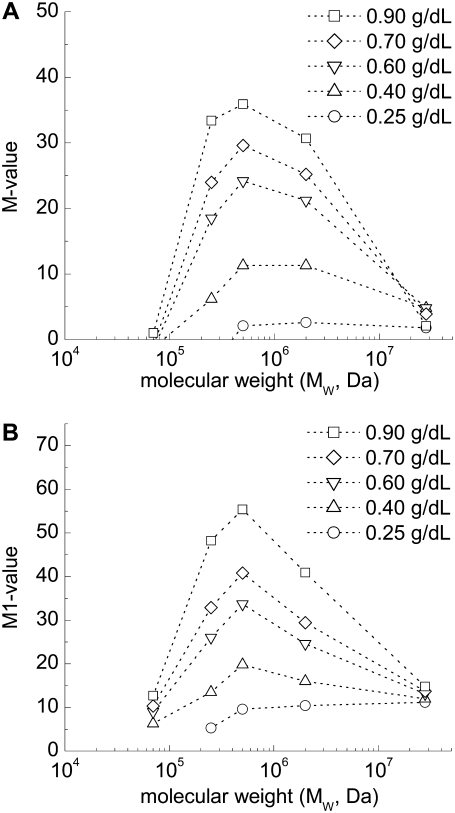
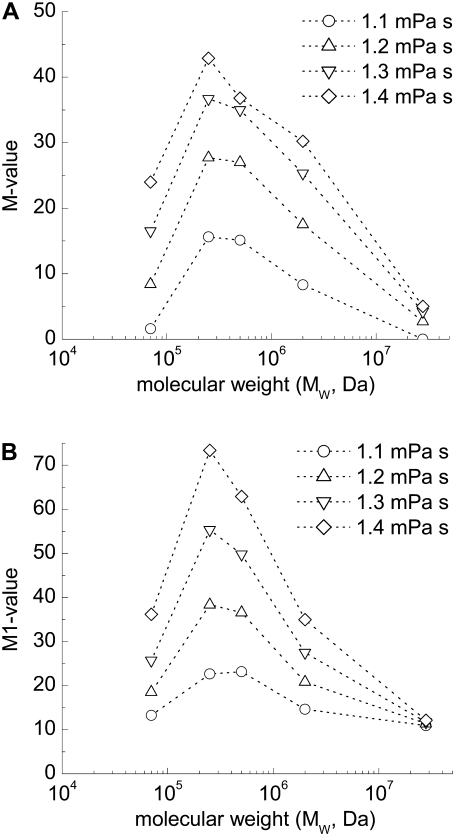
The M or M1 versus concentration data were then fitted to third-order polynomial functions of the form y = A + B1x + B2x2 + B3x3, with regression results and fitting parameters also presented in each panel of Figs. 2–6. Inspection of these figures indicates that the data points are well-fitted by the polynomial functions, with most R2 values ≥ 0.8 (p < .0001). The results in Figs. 2–6were then used to calculate the molecular mass-dependence of aggregation at constant polymer concentration and at constant suspending phase viscosity (see Materials and Methods). Fig. 7 shows calculated aggregation at constant concentrations ranging from 0.25 g/dL to 0.9 g/dL. Regardless of concentration, the curves are clearly bell-shaped with maximal aggregation at a molecular mass ∼500 kDa. Although, in general, the molecular mass for maximal aggregation does not show a significant dependence on polymer concentration, the relationship becomes broader and less defined at lower concentrations and suggests a shift toward higher molecular mass. Fig. 8 shows calculated aggregation at constant suspending phase viscosities ranging from 1.1 mPa·s to 1.4 mPa·s. Relations similar to those shown in Fig. 7 were observed. The molecular mass for maximal aggregation is essentially independent of suspending media viscosity, with broadening at lower viscosity and hence lower dextran concentration.
FIGURE 7.
Calculated dependence of RBC aggregation on molecular mass at different suspending phase polymer concentrations. (A) M value and (B) M1 value. Data points were computed based on the experimental results shown in Figs. 2–6.
FIGURE 8.
Calculated dependence of RBC aggregation on molecular mass at different suspending phase polymer concentrations. (A) M value and (B) M1 value. Data points were computed based on the experimental results shown in Figs. 2–6 (see Materials and Methods).
Theoretical considerations
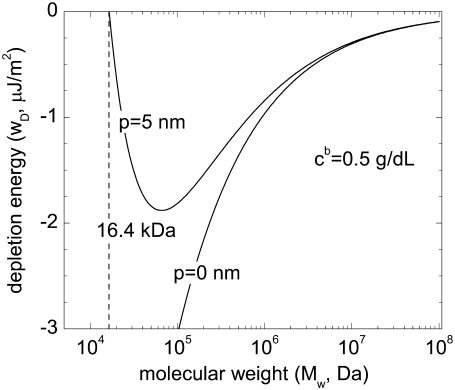
Fig. 9 presents calculated depletion energies at a bulk polymer concentration cb of 0.5 g/dL and a glycocalyx thickness of 5 nm for a cell-cell separation of twice the glycocalyx thickness (Eq. 3). For a hard surface (p = 0), wD depends linearly on  Thus, at constant concentration, the depletion energy wD decreases with increasing molecular mass (Fig. 9). This decrease of wD and hence of aggregation tendency is in opposition to the usually reported steady increase of RBC aggregation in polymer solutions of increasing molecular mass (20–22). For a completely penetrable soft glycocalyx (p = 5 nm), depletion interaction only occurs above a minimal molecular mass (>16.5 kDa); the depletion energy then increases until it reaches a maximum at a molecular mass ∼100 kDa, after which it declines asymptotically toward zero. For larger molecular mass, especially >1 MDa, the difference between hard and soft surface diminishes. Thus the abovementioned theoretical result for a soft surface (p = 5 nm) is qualitatively similar to the experimental data presented in Figs. 7 and 8: depletion interaction only occurs above a minimal molecular mass; the depletion energy then increases, reaches a maximum affinity, and then declines. This agreement between theoretically predicted behavior and experimental results lends credence to a mechanism governed by depletion interaction between soft surfaces.
FIGURE 9.
Theoretical dependence of depletion energy on polymer molecular mass for a suspending phase polymer concentrations c2 of 0.5g/dL and penetration depth p of 0 and 5 nm, respectively (see text for details).
DISCUSSION
Using a wide range of dextran molecular mass fractions (i.e., 70–28,000 kDa), our experimental results clearly support a depletion-mediated model for the aggregation of human RBC by the neutral, water-soluble polymer dextran. Although direct numeric comparisons between the experimentally measured extent of aggregation and the theoretically derived depletion energies is not possible, the relations between these two variables are consistent with our findings that increasing or decreasing theoretical depletion interaction leads to increasing or decreasing experimental RBC aggregation (Figs. 7 and 8). Further, in contrast to previous reports indicating increased aggregation with increased molecular mass (20–22), our experimental results indicate optimal or maximum aggregation at ∼500 kDa (Fig. 6). This molecular mass for maximal experimental aggregation is the same order of magnitude as the maximal depletion interaction predicted theoretically (Fig. 9). Our data thus suggest that the bridging model for polymer-induced RBC aggregation can be rejected, at least for dextran-induced aggregate formation. The extent to which these findings can be extended to other neutral polymers, to charged polymers, and to specific proteins requires additional study.
Although the current depletion model appears robust, it does not consider polymer adsorption onto the RBC surface and so the possible effects of steric interactions or altered depletion layer thickness due to adsorbed polymer. Experimental results for dextran adsorption onto human RBC have been presented (29,30). However, it has also been shown that RBC adsorption data for dextran and proteins are subject to potential artifacts and are quantitatively difficult to interpret (31), thus making their application to the current model tenuous. In addition, our current model has drawbacks that are quite likely due to its simplicity. For example, in future studies, it will be necessary to focus on more realistic treatments of the RBC glycocalyx (e.g., thickness and structure) and how it interacts with polymers or proteins. Such an approach should help in obtaining a quantitative understanding of the molecular mass dependence of aggregation. Lastly, it should be emphasized that only depletion interaction was considered in our calculations. Repulsive forces such as an electrostatic Coulomb force or forces due to the elastic deformation of RBC during aggregation have not been considered. Clearly, such additional forces will tend to inhibit aggregation until a critical threshold energy has been achieved. Consequently, the threshold for depletion interaction to occur is expected to be below that required for observable and measurable aggregation (18).
In overview, our findings provide important new insights into polymer-RBC interactions and thus the stabilization and destabilization of suspensions of biologic particles or cells. In particular, the model should be useful in the development of biocompatible infusion fluids such as plasma expanders. Note the design of such fluids requires a balance between 1), retention in the circulatory system for a desired time period (i.e., not rapidly excreted by the kidneys) and so a large polymer; and 2), either reduced or unaltered cell-cell adhesion such as RBC aggregation and so a small polymer (32,33). Further, it would be of interest to apply this model to currently unresolved aspects of human RBC aggregation, such as the reduced aggregation of neonatal RBC in both plasma and in polymer solutions (34). Application of this model may also be of potential value in human disease, in that disturbed in vivo blood flow consequent to elevated RBC aggregation has been observed in clinical states such as diabetes mellitus, myocardial infarction, and renal disease (33). A clearer understanding of polymer-glycocalyx interactions should allow rationale development of therapeutic agents for improvement of microcirculatory flow.
Acknowledgments
This work was supported by the National Institutes of Health (grants HL015722 and HL070595), the Ministry of Education (Singapore), and the Agency of Science, Technology and Research (A*STAR) Biomedical Research Council, Singapore (grant 05/1/22/19/382).
Editor: Denis Wirtz.
References
- 1.Baskurt, O. K., M. R. Hardeman, H. J. Meiselman, and M. W. Rampling, editors. 2007. Handbook of Hemorheology and Hemodynamics. Amsterdam, IOS Press.
- 2.Neu, B., and H. J. Meiselman. 2008. The role of macromolecules in stabilization and de-stabilization of biofluids. In Bioengineering in Cell and Tissue Research. G. M. Artmann and S. Chien, editors. Springer, New York. 387–408.
- 3.Cabel, M., H. J. Meiselman, A. S. Popel, and P. C. Johnson. 1997. Contribution of red blood cell aggregation to venous vascular resistance in skeletal muscle. Am. J. Physiol. Heart Circ. Physiol. 41:H1020–H1032. [DOI] [PubMed] [Google Scholar]
- 4.Chong-Martinez, B., T. A. Buchanan, R. Wenby, and H. J. Meiselman. 2003. Decreased red blood cell aggregation subsequent to improved glycemic control in type 2 diabetes mellitus. Diabet. Med. 20:301–306. [DOI] [PubMed] [Google Scholar]
- 5.Chien, S., and L. A. Lang. 1987. Physicochemical basis and clinical implications of red cell aggregation. Clin. Hemorheol. 7:71–91. [Google Scholar]
- 6.Rampling, M. W., H. J. Meiselman, B. Neu, and O. K. Baskurt. 2004. Influence of cell-specific factors on red blood cell aggregation. Biorheology. 41:91–112. [PubMed] [Google Scholar]
- 7.Lee, A. J. 1997. The role of rheological and haemostatic factors in hypertension. J. Hum. Hypertens. 11:767–776. [DOI] [PubMed] [Google Scholar]
- 8.Letcher, R. L., S. Chien, T. G. Pickering, J. E. Sealey, and J. H. Laragh. 1981. Direct relationship between blood pressure and blood viscosity in normal and hypertensive subjects. Role of fibrinogen and concentration. Am. J. Med. 70:1195–1202. [DOI] [PubMed] [Google Scholar]
- 9.Brooks, D. E. 1988. Mechanism of red cell aggregation. In Blood Cells, Rheology and Aging. D. Platt, editor. Springer Verlag, Berlin. 158–162.
- 10.Bäumler, H., E. Donath, A. Krabi, W. Knippel, A. Budde, and H. Kiesewetter. 1996. Electrophoresis of human red blood cells and platelets. Evidence for depletion of dextran. Biorheology. 33:333–351. [DOI] [PubMed] [Google Scholar]
- 11.Jenkins, P., and B. Vincent. 1996. Depletion flocculation of nonaqueous dispersions containing binary mixtures of nonadsorbing polymers. Evidence for Nonequilibrium effects. Langmuir. 12:3107–3113. [Google Scholar]
- 12.Vincent, B. 1990. The calculation of depletion layer thickness as a function of bulk polymer concentration. Coll. Surf. 50:241–249. [Google Scholar]
- 13.Vincent, B., J. Edwards, S. Emmett, and A. Jones. 1986. Depletion flocculation in dispersions of sterically-stabilised particles (“soft spheres”). Coll. Surf. 18:261–281. [Google Scholar]
- 14.Armstrong, J. K., H. J. Meiselman, R. B. Wenby, and T. C. Fisher. 2001. Modulation of red blood cell aggregation and blood viscosity by the covalent attachment of Pluronic copolymers. Biorheology. 38:239–247. [PubMed] [Google Scholar]
- 15.Neu, B., and H. J. Meiselman. 2001. Sedimentation and electrophoretic mobility behavior of human red blood cells in various dextran solutions. Langmuir. 17:7973–7975. [Google Scholar]
- 16.Bäumler, H., and E. Donath. 1987. Does dextran indeed significantly increase the surface potential of human red blood cells? Stud. Biophys. 120:113–122. [Google Scholar]
- 17.Neu, B., H. J. Meiselman, and H. Bäumler. 2002. Electrophoretic mobility of human erythrocytes in the presence of poly(styrene sulfonate). Electrophoresis. 23:2363–2368. [DOI] [PubMed] [Google Scholar]
- 18.Neu, B., and H. J. Meiselman. 2002. Depletion-mediated red blood cell aggregation in polymer solutions. Biophys. J. 83:2482–2490. [DOI] [PMC free article] [PubMed] [Google Scholar]
- 19.Neu, B., S. Sowemimo-Coker, and H. Meiselman. 2003. Cell-cell affinity of senescent human erythrocytes. Biophys. J. 85:75–84. [DOI] [PMC free article] [PubMed] [Google Scholar]
- 20.Barshtein, G., I. Tamir, and S. Yedgar. 1998. Red blood cell rouleaux formation in dextran solution: dependence on polymer conformation. Eur. Biophys. J. 27:177–181. [DOI] [PubMed] [Google Scholar]
- 21.Chien, S. 1975. Biophysical behavior of red cells in suspensions. In The Red Blood Cell. D. M. Surgenor, editor. Academic Press, New York. 1031–1133.
- 22.Pribush, A., D. Zilberman-Kravits, and N. Meyerstein. 2007. The mechanism of the dextran-induced red blood cell aggregation. Eur. Biophys. J. 36:85–94. [DOI] [PubMed] [Google Scholar]
- 23.Klose, H. J., E. Volger, H. Brechtelsbauer, L. Heinich, and H. Schmid-Schonbein. 1972. Microrheology and light transmission of blood. I. The photometric effects of red cell aggregation and red cell orientation. Pflugers Archiv. 333:126–139. [DOI] [PubMed] [Google Scholar]
- 24.Bauersachs, R. M., R. B. Wenby, and H. J. Meiselman. 1989. Determination of specific red blood-cell aggregation indexes via an automated-system. Clin. Hemorheol. 9:1–25. [Google Scholar]
- 25.Tanford, C. 1963. Physical Chemistry of Macromolecules. Wiley and Sons, New York.
- 26.Fleer, G. J., M. A. Cohen Stuart, J. H. M. H. Scheutjens, T. Cosgrove, and B. Vincent. 1993. Polymers at Interfaces. Chapman & Hall, London.
- 27.Jones, A., and B. Vincent. 1989. Depletion flocculation in dispersions of sterically-stabilized particles. 2. Modifications to theory and further-studies. Coll. Surf. 42:113–138. [Google Scholar]
- 28.Armstrong, J. K., R. Wenby, H. J. Meiselman, and T. C. Fisher. 2004. The hydrodynamic radii of macromolecules and their effect on red blood cell aggregation. Biophys. J. 87:4259–4270. [DOI] [PMC free article] [PubMed] [Google Scholar]
- 29.Brooks, D. E., R. G. Greig, and J. Janzen. 1980. Mechanism of erythrocyte aggregation. In Erythrocyte Mechanics and Blood Flow. G. R. Cokelet, H. J. Meiselman, and D. E. Brooks, editors. A. R. Liss, New York. 119–140.
- 30.Chien, S., S. Simchon, R. E. Abbot, and K. M. Jan. 1977. Surface adsorption of dextrans on human red cell membrane. J. Colloid Interface Sci. 62:461–470. [Google Scholar]
- 31.Janzen, J., and D. E. Brooks. 1991. A critical reevaluation of the nonspecific adsorption of plasma proteins and dextrans to erythrocytes and the role of these in rouleaux formation. In Interfacial Phenomena in Biological Systems. M. Bender, editor. Marcel Dekker, New York. 193–250.
- 32.Chien, S. 1987. Physiological and pathological significance of hemorheology. In Clinical Hemorheology. S. Chien, J. Dormandy, E. Ernst, and A. Matrai, editors. Kluwer Academic Publishers, Dordrecht, The Netherlands. 125–164.
- 33.Lowe, G. D. O. 1988. Clinical Blood Rheology. CRC Press, Boca Raton, FL.
- 34.Linderkamp, O., P. Ozanne, P. Y. Wu, and H. J. Meiselman. 1984. Red blood cell aggregation in preterm and term neonates and adults. Pediatr. Res. 18:1356–1360. [DOI] [PubMed] [Google Scholar]


